2026-07-27
Home
Japanese

Omega Investment Co., Ltd.
Sansei Landic (Company note – 4Q update)
| Share price (4/4) | ¥1,168 | Dividend Yield (24/12 CE) | 3.42 % |
| 52weeks high/low | ¥1,172/947 | ROE(TTM) | 10.2 % |
| Avg Vol (3 month) | 38.8 thou shrs | Operating margin (TTM) | 9.3 % |
| Market Cap | ¥10.02 bn | Beta (5Y Monthly) | 0.64 |
| Enterprise Value | ¥21.33 bn | Shares Outstanding | 8.241 mn shrs |
| PER (24/12 CE) | 10.2 X | Listed market | TSE Standard |
| PBR (23/12 act) | 0.79 X |
| Click here for the PDF version of this page |
| PDF Version |
Record high sales and profits in FY12/2023. Consecutive dividend increases and expanding property purchasing. The next medium-term plan awaited.
◇FY12/2023 full-year results summary: record sales and profits in all stages.
Sansei Landic (hereafter referred to as ‘the company’) announced good FY12/2023 financial results on 14 February 2024, delivering record-high sales and profits. Sales were 23.3 billion yen (+50% YoY), operating income 2.2 billion yen (+47%), ordinary income 1.8 billion yen (+38%) and net income attributable to owner of parent 1.2 billion yen (+12%), generally in line with the company’s forecast, which was revised upwards twice. The dividend per share will be 33 yen (+5 yen), and ROE has recovered to double digits at 10.2%.
Purchasing was high compared to past trends, although it was 18.6 billion yen (-10% YoY) due to a decrease in old unutilized property purchases. The balance of properties for sale at the end of the year increased to 25.4 billion yen (+7% YoY), which is expected to drive performance in the next financial year and beyond.
◇FY12/2024 company forecast: increasing revenues and a decrease in profits due to conservative assumptions for some projects. The forecast also includes a continued dividend hike.
For FY12/2024, the company forecasts sales of 23.7 billion yen (+2% YoY), operating income of 1.8 billion yen (-17% YoY), ordinary income of 1.5 billion yen (-15% YoY) and net income attributable to owner of parent of 1 billion yen (-16% YoY). The company has stated that it has conservatively estimated some old unutilized properties, which has led to a lower profit forecast, but otherwise, it will do well.
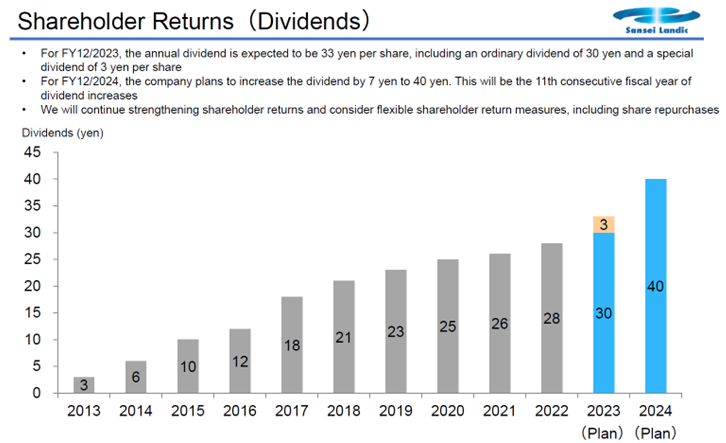
The company plans to start an interim dividend payment. Moreover, the full-year dividend will be 40 yen per share, or an increase of 7 yen, with a payout ratio of 33%. The company is proactive in returning profits to shareholders.
◇Current medium-term plan achieved ahead of schedule, with positive expectations for the new medium-term plan growing.
The numerical targets of the current medium-term plan, which ends in FY12/2024, were achieved in FY12/2023, and the next medium-term plan is awaited. I will be revealed after mid-2024.
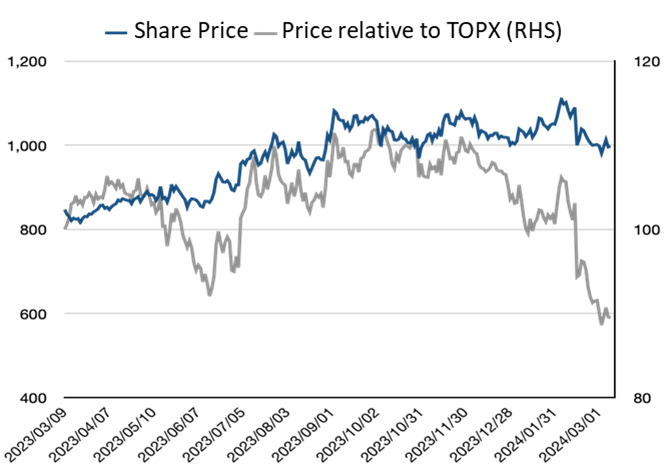
◇Share price trend: share price incorporates the current earnings standstill.
The company’s share price rose from the 800 yen level a year ago to the 1,000 yen level on the back of two upward revisions to its full-year forecasts, reaching a high of 1,115 yen on 7 February 2024. However, the latest results suggested that the company’s earnings would come to a standstill. As a result, the share price has fallen below the 1,000 yen level.
There are many positive factors, such as an increasing stock balance of properties for sale that will generate future sales and the company’s efforts to strengthen shareholder returns through dividends, and the share price does not appear heated, with a single-digit PER and PBR below 1. The share price may be revalued if the company demonstrates favourable medium- to long-term potential and concerns about rising interest rates and falling stock turnover are dispelled. Expectations are high for the new medium-term plan to be announced in the second half of the current fiscal year.
| JPY, mn | Net sales | YoY % |
Oper. profit |
YoY % |
Ord. profit |
YoY % |
Profit ATOP |
YoY % |
EPS (¥) |
DPS (¥) |
| 2019/12 | 18,020 | 7.1 | 1,860 | 5.4 | 1,758 | 7.0 | 1,158 | 15.1 | 137.08 | 23.00 |
| 2020/12 | 17,774 | -1.4 | 847 | -54.5 | 709 | -59.7 | 357 | -69.1 | 42.34 | 25.00 |
| 2021/12 | 16,836 | -5.3 | 1,117 | 31.9 | 999 | 40.9 | 609 | 70.5 | 73.56 | 26.00 |
| 2022/12 | 15,533 | -7.7 | 1,469 | 31.5 | 1,283 | 28.4 | 1,060 | 73.9 | 129.61 | 28.00 |
| 2023/12 | 23,269 | 49.8 | 2,155 | 46.7 | 1,765 | 37.5 | 1,182 | 11.6 | 143.79 | 33.00 |
| 2024/12 (CE) | 23,700 | 1.9 | 1,800 | -16.5 | 1,500 | -15.0 | 1,000 | -15.5 | 121.35 | 40.00 |
◇Summary of FY12/2023 results: record highs in sales and profits.
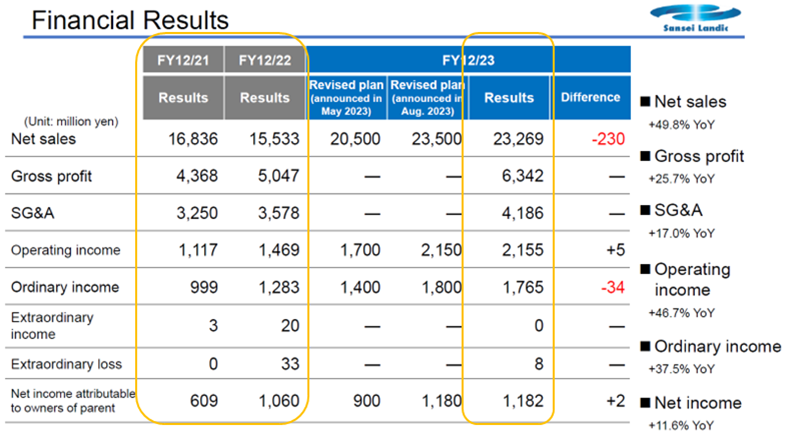
Sansei Landic (hereafter referred to as ‘the company’) announced its FY12/2023 financial results on 14 February 2024, with record-high sales and profits. Sales were 23.3 billion yen (+50% YoY), operating income 2.2 billion yen (+47% YoY), ordinary income 1.8 billion yen (+38% YoY) and net income attributable to owners of parent 1.2 billion yen (+12% YoY), generally in line with the company’s twice upwardly revised forecasts. The dividend per share will be 33 yen (+5 yen), and ROE has recovered to double digits at 10.2%.
The increased uncertainty in the property market led to aggressive sales of inventories, which led to a significant increase in revenues.
Source: company materials
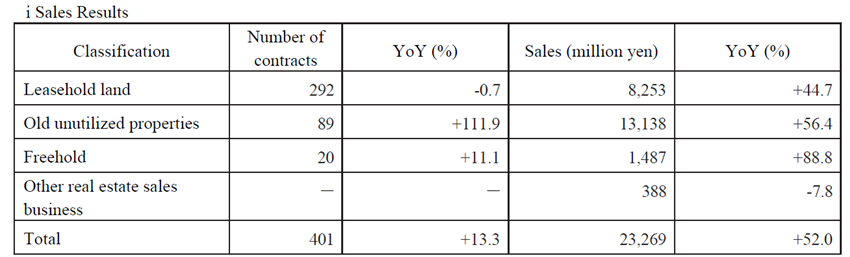
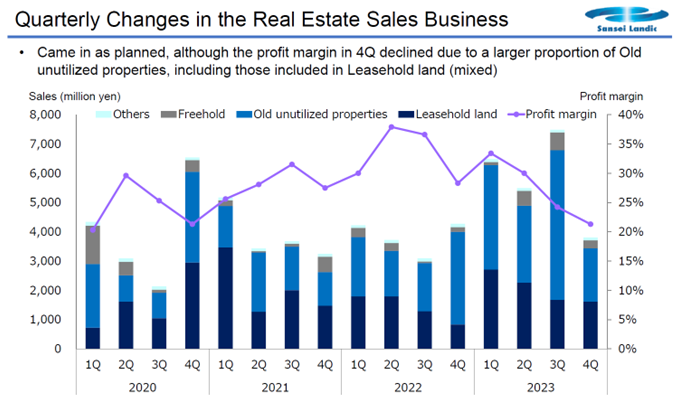
Sales trends were as follows: Leasehold land, Old unutilized properties, and Freehold all grew significantly. The proportion of Old unutilized properties, in particular, increased, contributing to a decline in the gross profit margin. However, due to the increase in overall sales, the operating income margin remained almost unchanged YoY (9.3%, -0.2 percentage points YoY).
Source: Omega Investment from company materials
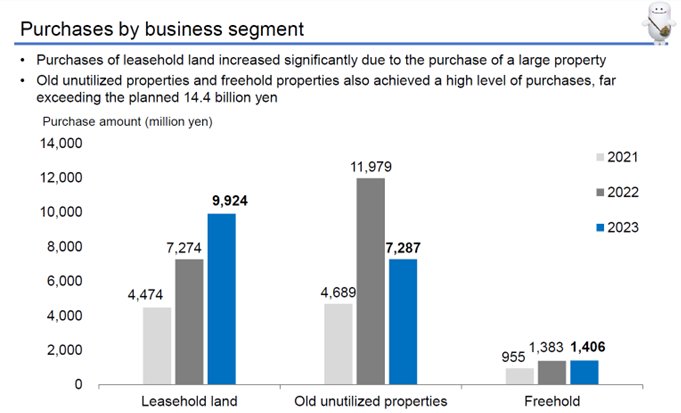
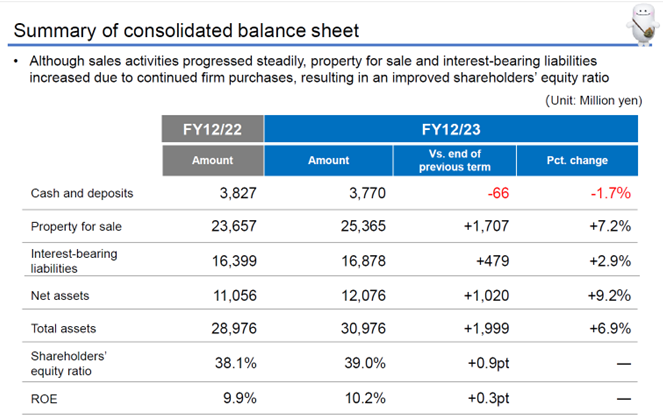
Purchasing was high compared to past trends, although it was 18.6 billion yen (-10% YoY) due to a decrease in Old unutilized property purchases. The balance of properties for sale at the end of the year increased to 25.4 billion yen (+7% YoY), which is expected to drive performance in the next financial year and beyond. Interest-bearing debt has increased correspondingly, but the equity ratio is 39.0%, up 0.9 percentage points YoY.
Source: company materials
Source: company materials
Note that the business posted a small loss in Q4 alone. In addition to low sales, the high proportion of Old unutilized properties puts pressure on profit margins. However, the full-year result is largely in line with company expectations, and there is little need to raise excessive concern at this stage.
Source: company materials
◇FY12/2024 company forecasts: increase in revenues and decrease in profits due to conservative assumptions for some projects and a continued dividend increase.
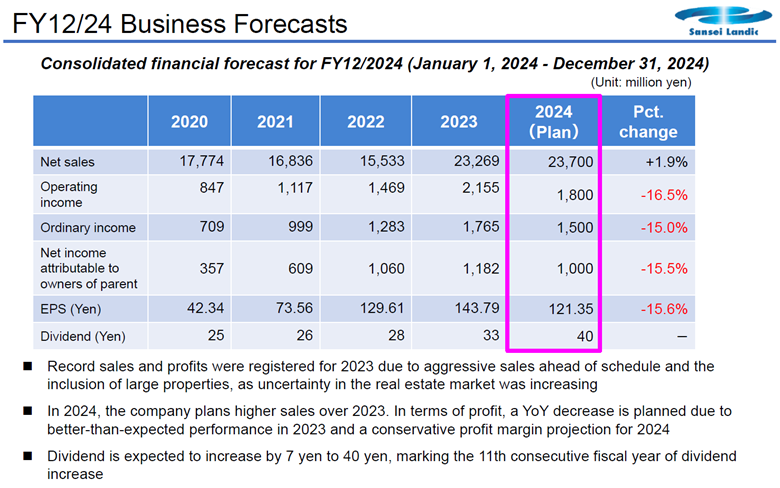
FY12/2024 forecasts are sales of 23.7 billion yen (+2% YoY), operating income of 1.8 billion yen (-17% YoY), ordinary income of 1.5 billion yen (-15% YoY) and net income attributable to owner of parent of 1 billion yen (-16% YoY). The company has stated that it has conservatively estimated some old unutilized properties, leading to the forecast decrease in profit, but otherwise, it reports that the business is performing well.
Source: company materials
When the company’s forecast for the new financial year is broken down by half a year, the declines in revenue and profit are concentrated in the first half of the year. However, the forecast for ordinary income in the year’s first half is almost at the same level as the year before, and ordinary income in the second half of the year is expected to exceed that of last year and the year before. The company is conservatively forecasting profit margins on some old unutilized properties, but in general, the company is on a steady expansion path.
The company plans to start paying an interim dividend and a full-year dividend of 40 yen per share (an increase of 7 yen), with a payout ratio of 33%. Although the shareholder benefit plan was discontinued for the last time in FY2023, the company has shown a positive attitude towards shareholder returns by continuing to increase dividends.
Source: company materials
◇Share price trend: share price is factoring in the current earnings standstill. A new medium-term plan awaited.
The company’s share price rose from the 800 yen level a year ago to the 1,000 yen level on the back of two upward revisions to its full-year forecasts, reaching a high of 1,115 yen on 7 February 2024. However, the latest results suggested that the company’s current financial performance would come to a standstill. As a result, the recent share price has fallen below the 1,000 yen level.
There are many positive factors, such as an increasing inventory backlog of properties for sale that will generate future sales and the strengthening of shareholder returns through dividends, and the share price does not appear heated, with a single-digit PER and PBR below 1. There may be a scenario where the share price is revalued if the company shows favourable medium- to long-term potential and concerns about rising interest rates and declining inventory turnover are dispelled.
The key catalyst for the immediate future is the new medium-term plan, which will be announced later in the year. The plan is expected to present a growth strategy to improve PBR, the content of which will be closely watched. We expect the company to add the elements of solving social issues and accelerating profit growth more strongly than before as an extension of its solid profitability and increasingly aggressive procurement stance.
One point to note is inventory management. The company intends to maximise earnings from each project by managing the turnover period on a case-by-case basis. As interest rates rise and the ability of sellers to raise funds is expected to change, we are interested to see how the company manages its inventory.
Source: company materials
Financial data (quarterly)
2021/12 |
2022/12 |
2023/12 |
||||||||||
1Q |
2Q |
3Q |
4Q |
1Q |
2Q |
3Q |
4Q |
1Q |
2Q |
3Q |
4Q |
|
[Sales by segment] |
||||||||||||
Net sales |
5,365 |
3,744 |
4,089 |
3,637 |
4,444 |
3,721 |
3,094 |
4,272 |
6,486 |
5,494 |
7,484 |
3,805 |
Year-on-year basis |
11.6% |
5.6% |
64.8% |
-47.6% |
-17.2% |
-0.6% |
-24.3% |
17.4% |
45.9% |
47.6% |
141.9% |
-10.9% |
Real estate sales business |
5,171 |
3,434 |
3,679 |
3,244 |
4,222 |
3,721 |
3,094 |
4,272 |
6,486 |
5,493 |
7,484 |
3,806 |
Year-on-year basis |
19.2% |
11.1% |
72.1% |
-50.4% |
-18.3% |
8.3% |
-15.9% |
31.7% |
53.6% |
47.6% |
141.8% |
-10.9% |
Sales composition ratio |
96.4% |
91.7% |
90.0% |
89.2% |
95.0% |
100.0% |
100.0% |
100.0% |
100.0% |
100.0% |
100.0% |
100.0% |
Leasehold land |
3,464 |
1,267 |
2,003 |
1,474 |
1,793 |
1,794 |
1,284 |
832 |
2,707 |
2,259 |
1,674 |
1,613 |
Year-on-year basis |
381.4% |
-21.5% |
91.9% |
-50.0% |
-48.2% |
41.6% |
-35.9% |
-43.6% |
51.0% |
25.9% |
30.4% |
93.9% |
Sales composition ratio |
64.6% |
33.8% |
49.0% |
40.5% |
40.3% |
48.2% |
41.5% |
19.5% |
41.7% |
41.1% |
22.4% |
42.4% |
Old unutilized properties |
1,419 |
2,025 |
1,488 |
1,151 |
2,024 |
1,556 |
1,649 |
3,170 |
3,571 |
2,633 |
5,113 |
1,821 |
Year-on-year basis |
-34.9% |
125.8% |
70.6% |
-62.9% |
42.6% |
-23.2% |
10.8% |
175.4% |
76.4% |
69.2% |
210.1% |
-42.6% |
Sales composition ratio |
26.4% |
54.1% |
36.4% |
31.6% |
45.5% |
41.8% |
53.3% |
74.2% |
55.1% |
47.9% |
68.3% |
47.9% |
Freehold |
191 |
46 |
101 |
526 |
315 |
266 |
49 |
157 |
101 |
504 |
603 |
279 |
Year-on-year basis |
-85.3% |
-90.1% |
-4.7% |
33.2% |
64.9% |
478.3% |
-51.5% |
-70.2% |
-67.9% |
89.5% |
1140.8% |
77.7% |
Sales composition ratio |
3.6% |
1.2% |
2.5% |
14.5% |
7.1% |
7.1% |
1.6% |
3.7% |
1.6% |
9.2% |
8.1% |
7.3% |
Others |
96 |
95 |
88 |
94 |
89 |
105 |
112 |
114 |
105 |
97 |
90 |
96 |
Year-on-year basis |
-28.3% |
-18.8% |
-24.1% |
-3.1% |
-7.3% |
10.5% |
27.3% |
21.3% |
19.1% |
-8.6% |
-19.6% |
-15.8% |
Sales composition ratio |
1.8% |
2.5% |
2.2% |
2.6% |
2.0% |
2.8% |
3.6% |
2.7% |
1.6% |
1.7% |
1.2% |
2.5% |
Construction business |
194 |
309 |
409 |
392 |
222 |
– |
– |
– |
– |
– |
– |
– |
Year-on-year basis |
-58.4% |
-32.1% |
19.3% |
-0.8% |
14.0% |
– |
– |
– |
– |
– |
– |
– |
Sales composition ratio |
3.6% |
8.3% |
10.0% |
10.8% |
5.0% |
– |
– |
– |
– |
– |
– |
– |
[Statements of income] |
||||||||||||
Net sales |
5,365 |
3,744 |
4,089 |
3,637 |
4,444 |
3,721 |
3,096 |
4,272 |
6,486 |
5,494 |
7,484 |
3,805 |
Cost of sales |
4,020 |
2,756 |
2,945 |
2,745 |
3,146 |
2,310 |
1,963 |
3,066 |
4,320 |
3,859 |
5,681 |
3,067 |
Gross profit |
1,344 |
986 |
1,143 |
892 |
1,297 |
1,411 |
1,132 |
1,206 |
2,166 |
1,636 |
1,803 |
737 |
SG&A expenses |
816 |
826 |
805 |
802 |
850 |
946 |
845 |
937 |
1,084 |
1,097 |
1,127 |
879 |
Operating profit |
528 |
160 |
338 |
90 |
447 |
466 |
287 |
269 |
1,118 |
538 |
675 |
-176 |
Non-operating profit |
12 |
8 |
8 |
6 |
7 |
7 |
6 |
7 |
8 |
6 |
20 |
-6 |
Non-operating expenses |
37 |
40 |
34 |
39 |
39 |
55 |
54 |
64 |
80 |
165 |
88 |
86 |
Ordinary income |
502 |
128 |
311 |
56 |
415 |
417 |
239 |
212 |
1,045 |
378 |
595 |
-253 |
Extraordinary income |
3 |
0 |
0 |
0 |
19 |
0 |
0 |
1 |
0 |
0 |
0 |
0 |
Extraordinary expenses |
0 |
0 |
8 |
7 |
0 |
0 |
8 |
1 |
||||
Loss before income taxes |
506 |
128 |
311 |
56 |
435 |
399 |
231 |
205 |
1,045 |
378 |
586 |
-253 |
Total income taxes |
183 |
48 |
166 |
-4 |
59 |
60 |
36 |
54 |
361 |
122 |
199 |
-109 |
Net income |
323 |
79 |
145 |
61 |
375 |
338 |
196 |
151 |
683 |
255 |
387 |
-142 |
[Balance Sheets] |
||||||||||||
Current assets |
17,554 |
17,371 |
18,769 |
18,968 |
19.018 |
21,579 |
26,379 |
27,929 |
28,392 |
29,382 |
29,233 |
29,522 |
Property for sale |
13,493 |
12,586 |
13,134 |
13,301 |
13,304 |
15,152 |
20,775 |
23,657 |
24,404 |
24,623 |
23,490 |
25,365 |
Non-current assets |
951 |
1,054 |
1,081 |
1,082 |
1,124 |
1,099 |
1,129 |
1,047 |
1,233 |
1,394 |
1,399 |
1,455 |
Tangible assets |
291 |
290 |
293 |
301 |
317 |
313 |
314 |
299 |
312 |
529 |
520 |
516 |
Investments and other assets |
595 |
703 |
732 |
730 |
761 |
743 |
769 |
701 |
873 |
817 |
836 |
891 |
Total assets |
18,505 |
18,425 |
19,849 |
20,051 |
20,134 |
22,678 |
27,508 |
28,976 |
29,626 |
30,777 |
30,632 |
30,976 |
Current liabilities |
5,517 |
7,540 |
8,633 |
8,731 |
8,153 |
8,871 |
11,168 |
12,606 |
13,658 |
16,133 |
16,375 |
15,746 |
Short-term borrowings |
4,272 |
6,105 |
7,171 |
7,367 |
7,170 |
5,058 |
7,603 |
11,366 |
11,968 |
13,975 |
14,470 |
13,973 |
Non-current liabilities |
2,919 |
792 |
976 |
1,017 |
1,525 |
3,114 |
5,453 |
5,314 |
4,405 |
2,810 |
2,035 |
3,153 |
Long-Term Borrowings |
2,570 |
483 |
683 |
740 |
1,260 |
2,828 |
5,153 |
5,033 |
4,093 |
2,545 |
1,791 |
2,905 |
Total liabilities |
8,436 |
8,332 |
9,609 |
9,749 |
10 |
11,968 |
16,622 |
17,920 |
18,064 |
18,943 |
18,411 |
18,899 |
Total net assets |
10,070 |
10,093 |
10,240 |
10,301 |
10,463 |
10,692 |
10,886 |
11,056 |
11,561 |
11,833 |
12,220 |
12,077 |
Total shareholders’ equity |
10,070 |
10,093 |
10,240 |
10,297 |
10,459 |
10,688 |
10,882 |
11,052 |
11,562 |
11,833 |
12,220 |
12,077 |
Capital stock |
818 |
820 |
820 |
820 |
821 |
822 |
824 |
833 |
860 |
860 |
860 |
861 |
Legal capital reserve |
779 |
781 |
781 |
781 |
782 |
785 |
786 |
796 |
823 |
824 |
824 |
825 |
Retained earnings |
8,577 |
8,656 |
8,802 |
8,863 |
9,023 |
9,362 |
9,557 |
9,708 |
10,164 |
10,419 |
10,807 |
10,664 |
Stock acquisition right |
4 |
4 |
4 |
4 |
4 |
3 |
3 |
3 |
– |
– |
– |
0 |
Total liabilities and net assets |
18,505 |
18,425 |
19,849 |
20,051 |
20,134 |
22,678 |
27,508 |
28,976 |
29,626 |
30,777 |
30,632 |
30,976 |
[Statements of cash flows] |
||||||||||||
Cash flow from operating activities |
2,110 |
1,704 |
1,184 |
-9,267 |
911 |
-12 |
||||||
Loss before income taxes |
635 |
1,003 |
833 |
1,269 |
1,423 |
1,756 |
||||||
Cash flow from investing activities |
-26 |
-51 |
-205 |
-266 |
-655 |
-766 |
||||||
Cash flow from financing activities |
-2,129 |
-608 |
-559 |
7,971 |
-56 |
303 |
||||||
Net increase in cash and cash equiv. |
-46 |
1,045 |
420 |
-1,563 |
200 |
0 |
||||||
Cash and cash equiv. at beginning of period |
3,707 |
3,707 |
4,752 |
4,752 |
3,188 |
-475 |
||||||
Cash and cash equiv. at end of period |
3,661 |
4,752 |
5,173 |
3,188 |
3,839 |
3,189 |
Source: Omega Investment from company materials
Financial data (Full year)
2013/12 |
2014/12 |
2015/12 |
2016/12 |
2017/12 |
2018/12 |
2019/12 |
2020/12 |
2021/12 |
2022/12 |
2023/12 |
2024/12(予) |
|
[Statements of income] |
||||||||||||
Net sales |
9,187 |
10,443 |
11,567 |
12,300 |
13,098 |
16,833 |
18,020 |
17,774 |
16,836 |
15,533 |
23,269 |
23,700 |
YoY change (%) |
-3.0 |
13.7 |
10.8 |
6.3 |
6.5 |
28.5 |
7.1 |
-1.4 |
-5.3 |
-7.7 |
49.8 |
1.9 |
Cost of sales |
6,254 |
7,055 |
7,798 |
8,344 |
8,566 |
12,028 |
12,902 |
13,788 |
12,467 |
10,485 |
16,927 |
|
Gross profit |
2,934 |
3,389 |
3,769 |
3,957 |
4,532 |
4,805 |
5,119 |
3,986 |
4,368 |
5,047 |
6,342 |
|
SG&A expenses |
2,014 |
2,184 |
2,470 |
2,510 |
2,770 |
3,039 |
3,258 |
3,139 |
3,250 |
3,578 |
4,187 |
|
Operating profit |
920 |
1,205 |
1,300 |
1,446 |
1,762 |
1,766 |
1,861 |
847 |
1,117 |
1,469 |
2,155 |
1,800 |
YoY change (%) |
77.9 |
30.9 |
7.9 |
11.3 |
21.9 |
0.2 |
5.4 |
-54.5 |
31.9 |
31.5 |
46.7 |
-16.5 |
Operating income margin (%) |
10.0 |
11.5 |
11.2 |
11.8 |
13.5 |
10.5 |
10.3 |
4.8 |
6.6 |
9.5 |
9.3 |
7.6 |
Non-operating profit |
12 |
14 |
15 |
15 |
12 |
28 |
42 |
88 |
34 |
26 |
28 |
|
Non-operating expenses |
122 |
174 |
118 |
133 |
106 |
150 |
144 |
226 |
152 |
212 |
419 |
|
Ordinary income |
166 |
272 |
||||||||||
Extraordinary income |
810 |
1,044 |
1,196 |
1,329 |
1,669 |
1,643 |
1,759 |
709 |
999 |
1,283 |
1,765 |
1,500 |
Extraordinary expenses |
85.4 |
28.9 |
14.6 |
11.1 |
25.6 |
-1.6 |
7.1 |
-59.7 |
40.9 |
28.4 |
37.6 |
-15.0 |
Loss before income taxes |
8.8 |
10.0 |
10.3 |
10.8 |
12.7 |
9.8 |
9.8 |
4.0 |
5.9 |
8.3 |
7.6 |
6.3 |
Total income taxes |
97 |
32 |
3 |
20 |
0 |
|||||||
Net income attributable to owner of parent |
94 |
104 |
29 |
33 |
9 |
|||||||
YoY change (%) |
810 |
1,044 |
1,196 |
1,329 |
1,672 |
1,539 |
1,759 |
712 |
1,003 |
1,269 |
1,756 |
|
Net income margin (%) |
354 |
418 |
472 |
475 |
561 |
533 |
600 |
355 |
394 |
209 |
573 |
|
456 |
626 |
724 |
854 |
1,111 |
1,007 |
1,159 |
358 |
609 |
1,060 |
1,183 |
1,000 |
|
[Balance Sheets] |
95.4 |
37.5 |
15.6 |
17.9 |
30.2 |
-9.4 |
15.1 |
-69.1 |
70.5 |
73.9 |
11.6 |
-15.5 |
Current assets |
5.0 |
6.0 |
6.3 |
6.9 |
8.5 |
6.0 |
6.4 |
2.0 |
3.6 |
6.8 |
5.1 |
4.2 |
Property for sale |
||||||||||||
Non-current assets |
||||||||||||
Tangible assets |
8,023 |
7,836 |
10,366 |
9,749 |
15,874 |
15,745 |
18,094 |
19,040 |
18,968 |
27,929 |
29,522 |
|
Investments and other assets |
6,346 |
5,166 |
7,699 |
6,877 |
11,863 |
11,678 |
13,493 |
14,424 |
13,301 |
23,657 |
25,365 |
|
Total assets |
895 |
957 |
1,031 |
1,083 |
1,042 |
1,032 |
1,199 |
1,030 |
1,082 |
1,047 |
1,455 |
|
Current liabilities |
569 |
603 |
572 |
591 |
467 |
458 |
456 |
306 |
301 |
299 |
516 |
|
Short-term borrowings |
226 |
258 |
383 |
405 |
494 |
505 |
669 |
655 |
730 |
701 |
891 |
|
Non-current liabilities |
8,919 |
8,793 |
11,398 |
10,833 |
16,916 |
16,777 |
19,294 |
20,071 |
20,050 |
28,976 |
30,976 |
|
Long-Term Borrowings |
4,587 |
3,165 |
4,910 |
3,751 |
8,430 |
6,160 |
9,047 |
5,772 |
8,731 |
12,606 |
15,746 |
|
Total liabilities |
3,362 |
2,093 |
3,776 |
2,622 |
7,074 |
4,726 |
7,203 |
4,463 |
7,368 |
11,366 |
13,973 |
|
Total net assets |
465 |
367 |
453 |
226 |
479 |
1,710 |
351 |
4,232 |
1,017 |
5,314 |
3,153 |
|
Total shareholders’ equity |
419 |
316 |
175 |
84 |
362 |
1,320 |
0 |
3,879 |
740 |
5,033 |
2,905 |
|
Capital stock |
5,051 |
3,531 |
5,363 |
3,977 |
8,909 |
7,869 |
9,399 |
10,004 |
9,748 |
17,920 |
18,899 |
|
Legal capital reserve |
3,868 |
5,262 |
6,034 |
6,856 |
8,006 |
8,908 |
9,894 |
10,066 |
10,301 |
11,056 |
12,077 |
|
Retained earnings |
3,868 |
5,262 |
6,034 |
6,852 |
8,002 |
8,904 |
9,890 |
10,062 |
10,297 |
11,052 |
12,077 |
|
Stock acquisition right |
257 |
661 |
710 |
720 |
788 |
811 |
814 |
818 |
820 |
834 |
861 |
|
Total liabilities and net assets |
218 |
622 |
671 |
681 |
749 |
772 |
775 |
779 |
781 |
796 |
825 |
|
Equity ratio (%) |
3,393 |
3,978 |
4,654 |
5,451 |
6,464 |
7,320 |
8,302 |
8,465 |
8,863 |
9,709 |
10,664 |
|
4 |
4 |
4 |
4 |
4 |
4 |
3 |
0 |
|||||
[Statements of cash flows] |
8,919 |
8,793 |
11,398 |
10,833 |
16,916 |
16,777 |
19,294 |
20,071 |
20,050 |
28,976 |
30,976 |
|
Cash flow from operating activities |
43.4 |
59.8 |
52.9 |
63.3 |
47.3 |
53.1 |
51.3 |
50.1 |
51.4 |
38.1 |
39.0 |
|
Loss before income taxes |
||||||||||||
Cash flow from investing activities |
||||||||||||
Cash flow from financing activities |
-664 |
1,761 |
-1,451 |
1,611 |
-3,666 |
1,617 |
-420 |
-917 |
1,704 |
-9,267 |
-12 |
|
Issuance of shares |
810 |
1,044 |
1,196 |
1,329 |
1,672 |
1,539 |
1,759 |
712 |
1,003 |
1,269 |
1,756 |
|
Net increase in cash and cash equiv. |
-175 |
-111 |
-116 |
-184 |
107 |
-64 |
-71 |
-288 |
-51 |
-266 |
-766 |
|
Cash and cash equiv. at beginning of period |
1,136 |
-612 |
1,588 |
-1,278 |
4,667 |
-1,495 |
984 |
953 |
-608 |
7,971 |
303 |
|
Cash and cash equiv. at end of period |
800 |
97 |
21 |
37 |
45 |
6 |
9 |
|||||
Free cash flow |
296 |
1,039 |
22 |
150 |
1,108 |
58 |
493 |
-251 |
1,045 |
-1,563 |
-475 |
|
[Statements of income] |
793 |
1,089 |
2,128 |
2,150 |
2,299 |
3,407 |
3,465 |
3,959 |
3,707 |
4,752 |
3,189 |
|
Net sales |
1,089 |
2,128 |
2,150 |
2,299 |
3,407 |
3,465 |
3,959 |
3,707 |
4,752 |
3,188 |
2,714 |
|
YoY change (%) |
-839 |
1,650 |
-1,567 |
1,427 |
-3,559 |
1,553 |
-491 |
-1,205 |
1,653 |
-9,533 |
-777 |
Source: Omega Investment from company materials