2026-07-27
Home
Japanese

Omega Investment Co., Ltd.
Prestige International (Investment report – 4Q update)
| Share price (6/15) | ¥651 | Dividend Yield (27/3 CE) | 4.3 % |
| 52weeks high/low | ¥586/762 | ROE(26/3 act) | 12.5 % |
| Avg Vol (3 month) | 407.3 thou shrs | Operating margin (26/3 act) | 12.5 % |
| Market Cap | ¥82.79 bn | Beta (5Y Monthly) | 0.21 |
| Enterprise Value | ¥60.54 bn | Shares Outstanding | 127.176 mn shrs |
| PER (27/3 CE) | 13.7 X | Listed market | TSE Prime |
| PBR (26/3 act) | 1.7 X |
| Click here for the PDF version of this page |
| PDF version |
Prestige International, which has maintained high capital efficiency and cash flow growth for approximately 20 years, has fair value under multiple valuation methods that exceeds the current share price, and the substantial year-to-date correction has made the long-term scope for share-price revaluation even more pronounced.
Investment conclusion
Reassessing long-term capital efficiency and cash-generating capability, the share-price decline is an opportunity to increase the holding ratio
Prestige International Inc. (the “Company”) can be evaluated positively over the medium- to long-term, and we view the current share price as a phase in which the holding ratio should be increased. In FY3/2026, the Company posted sales of 70.911 billion yen, operating profit of 8.869 billion yen, ordinary profit of 9.772 billion yen, and net profit attributable to owners of parent of 5.920 billion yen, setting record highs in sales and in profits at each level. Operating cash flow was 10.4 billion yen, net cash was approximately 21.9 billion yen, and ROIC was 12.4%, indicating high quality as an investment target in terms of both financial stability and capital efficiency. A market capitalization of 83.5 billion yen, a forward PER of 14.9x, and an actual PBR of 1.69x do not represent excessive levels for a stable earnings company. Rather, given the Company’s long-term track record of expanding top-line sales and cash flow while avoiding major deterioration in its balance sheet and maintaining ROE in the 10% range and a high ROIC spread, the current share price is at a level that warrants an increase in the holding ratio by medium- to long-term investors. The fair value, calculated using multiple valuation methods by Omega Investment, exceeds the current share price in each case, and the share price correction since the beginning of the year provides sufficient grounds for investors evaluating the Company’s long-term cash-generating capability and capital efficiency to increase their holding ratio.
In the previous report, we positioned the core investment appeal as “stable earnings and cash generation created by operating know-how and economies of scale.” We cited contract price increase, margin improvement, hiring and retention, utilization rates, and the continuity of shareholder returns as conditions for revaluation. This time, clear progress was seen in price revisions and shareholder returns among those factors. The Company explains that contract price increases, in response to rising prices, were implemented sequentially toward the second half and lifted results. In addition, in FY3/2026, the Company paid a dividend of 26 yen per share and carried out approximately 1.5 billion yen in share repurchases, and it plans a dividend of 28 yen per share in FY3/2027. This return design, combining stable growth and returns, provides a basis for positioning the Company’s shares as a stock suited for medium- to long-term holding.
The reason for revising the investment conclusion to a positive stance is that, although the share price has declined, there is scope for improvement in both earnings quality and valuation. In the Automotive Business, although the Company faced higher outsourcing costs to towing-truck partner companies, contract price increases and new client acquisition led to an improvement over the initial forecast of lower profit. In the Financial Guarantee Business, the Company maintained double-digit growth in both sales and operating profit, with sales of 12.282 billion yen and an operating profit of 2.766 billion yen. At the same time, the Customer Business also achieved a 30.1% increase in operating profit despite lower sales, reflecting contract price increase and strategic re-examination of the client base. Concerns over slower growth, higher labor costs, and the burden of DX investment may be weighing on the share price. Still, based on the Company’s cash-generating capability and capital efficiency, the recent share price correction could present an attractive entry point for medium- to long-term investors.
Looking again at the source of the Company’s strength, it lies in its ability to operate 24/7/365 contact centers, field staff dispatch arrangements, outsourcing partner company networks, and IT business as an integrated whole. This operating platform is deeply embedded in client companies’ workflows, making the cost of changing outsourcing providers high and recurring earnings easier to generate.
Furthermore, by also possessing high-margin areas such as the Financial Guarantee Business, the Company has formed an earnings structure that is one step beyond a standalone BPO model, which is vulnerable to rising labor costs. In summary, while maintaining our previous evaluation of the Company as a high-quality stock suitable for medium- to long-term holding, we believe that the timely share-price decline warrants a positive revision to the share-price assessment. However, the operating margin is flat at 12.5%. Before taking a more aggressive stance on increasing the holding ratio, we would like to confirm the FY3/2027 plan for operating profit of 9.6 billion yen, productivity after the Akita BPO Katagami Campus begins operations, and the earnings contribution of AI/DX investment. If these are shown successively, the share price may react significantly.
◇ FY3/2026 results highlight: Record-high performance updated; contract price increase and the Financial Guarantee Business supported profit growth
FY3/2026 results showed an improvement in the quality of higher sales and higher profits compared with the previous fiscal year. Sales were 70.911 billion yen (up 11.3% YoY), operating profit was 8.869 billion yen (up 11.4%), and ordinary profit was 9.772 billion yen (up 16.1%). Net profit attributable to owners of parent was 5.920 billion yen (up 21.6%), with sales and profits at each level all reaching record highs. The Company explains that, in addition to the expansion of existing operations and the acquisition of new clients in major segments, contract price increases contributed. In particular, the fact that price revisions accompanying rising prices were concluded sequentially toward the second half was an important point to confirm from the previous report.
The increase in operating profit was not merely due to sales expansion. We would evaluate the Company’s ability to maintain an operating margin of 12.5% while absorbing wage increases associated with improved employee compensation and higher payment rates to partner companies in the Automotive Business. The gross margin declined by 0.4 percentage points, from 22.0% to 21.6%, indicating that the impact of higher costs persisted. However, the Company contained the increase in SG&A expenses and lifted operating profit through higher sales and price revisions. In addition, foreign exchange gains of 353 million yen and equity in affiliates’ earnings of 194 million yen also lifted ordinary profit.
Among the businesses, the growth of the Financial Guarantee Business stands out. Sales were 12.282 billion yen (up 16.2% YoY), and operating profit was 2.766 billion yen (up 18.4%), as the number of rent debt guarantee contracts increased by more than 10% and the number of medical institutions adopting medical expense guarantees also increased substantially. The Automotive Business expanded to sales of 29.930 billion yen (up 9.8%), but operating profit remained flat at 3.449 billion yen. Higher outsourcing expenses weighed on profit, but the business improved from the initial forecast of lower profit due to contract price increases. The way to overcome this is through continued contract price increases and improved dispatch-arrangement efficiency.
The issues are also clear. The IT Business recorded lower sales and lower profits due to the convergence of upfront sales and development investment, and the Social Business, although narrowing its loss, still posted an operating loss of 540 million yen. The impact on company-wide results is limited, but from an investor’s perspective, it is necessary to determine how much of the profits earned in the core businesses will be allocated to growth investments and when profitability improvement will be required. However, the establishment of the DX Promotion Headquarters in October 2025 and the acceleration of efficiency improvement using AI and other technologies can be evaluated as initiatives to compensate for the weaknesses of the labor-intensive model.
The latest results are positive, as contract price increases are now reflected in performance. However, the operating margin is flat, and for a share-price revaluation, we would like to confirm continued growth in the Financial Guarantee Business and a recovery in the profitability of the Automotive Business.
◇ Segment analysis: The scale-driven Automotive Business, high-margin Financial Guarantee Business, and growth-potential Global Business drive earnings
The Company’s earnings structure comprises a diversified portfolio, with the Automotive Business serving as the sales-scale pillar, the Financial Guarantee Business as the profit-growth pillar, and the Global Business and Property Business as secondary pillars. In FY3/2026, sales by business were 29.930 billion yen in the Automotive Business, 12.282 billion yen in the Financial Guarantee Business, 10.484 billion yen in the Global Business, 9.860 billion yen in the Property Business, 6.655 billion yen in the Customer Business, 897 million yen in the Social Business, and 800 million yen in the IT Business, accounting for 42.2%, 17.3%, 14.8%, 13.9%, 9.4%, 1.3%, and 1.1%, respectively, of consolidated sales of 70.911 billion yen. Operating profit was 3.449 billion yen in the Automotive Business, 2.766 billion yen in the Financial Guarantee Business, 1.263 billion yen in the Global Business, 1.037 billion yen in the Customer Business, 806 million yen in the Property Business, and 103 million yen in the IT Business, while the Social Business recorded an operating loss of 540 million yen.
The Automotive Business is the largest segment, providing roadside assistance, accident reception, field staff dispatch system operations, and other services to non-life insurance companies and automobile manufacturers. Sales increased 9.8% YoY, while operating profit was flat, as an increase in the number of contracts, acquisition of new clients, and contract price increase contributed to higher sales, but higher payments to partner companies restrained profitability. Therefore, this business will continue to drive sales growth and serve as an important indicator of progress in contract price increases and outsourcing cost management.
The Property Business handles repairs, on-site dispatch, and maintenance for owner-occupied and rental housing, detached houses, and coin-operated parking lots. Sales increased 14.0% YoY, and operating profit rose 10.4%, with the solid performance of Home Assist for rental housing supporting earnings.
The Global Business provides claims agent services for overseas travel insurance, medical support for expatriates, and other services, and sales increased 17.3% YoY, while operating profit rose 10.9%. Growth was driven by the acquisition of new customers for healthcare programs and an increase in membership through area expansion, and the operating platform around overseas medical care and insurance has room for growth.
The Financial Guarantee Business is a high-margin segment that provides rent debt, medical expense, and eldercare expense guarantees, centered on the subsidiary Entrust. Because the number of rent debt guarantee contracts increased by more than 10% and the number of medical institutions adopting medical expense guarantees also increased substantially, sales rose 16.2% YoY and operating profit increased 18.4%. The Customer Business handles credit card-related operations and other services. Although sales declined due to project selection, operating profit improved substantially, rising 30.1%, reflecting contract price increases and a review of existing operations. The IT Business recorded lower sales and lower profits due to the convergence of upfront sales and development investment, and the Social Business narrowed its loss due to increased sponsor income and a recovery in the childcare business. However, its contribution to company-wide profit remains limited. Overall, in evaluating the Company’s investment, the most important issues are the recovery of profitability in the Automotive Business, the maintenance of high growth in the Financial Guarantee Business, and expansion accompanied by profitability in the Global Business.
◇ FY3/2027 earnings forecast: The plan calls for higher sales and higher profits in FY3/2027 as well; the focus is on the ability to reach 10.0 billion yen in operating profit
The Company’s FY3/2027 plan calls for solid increases in sales and profits, and the growth trajectory is being maintained. However, net profit is planned to be flat, and for the share price to be valued higher over a short period, it will be necessary to confirm upside potential in operating profit and margin improvement. The Company plans sales of 76.0 billion yen (up 7.2% YoY), operating profit of 9.6 billion yen (up 8.2%), ordinary profit of 9.93 billion yen (up 1.6%), and net profit attributable to owners of parent of 5.92 billion yen (flat YoY). As the final year of the 8th Medium-Term Business Plan, the plan envisions a new record high in sales and the 14th consecutive fiscal year of operating profit growth.
The pillars of the plan are continued growth in assistance services and the expansion of the Financial Guarantee Business. The Automotive Business is expected to post sales of 31.53 billion yen and operating profit of 3.7 billion yen. Although procurement cost increases and labor cost increases accompanying rising prices will continue, the number of dispatch arrangements, the number of contracts, contract price increases, and the full-year contribution of operations for new clients will lift profit. The Financial Guarantee Business plans sales of 14.2 billion yen and an operating profit of 3.0 billion yen, with growth in rent debt guarantees and the expansion of guarantee services in the medical and eldercare fields serving as drivers.
Some heaviness remains in profit growth. The Global Business expects higher sales and higher profits, with sales of 11.0 billion yen and an operating profit of 1.35 billion yen. Still, profit growth will be moderate due to upfront investment, including strengthening the sales structure at overseas locations. The Social Business is also expected to expand sales, but an operating loss is expected to persist due to costs associated with strengthening the sports business’s structure. Company-wide, the Company intends to work on DX, including implementing AI functions in CTI and developing a next-generation common platform. The extent to which these measures can absorb rising labor costs will be the dividing line for margins.
In relation to the medium-term business plan, the Company’s FY3/2027 plan targets sales of 76.0 billion yen and an operating profit of 9.6 billion yen. On the sales side, it broadly meets the level targeted in the medium-term plan. On the profit side, however, there remains room to improve profitability toward an operating profit of 10.0 billion yen. That said, if contract price increases in the Automotive Business, high growth in the Financial Guarantee Business, and the effect of project selection in the Customer Business continue, room for improvement in the operating margin remains. Conversely, if wages increase, higher payment rates to partner companies, and the burden of DX investment expand more than expected, margin improvement may be delayed despite higher sales. Therefore, in looking at the FY3/2027 earnings forecast, we would like to emphasize the upside potential to operating profit of 9.6 billion yen and the pace of operating margin improvement rather than the likelihood of achieving sales.
FY3/2027 is a favorable plan in which higher sales and higher profits proceed in parallel with stronger shareholder returns. However, until the likelihood of achieving an operating profit of 10.0 billion yen, continued growth in the Financial Guarantee Business, and margin improvement through AI/DX can be confirmed, we expect share-price revaluation to proceed gradually.
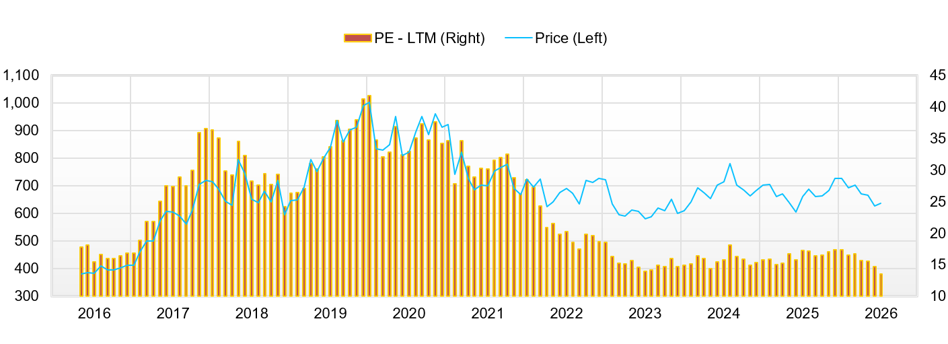
◇ Share-price trend and points to watch: The share price is in the lower range; revaluation requires confirmation of margin improvement and continued shareholder returns
The Company’s current share price does not adequately discount record-high performance and stronger shareholder returns, and the stock is awaiting a trigger for revaluation toward the lower end. From a closing price of 674 yen on February 2, 2026, the share price recovered to 698 yen on February 10, but subsequently moved in a range from the high-650 yen level to the low-700 yen level. Although it reached a high of 702 yen on April 15, the closing price on May 14 was 657 yen, down approximately 2.5% from its level in early February. On May 15, it temporarily fell to 646 yen, setting a year-to-date low. Technically, the low-700 yen level is seen as upside resistance, while around 650 yen is seen as downside support. Trading volume increased to 459,000 shares on May 13 and 646,500 shares on May 14, suggesting that supply and demand temporarily deteriorated around the earnings announcement.
In terms of valuation, the forward PER of 14.9x and actual PBR of 1.69x do not appear expensive given the Company’s stable cash-generating capability, net cash of approximately 21.9 billion yen, and ROIC of 12.4%. The Company’s planned dividend for FY3/2027 is 28 yen per share, and at a share price in the 650 yen range, the dividend yield is also in the 4% range. We believe the market appreciates the growth of the Financial Guarantee Business and the progress in contract price increases, but is cautious about the flat plan for net profit attributable to owners of parent at 5.92 billion yen in FY3/2027, higher labor costs, the burden of DX investment, and the delayed recovery in profitability in the Automotive Business.
The share-price reaction to announcements has generally been sluggish. The capital and business alliance with Tokio Marine & Nichido Fire Insurance Co., Ltd., announced on April 14, involved the transfer of 33.4% of the shares of Premier Aid Inc. to Tokio Marine & Nichido and the advancement of emergency call services, but the share price on April 14 was 690 yen, up only 0.88% from the previous day. The start of collaboration toward the social implementation of an emergency call service for motorcycles, linked to manned operators, by NAVITIME JAPAN, Tokyo Marine Smart Mobility, and Premier Aid on April 20 can also be evaluated in the medium term as service expansion in the mobility domain. Nevertheless, the share price on April 20 was 675 yen, down 1.75% from the previous business day. Both are positive from a business strategy perspective, but their short-term earnings contribution is difficult to discern, and their impact as share-price catalysts has been limited.
The FY3/2026 results, dividend increase, and reintroduction of the shareholder benefit program announced on May 13 also did not become catalysts that strongly pushed up the share price. The Company updated record-high performance, with sales of 70.911 billion yen, operating profit of 8.869 billion yen, ordinary profit of 9.772 billion yen, and net profit attributable to owners of parent of 5.920 billion yen, and also decided to reintroduce a shareholder benefit program with March 31, 2027 as the first record date. The closing price on May 14, the day after the announcement, was 657 yen, up only 0.15% from the previous day. We believe the market is waiting for margin improvement and a reacceleration in net profit growth in FY3/2027, rather than past results. The Company’s ranking of 43rd in “100 Best Companies Where Women Play Active Roles” on May 11 and its fifth consecutive certification as a Certified Health & Productivity Management Outstanding Organization 2026 on March 16 are positive in terms of human capital evaluation. However, they have not become catalysts that significantly move the share price.
The conditions for considering an overweight position going forward are clear. First, from Q1 FY3/2027 onward, the operating margin should improve to 12.5%, and contract price increases should be reflected in margins. Second, the Financial Guarantee Business should maintain double-digit growth and continue to function as a driver lifting company-wide profit. Third, in the Automotive Business, the Company should absorb higher outsourcing costs to towing-truck partner companies and recover its operating margin. Fourth, the utilization rate of the Akita BPO Katagami Campus, the effects of AI/DX investment, hiring and retention conditions, and the return policy, including share repurchases, should be presented quantitatively.
The share price is weak in the short term, but performance, financial position, and shareholder return stance have not broken down. If downside consolidation progresses around 650 yen and improvement in the operating margin and continued growth in the Financial Guarantee Business are confirmed, this will be a phase in which an increase in the holding ratio can be considered.
Company profile
◇ A stable earnings company spanning mobility, housing, overseas medical care, and guarantees, centered on 24-hour operations-based BPO
Prestige International Inc. is a TSE Prime-listed company with recurring earnings and cash-generating capabilities, centered on operations-based BPO that solves problems and is less susceptible to economic fluctuations. The Company was established on October 30, 1986, and has 5,270 consolidated employees. Its business includes BPO, as well as Automotive Business, Property Business, Global Business, Customer Business, Financial Guarantee Business, IT Business, and Social Business. The essence of its business model lies not in simply outsourcing call center operations, but in integrating contact centers, field dispatch arrangements, partner company networks, and IT business systems to operate client companies’ workflows continuously.
The Company’s strengths include talent integration, operational quality, business standardization, use of IT Business, and field networks that support 24/7/365 response. Because changing outsourcing providers involves transfer costs and the risk of quality deterioration, customer relationships tend to continue. If price revisions and the acquisition of higher-value-added projects progress, the structure can lead not only to higher sales but also to higher margins.
Key financial data
| Unit: million yen | 2022 | 2023 | 2024 | 2025 | 2026 | 2027 CE |
| Sales | 46,744 | 54,563 | 58,739 | 63,720 | 70,911 | 76,000 |
| EBIT (Operating Income) | 6,783 | 7,814 | 7,922 | 7,961 | 8,870 | |
| Pretax Income | 7,118 | 8,375 | 9,093 | 8,405 | 9,812 | |
| Net Profit Attributable to Owner of Parent | 4,357 | 5,319 | 5,791 | 4,870 | 5,920 | 5,920 |
| Cash & Short-Term Investments | 18,238 | 21,671 | 22,790 | 23,408 | 28,073 | |
| Total assets | 54,029 | 60,273 | 67,836 | 71,591 | 82,244 | |
| Total Debt | 1,373 | 469 | 381 | 321 | 6,166 | |
| Net Debt | -16,865 | -21,202 | -22,409 | -23,086 | -21,907 | |
| Total liabilities | 17,463 | 18,455 | 20,612 | 21,949 | 29,758 | |
| Total Shareholders’ Equity | 34,517 | 39,329 | 44,300 | 46,292 | 48,637 | |
| Net Operating Cash Flow | 6,610 | 7,888 | 5,884 | 7,841 | 10,467 | |
| Capital Expenditure | 3,905 | 2,458 | 3,140 | 3,444 | 6,362 | |
| Net Investing Cash Flow | -4,346 | -2,539 | -2,614 | -3,870 | -6,913 | |
| Net Financing Cash Flow | -764 | -2,250 | -2,377 | -3,197 | 776 | |
| Free Cash Flow | 2,706 | 5,430 | 2,744 | 4,397 | 4,105 | |
| ROA (%) | 8.65 | 9.31 | 9.04 | 6.99 | 7.70 | |
| ROE (%) | 13.29 | 14.40 | 13.85 | 10.75 | 12.47 | |
| EPS (Yen) | 34.0 | 41.6 | 45.3 | 38.3 | 47.0 | 47.5 |
| BPS (Yen) | 270.5 | 307.3 | 347.8 | 365.1 | 389.9 | |
| Dividend per Share (Yen) | 8.50 | 11.00 | 12.00 | 24.00 | 26.00 | 28.00 |
| Shares Outstanding (Million shares) | 128.19 | 128.45 | 128.68 | 128.68 | 127.18 |
Source: Calculated by Omega Investment based on FactSet’s standard criteria, rounded to the nearest whole number.
Share price
Key stock price data
Financial data (quarterly basis)
| Unit: million yen | 2024/3 | 2025/3 | 2026/3 | ||||||
| 4Q | 1Q | 2Q | 3Q | 4Q | 1Q | 2Q | 3Q | 4Q | |
| (Income Statement) | |||||||||
| Sales | 14,994 | 15,049 | 15,721 | 16,831 | 16,119 | 16,724 | 17,677 | 18,221 | 18,290 |
| Year-on-year | 6.3% | 8.1% | 5.9% | 12.3% | 7.5% | 11.1% | 12.4% | 8.3% | 13.5% |
| Cost of Goods Sold (COGS) | 11,404 | 11,836 | 12,277 | 12,988 | 12,581 | 13,257 | 13,798 | 14,135 | 14,405 |
| Gross Income | 3,590 | 3,213 | 3,444 | 3,843 | 3,538 | 3,467 | 3,879 | 4,086 | 3,885 |
| Gross Income Margin | 23.9% | 21.4% | 21.9% | 22.8% | 21.9% | 20.7% | 21.9% | 22.4% | 21.2% |
| SG&A Expense | 1,523 | 1,483 | 1,444 | 1,573 | 1,571 | 1,532 | 1,558 | 1,662 | 1,696 |
| EBIT (Operating Income) | 2,067 | 1,730 | 2,000 | 2,270 | 1,967 | 1,935 | 2,321 | 2,424 | 2,189 |
| Year-on-year | 14.8% | -8.5% | 1.6% | 13.7% | -4.8% | 11.9% | 16.1% | 6.8% | 11.3% |
| Operating Income Margin | 13.8% | 11.5% | 12.7% | 13.5% | 12.2% | 11.6% | 13.1% | 13.3% | 12.0% |
| EBITDA | 2,610 | 2,244 | 2,572 | 2,883 | 2,595 | 2,530 | 2,936 | 3,102 | 2,892 |
| Pretax Income | 2,864 | 1,663 | 2,283 | 2,454 | 2,006 | 2,015 | 2,669 | 2,735 | 2,394 |
| Consolidated Net Income | 2,096 | 917 | 1,617 | 1,591 | 1,390 | 1,192 | 1,860 | 1,713 | 1,944 |
| Minority Interest | 159 | 132 | 171 | 157 | 185 | 179 | 212 | 183 | 216 |
| Net Income ATOP | 1,937 | 786 | 1,446 | 1,434 | 1,205 | 1,013 | 1,649 | 1,530 | 1,728 |
| Year-on-year | 24.4% | -26.9% | 12.7% | -4.2% | -37.8% | 28.9% | 14.0% | 6.7% | 43.5% |
| Net Income Margin | 12.9% | 5.2% | 9.2% | 8.5% | 7.5% | 6.1% | 9.3% | 8.4% | 9.4% |
| (Balance Sheet) | |||||||||
| Cash & Short-Term Investments | 22,790 | 22,551 | 22,220 | 21,961 | 23,408 | 24,715 | 26,941 | 28,222 | 28,073 |
| Total assets | 67,836 | 69,365 | 69,254 | 70,794 | 71,591 | 75,493 | 77,896 | 82,027 | 82,244 |
| Total Debt | 381 | 250 | 188 | 188 | 321 | 4,686 | 4,561 | 8,868 | 6,166 |
| Net Debt | -22,409 | -22,301 | -22,033 | -21,774 | -23,086 | -20,030 | -22,379 | -19,354 | -21,907 |
| Total liabilities | 20,612 | 21,349 | 20,756 | 21,659 | 21,949 | 26,685 | 27,154 | 31,207 | 29,758 |
| Total Shareholders’ Equity | 44,300 | 45,057 | 45,372 | 45,972 | 46,292 | 45,433 | 47,146 | 47,197 | 48,637 |
| (Profitability %) | |||||||||
| ROA | 9.04 | 8.34 | 8.43 | 8.27 | 6.99 | 7.04 | 7.20 | 7.06 | 7.70 |
| ROE | 13.85 | 12.87 | 12.95 | 12.73 | 10.75 | 11.27 | 11.46 | 11.58 | 12.47 |
| (Per-share) Unit: JPY | |||||||||
| EPS | 15.2 | 6.2 | 11.3 | 11.3 | 9.5 | 8.0 | 13.0 | 12.2 | 13.8 |
| BPS | 347.8 | 353.7 | 355.8 | 362.0 | 365.1 | 358.9 | 373.7 | 376.4 | 389.9 |
| Dividend per Share | 6.00 | 0.00 | 12.00 | 0.00 | 12.00 | 0.00 | 13.00 | 0.00 | 13.00 |
| Shares Outstanding(million shares) | 128.68 | 128.68 | 128.68 | 128.68 | 128.68 | 127.18 | 127.18 | 127.18 | 127.18 |
Source: Calculated by Omega Investment based on FactSet’s standard criteria, rounded to the nearest whole number.
Financial data (full-year basis)
| Unit: million yen | 2017 | 2018 | 2019 | 2020 | 2021 | 2022 | 2023 | 2024 | 2025 | 2026 |
| (Income Statement) | ||||||||||
| Sales | 29,478 | 33,119 | 37,196 | 42,378 | 40,618 | 46,744 | 54,563 | 58,739 | 63,720 | 70,911 |
| Year-on-year | 7.9% | 12.4% | 12.3% | 13.9% | -4.2% | 15.1% | 16.7% | 7.7% | 8.5% | 11.3% |
| Cost of Goods Sold | 22,389 | 25,477 | 28,837 | 33,392 | 31,422 | 35,441 | 41,264 | 44,981 | 49,682 | 55,594 |
| Gross Income | 7,089 | 7,642 | 8,359 | 8,985 | 9,195 | 11,303 | 13,299 | 13,757 | 14,038 | 15,317 |
| Gross Income Margin | 24.0% | 23.1% | 22.5% | 21.2% | 22.6% | 24.2% | 24.4% | 23.4% | 22.0% | 21.6% |
| SG&A Expense | 3,321 | 3,412 | 3,672 | 4,052 | 3,962 | 4,461 | 5,471 | 5,836 | 6,076 | 6,447 |
| EBIT (Operating Income) | 3,755 | 4,226 | 4,678 | 4,934 | 5,185 | 6,783 | 7,814 | 7,922 | 7,961 | 8,870 |
| Year-on-year | 12.2% | 12.5% | 10.7% | 5.5% | 5.1% | 30.8% | 15.2% | 1.4% | 0.3% | 11.6% |
| Operating Income Margin | 12.7% | 12.8% | 12.6% | 11.6% | 12.8% | 14.5% | 14.3% | 13.5% | 12.5% | 12.5% |
| EBITDA | 4,724 | 5,194 | 5,674 | 6,041 | 6,340 | 8,307 | 9,627 | 9,926 | 10,274 | 11,460 |
| Pretax Income | 4,154 | 4,594 | 4,839 | 5,345 | 5,343 | 7,118 | 8,375 | 9,093 | 8,405 | 9,812 |
| Consolidated Net Income | 2,883 | 3,146 | 3,416 | 3,497 | 3,305 | 4,707 | 5,775 | 6,379 | 5,515 | 6,709 |
| Minority Interest | 94 | 209 | 231 | 304 | 337 | 350 | 457 | 587 | 645 | 789 |
| Net Income ATOP | 2,789 | 2,937 | 3,185 | 3,193 | 2,969 | 4,357 | 5,319 | 5,791 | 4,870 | 5,920 |
| Year-on-year | 4.5% | 5.3% | 8.5% | 0.2% | -7.0% | 46.8% | 22.1% | 8.9% | -15.9% | 21.6% |
| Net Income Margin | 9.5% | 8.9% | 8.6% | 7.5% | 7.3% | 9.3% | 9.7% | 9.9% | 7.6% | 8.3% |
| (Balance Sheet) | ||||||||||
| Cash & Short-Term Investments | 11,751 | 14,184 | 15,015 | 17,089 | 16,310 | 18,238 | 21,671 | 22,790 | 23,408 | 28,073 |
| Total assets | 30,186 | 34,131 | 39,024 | 42,892 | 46,756 | 54,029 | 60,273 | 67,836 | 71,591 | 82,244 |
| Total Debt | 605 | 358 | 1,160 | 916 | 567 | 1,373 | 469 | 381 | 321 | 6,166 |
| Net Debt | -11,146 | -13,827 | -13,856 | -16,173 | -15,744 | -16,865 | -21,202 | -22,409 | -23,086 | -21,907 |
| Total liabilities | 8,100 | 9,052 | 11,284 | 12,990 | 13,867 | 17,463 | 18,455 | 20,612 | 21,949 | 29,758 |
| Total Shareholders’ Equity | 21,240 | 23,945 | 26,430 | 28,363 | 31,072 | 34,517 | 39,329 | 44,300 | 46,292 | 48,637 |
| (Cash Flow) | ||||||||||
| Net Operating Cash Flow | 3,032 | 4,324 | 3,571 | 5,934 | 4,631 | 6,610 | 7,888 | 5,884 | 7,841 | 10,467 |
| Capital Expenditure | 1,159 | 702 | 2,423 | 2,927 | 3,568 | 3,905 | 2,458 | 3,140 | 3,444 | 6,362 |
| Net Investing Cash Flow | -852 | -1,817 | -2,744 | -2,797 | -4,137 | -4,346 | -2,539 | -2,614 | -3,870 | -6,913 |
| Net Financing Cash Flow | 1,042 | -166 | -79 | -1,267 | -1,357 | -764 | -2,250 | -2,377 | -3,197 | 776 |
| Free Cash Flow | 1,873 | 3,621 | 1,148 | 3,007 | 1,063 | 2,706 | 5,430 | 2,744 | 4,397 | 4,105 |
| (Profitability ) | ||||||||||
| ROA (%) | 9.93 | 9.13 | 8.71 | 7.80 | 6.62 | 8.65 | 9.31 | 9.04 | 6.99 | 7.70 |
| ROE (%) | 14.31 | 13.00 | 12.65 | 11.66 | 9.99 | 13.29 | 14.40 | 13.85 | 10.75 | 12.47 |
| Net Margin (%) | 9.46 | 8.87 | 8.56 | 7.54 | 7.31 | 9.32 | 9.75 | 9.86 | 7.64 | 8.35 |
| Asset Turn | 1.05 | 1.03 | 1.02 | 1.03 | 0.91 | 0.93 | 0.95 | 0.92 | 0.91 | 0.92 |
| Assets/Equity | 1.44 | 1.42 | 1.45 | 1.50 | 1.51 | 1.54 | 1.55 | 1.53 | 1.54 | 1.62 |
| (Per-share) Unit: JPY | ||||||||||
| EPS | 22.0 | 23.0 | 24.9 | 25.0 | 23.2 | 34.0 | 41.6 | 45.3 | 38.3 | 47.0 |
| BPS | 167.0 | 187.5 | 206.6 | 221.5 | 242.5 | 270.5 | 307.3 | 347.8 | 365.1 | 389.9 |
| Dividend per Share | 4.50 | 6.00 | 6.50 | 7.00 | 7.00 | 8.50 | 11.00 | 12.00 | 24.00 | 26.00 |
| Shares Outstanding(million shares) | 126.75 | 127.66 | 127.88 | 128.02 | 128.06 | 128.19 | 128.45 | 128.68 | 128.68 | 127.18 |
Source: Calculated by Omega Investment based on FactSet’s standard criteria, rounded to the nearest whole number.