2026-06-16
Home
Japanese

Omega Investment Co., Ltd.
Sansei Landic (Investment report – 1Q update)
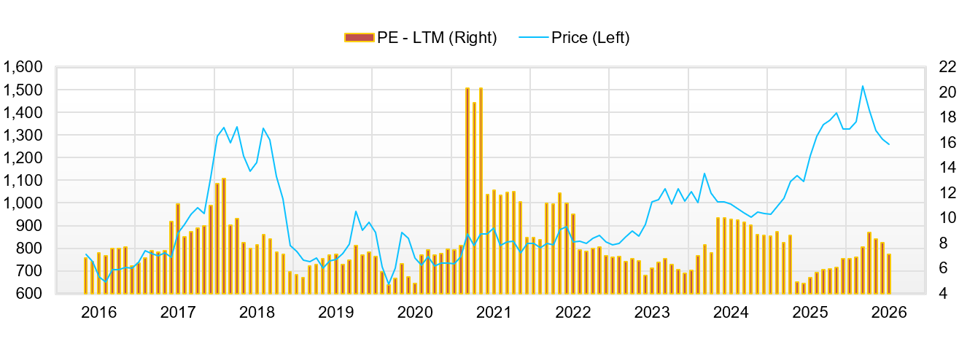
| Share price (6/15) | ¥1,258 | Dividend Yield (26/12 CE) | 4.1 % |
| 52weeks high/low | ¥1,084/1,555 | ROE(25/12 act) | 9.8 % |
| Avg Vol (3 month) | 8.1 thou shrs | Operating margin (25/12 act) | 9.6 % |
| Market Cap | ¥10.80 bn | Beta (5Y Monthly) | 0.25 |
| Enterprise Value | ¥31.01 bn | Shares Outstanding | 8.584 mn shrs |
| PER (26/12 CE) | 7.7 X | Listed market | TSE Standard |
| PBR (25/12 act) | 0.7 X |
| Click here for the PDF version of this page |
| PDF version |
Stable small-cap and low-beta characteristics are now being complemented by earnings progress and improved liquidity. With a recovery to a PBR of 1.0x in sight, the Company has entered a phase in which its valuation warrants a more bullish reassessment.
Investment conclusion
The first-quarter results for the fiscal year ending December 2026 demonstrated clear progress in at least one of the three areas emphasized in the previous report: profitability, inventory turnover, and operating cash flow. Net sales were 9,606 million yen, operating income was 2,040 million yen, ordinary income was 1,894 million yen, and quarterly net income attributable to owners of parent was 1,317 million yen. Operating income reached 85.0% of the Company’s full-year plan of 2,400 million yen in the first quarter alone. Although the Company left its full-year forecast unchanged, the current plan appears to reflect considerable conservatism based solely on the 1Q results.
From an investment perspective, we position the Company’s shares as having entered a phase in which their valuation warrants a more bullish reassessment, with a recovery to a PBR of 1.0x in sight. The current 1Q results provide grounds to reassess the Company’s equity valuation more positively than before, particularly with respect to earnings progress, execution capabilities in purchasing and sales activities, shareholder returns, and measures to improve liquidity. In the previous report, while positively evaluating progress in ROE improvement, we concluded that inventory turnover and improvement in operating cash flow were the key points for reassessing share-price valuation. In the current 1Q results, although confirmation of operating cash flow remains necessary, a stronger assessment can now be made regarding the sustainability of earnings and the accumulation of future earnings resources.
The first positive point is that the improvement in earnings quality confirmed in the fiscal year ended December 2025 continued into 1Q of the fiscal year ending December 2026. The gross profit margin for 1Q was 34.8%, up from 34.0% in 1Q of the previous fiscal year. The operating margin also reached 21.2%. Even considering that quarterly results are affected by deal composition, these results demonstrated that the Company’s rights-adjustment business continues to grow while generating gross profit. For the Company, whose corporate value is driven more directly by growth in gross profit and operating income than by growth in net sales itself, the current 1Q represented high-quality progress.
The second positive point is that both sales and purchases expanded. Sales performance in 1Q totaled 144 transactions and net sales of 9,606 million yen, consisting of 119 leasehold land transactions generating 5,969 million yen, 19 old unutilized properties transactions generating 3,102 million yen, and six freehold properties transactions generating 359 million yen. Purchase performance totaled 235 lots and 7,724 million yen, including 211 leasehold land lots totaling 4,414 million yen and 21 old unutilized properties lots totaling 3,227 million yen, both of which increased substantially. This demonstrates that a single exceptional, large-scale transaction did not drive 1Q earnings; rather, earnings were driven by balanced progress in both sales and purchases, centered on leasehold land and previously unused properties.
The third positive point is that the Company demonstrated its intention to strengthen its relationship with the capital markets by announcing a stock split and a dividend increase. The Company plans to conduct a two-for-one stock split effective July 1, 2026, to improve liquidity and expand its investor base by reducing the investment unit. In addition, the planned annual dividend for the fiscal year ending December 2026 is 51 yen per share, before accounting for the stock split, representing an increase from the previous fiscal year’s actual dividend of 46 yen per share. For the Company, a small-cap, low-liquidity stock, the stock split and dividend increase can be evaluated positively as practical measures that help correct its low PBR valuation.
On the other hand, several points still require confirmation before a reassessment can be completed. Real estate for sale increased from 32,346 million yen at the end of December 2025 to 33,805 million yen at the end of March 2026. Short-term borrowings, the current portion of long-term borrowings, and long-term borrowings also increased, indicating that the Company’s growth model, which relies on both inventory and borrowings, remains unchanged. Therefore, a full reassessment toward a PBR above 1.0x will require confirmation in future results that inventory is being converted into gross profit and operating cash flow.
Overall, the current 1Q results provided sufficient grounds to reassess the Company’s shares more positively than before. Earnings progress was exceptionally strong, purchases also expanded, and both a stock split and a dividend increase were announced. Although confirmation of improvement in operating cash flow remains necessary, we believe the Company has entered a phase in which its valuation warrants a more bullish reassessment toward a recovery to a PBR of 1.0x.
◇ FY12/2026 1Q results highlights: Progress against the full-year operating income plan reached 85%. The Company plan appears conservative.
For the first quarter of the fiscal year ending December 2026, net sales were 9,606 million yen, operating income was 2,040 million yen, ordinary income was 1,894 million yen, and quarterly net income attributable to owners of parent was 1,317 million yen. Compared with the same period of the previous fiscal year, net sales increased 8.6%, operating income increased 13.0%, ordinary income increased 9.6%, and quarterly net income increased 12.1%. The Company not only secured increases in net sales and profits in 1Q but also achieved high levels of gross and operating margins, resulting in favorable earnings on both deal composition and profitability.
The Company’s full-year plan remains unchanged at net sales of 25,500 million yen, operating income of 2,400 million yen, ordinary income of 1,900 million yen, and net income attributable to owners of parent of 1,330 million yen. Against this plan, the progress rate as of 1Q was 37.7% for net sales, 85.0% for operating income, 99.7% for ordinary income, and 99.0% for net income. Looking solely at earnings progress, the current plan contains substantial upside potential.
However, the Company’s quarterly results are heavily influenced by the timing of individual project sales and the composition of transactions. Therefore, it is not appropriate to simply annualize the 1Q earnings progress. The fact that the Company maintained its full-year plan unchanged also appears to indicate a cautious judgment that the strong 1Q progress is not yet at a stage where it should immediately be reflected in an upward revision to the full-year forecast.
The point investors should focus on is not simply that 1Q earnings were strong, but the quality of those earnings. The gross profit margin was a high 34.8%, demonstrating that the value added through rights adjustment is being realized as gross profit. The Company’s business model is not simple real estate trading. Rather, it purchases properties with complex rights relationships, carries out adjustment and consolidation, and then generates profits through sales. Therefore, gross profit margin, operating income, ROE, inventory turnover, and operating cash flow, rather than net sales, are the primary indicators for evaluating corporate value.
The earnings progress as of 1Q was exceptionally strong. On the other hand, whether the Company revises its full-year forecast upward will depend on sales progress from 2Q onward, maintenance of gross profit margins, inventory turnover, and improvement in operating cash flow. The current results provide sufficient grounds to strengthen the reassessment of the Company’s valuation; however, for that reassessment to be fully reflected in the share price, future earnings releases must demonstrate cash recovery.
◇ Segment analysis: Leasehold land is the core source of stable earnings, while old unutilized properties are a variable factor in profit growth. Expanded purchases are the source of future gross profit.
Although the Company’s disclosed business segment is a single segment, the Real Estate Sales Business, investors should analyze leasehold land, old unutilized properties, freehold properties, and other real estate sales separately. Leasehold land and old unutilized properties are the core drivers of corporate value, while freehold properties play a supplementary role. The Company omits segment information because it has only a single segment, the Real Estate Sales Business, which is considered immaterial. However, sales performance and purchase performance are disclosed separately for leasehold land, old unutilized properties, and freehold properties.
The leasehold land business constitutes the Company’s stable earnings base. In 1Q, leasehold land sales totaled 119 transactions and 5,969 million yen in net sales, representing a 41.7% increase in the number of transactions and a 3.8% increase in net sales compared with the same period of the previous fiscal year. While growth in net sales was modest relative to the increase in transaction volume, the increase in leasehold land transactions demonstrates that the Company’s capability to execute transactions and perform rights adjustments continues to function effectively. The key KPIs for the leasehold land business are the number of properties sold, net sales, the number of lots sold, and the number of lots purchased.
The old, unused properties business drives the Company’s profit growth. In 1Q, sales of old unutilized properties declined 26.9% YoY to 19 transactions, while net sales increased 12.8% to 3,102 million yen. The increase in net sales despite a decline in transaction volume suggests an increase in average transaction value or transaction size. Because old unutilized properties tend to have greater property-specific characteristics and relatively larger fluctuations in profit margins, they should be viewed not as a source of stable earnings but rather as a variable factor that can generate upside in earnings.
On the purchasing side, purchases totaled 211 leasehold land lots, amounting to 4,414 million yen, and 21 old, unutilized property lots, amounting to 3,227 million yen, representing substantial increases in both categories. In particular, purchases of old, unused properties increased by 497.7% YoY, indicating a larger pipeline of future sales opportunities. At the same time, expanded purchases represent not only a source of future gross profit but also a source of capital commitment and inventory turnover risk. Accordingly, the Company’s emphasis on expanded purchases should be evaluated from both perspectives: as a source of future earnings and as a potential risk to capital efficiency.
Freehold properties recorded six sales transactions and net sales of 359 million yen in 1Q, with both transaction volume and net sales increasing compared with the same period of the previous fiscal year. However, their scale remains small relative to leasehold land and old unutilized properties, and they are not a primary determinant of the Company’s corporate value. Freehold properties are a supplementary business monetized through rights adjustment. While they broaden the scope of the Company’s expertise, the principal KPIs for investment analysis remain sales, purchases, gross profit margin, and inventory turnover in leasehold land and old unutilized properties.
If the Company is viewed merely as a real estate sales company, attention may focus on fluctuations in net sales and increases in inventory. However, the essence of the Company is its real estate rights-adjustment business, which adjusts complex rights relationships and converts illiquid real estate into assets that can be sold. Therefore, what drives corporate value is not simply the number of transactions or net sales, but rather how much gross profit can be generated through rights adjustment and how quickly that profit can be converted into cash.
◇ Factors incorporated into the Company plan and upside/downside factors
The basic scenario incorporated into the Company plan assumes that real estate for sale accumulated through the end of the fiscal year ended December 2025 will be used to increase both net sales and profits in the fiscal year ending December 2026. The full-year forecast calls for net sales of 25,500 million yen, operating income of 2,400 million yen, ordinary income of 1,900 million yen, and net income attributable to owners of parent of 1,330 million yen. The Company has not revised this plan following the 1Q results.
Based on the 1Q results, the Company’s plan appears to be based on fairly conservative assumptions. With an operating income of 2,040 million yen already achieved in 1Q, the full-year plan of 2,400 million yen implies only 360 million yen of operating income for the remaining nine months. This gap suggests that the Company is factoring in lower gross profit margins from 2Q onward, concentration of sales timing, higher SG&A expenses, and conservative profit assumptions.
The first upside factor is maintaining gross profit margins. The 1Q gross profit margin of 34.8% was high. If the Company can maintain gross profit margins at around 30% from 2Q onward, full-year operating income is likely to exceed the Company’s plan. The second upside factor is progress in the sales of old, unutilized properties. Purchases of old unutilized properties increased substantially in 1Q, and if these are converted into sales as high-margin projects, they could become a source of earnings upside. The third upside factor is improved liquidity resulting from the stock split. If liquidity improves and participation by individual investors increases, the investment story of low PBR, high dividend yield, and stable ROE may become more fully reflected in the share price.
The first downside factor is slower inventory turnover. Real estate for sale increased to 33,805 million yen as of the end of March 2026, and if sales progress slows, concerns regarding capital efficiency could re-emerge. The second downside factor is the burden of higher interest expenses resulting from increased borrowings. Interest expense increased from 75 million yen in the same period of the previous fiscal year to 134 million yen in the current 1Q, which could put pressure on ordinary income amid rising interest rates. The third downside factor is a reaction to the exceptionally high profit margin recorded in 1Q. If gross profit margins decline significantly from 2Q onward due to changes in deal composition, the market may conclude that the strong 1Q performance was temporary.
Accordingly, the current assessment recognizes substantial upside potential relative to the Company’s plan while maintaining the need to confirm gross profit margins, sales progress, inventory turnover, and funding costs from 2Q onward. The current 1Q results indicate that the Company has entered a phase in which its valuation warrants a more bullish reassessment. However, whether that reassessment will be sustained must be confirmed through future earnings releases.
◇ Financial position and balance sheet: Inventory growth is a source of future growth, but confirmation of cash recovery is required for a valuation above 1.0x PBR
From a financial perspective, the price of real estate for sale continues to rise. Real estate for sale totaled 33,805 million yen as of the end of March 2026, up 1,459 million yen from 32,346 million yen at the end of December 2025. Total assets were 44,466 million yen, net assets were 14,645 million yen, and the equity ratio was 32.9%. Although the equity ratio declined slightly from 33.3% at the end of the previous fiscal year, net assets increased due to growth in retained earnings.
Viewed from an investor’s perspective, the Company is currently in a phase of building inventory to generate future earnings. An increase in inventory itself is not immediately negative, as it represents the source of future sales and profit recognition. Rather, given that both sales and purchases expanded in 1Q, the operating front line’s ability to secure projects is positive.
However, inventory growth must always be evaluated together with capital efficiency. Short-term borrowings increased from 15,031 million yen at the end of December 2025 to 16,340 million yen at the end of March 2026. Current portion of long-term borrowings increased from 6,111 million yen to 7,024 million yen, while long-term borrowings increased from 4,001 million yen to 4,386 million yen. Because the Company’s business model relies on borrowing to finance inventory accumulation, sales delays can easily heighten concerns about capital efficiency.
In the previous report, we noted that operating cash flow for the fiscal year ended December 2025 turned significantly negative, primarily due to an increase in real estate for sale, which contributed to the market’s cautious stance. In the current 1Q, real estate for sale increased further, indicating that confirmation of an improvement in operating cash flow has not yet been achieved. In addition, because quarterly financial summaries do not include a statement of cash flows for 1Q, meaningful confirmation of cash recovery must await disclosures beginning in 2Q.
Accordingly, while the current results support a strong positive assessment from an earnings perspective, a full reassessment toward a valuation above 1.0x PBR requires confirmation that inventory is being converted into both earnings and cash. For investors, the next figures to monitor are not only net sales and operating income. Rather, real estate for sale, inventory turnover, operating cash flow, interest expense, and the equity ratio should be assessed together.
◇ Shareholder returns and stock split: A positive step toward reducing the low-liquidity discount
Another noteworthy point in the current disclosure is the stock split and revision to the dividend forecast. The Company plans to conduct a stock split at a ratio of two shares for each share of common stock, with an effective date of July 1, 2026. The stated purpose is to create a more accessible investment environment by lowering the investment unit, thereby improving share liquidity and expanding the investor base.
A stock split does not directly increase earnings or net assets. However, for a small-cap, low-liquidity stock such as Sansei Landic, lowering the investment unit size may encourage broader participation by individual investors and increase trading volume. In the previous report, we highlighted the Company’s low beta, stable share price performance, and valuation gap, as reflected in its sub-1.0x PBR. The current stock split can therefore be viewed as a practical measure to reduce this low-liquidity discount.
About dividends, the Company plans to pay an interim dividend of 21 yen for the fiscal year ending December 2026 and a year-end dividend of 15 yen on a post-stock-split basis. Excluding the stock split, the planned annual dividend amounts to 51 yen. This represents an increase from the annual dividend of 46 yen paid for the fiscal year ended December 2025, indicating that earnings growth and enhanced shareholder returns are progressing in parallel. When PBR remains below 1.0x, dividend increases tend to serve as a support factor for the share price.
Looking at the ownership structure, stable shareholders such as the founding family, management, treasury shares, and the employee stock ownership plan account for a substantial portion of shares outstanding, while the free-float ratio remains limited. While this contributes to share-price stability, it may also constrain large-scale purchases by institutional investors and limit growth in trading volume. Accordingly, the stock split alone may not immediately lead to a significant increase in institutional investor participation. However, it could contribute positively to expanding the individual investor base, increasing trading volume, and improving continuity in share-price formation.
Going forward, if additional shareholder returns or clearer dividend policies are announced when earnings exceed expectations, market recognition of improvements in capital efficiency could increase further. The current 1Q results included a stock split, a dividend increase, improving ROE, and strong progress in operating income, providing multiple factors supporting a reassessment of the Company’s share valuation.
◇ Share-price trend and points of focus: The next focus is 2Q gross profit margin, inventory turnover, and operating cash flow
The current 1Q results provide grounds for a more positive reassessment of the Company’s shares. Operating income reached 85.0% of the full-year plan, while ordinary income and net income attributable to owners of parent nearly reached their respective full-year targets. In addition, the Company announced a stock split and a dividend increase, resulting in positive developments in both earnings and capital market initiatives.
However, confirmation from 2Q onward will be important before the share price can be re-rated more substantially. The first monitoring point is the extent to which cumulative operating income through 2Q exceeds the Company’s planned 2Q operating income of 2,250 million yen. Given that operating income already reached 2,040 million yen in 1Q, the likelihood of an upward revision to the full-year forecast will increase significantly unless operating performance deteriorates sharply in 2Q alone.
The second monitoring point is the trend in gross profit margin. It is important to determine whether the 34.8% gross profit margin recorded in 1Q was temporary or whether a level of around 30% can be maintained from 2Q onward. Maintenance of gross profit margins is the most direct indicator of whether the Company’s rights-adjustment capabilities are translating into profitability.
The third monitoring point is the balance and turnover of real estate for sale. Continued increases in real estate for sale alone will not eliminate concerns regarding capital efficiency. Progress in sales and the conversion of inventory into gross profit and operating cash flow are prerequisites for a recovery to a PBR of 1.0x.
The fourth monitoring point is borrowings and interest expenses. Interest expense increased YoY in 1Q, and, depending on future interest-rate conditions, it may put pressure on ordinary income. Even if operating income continues to progress strongly, investors should remain aware that rising financing costs could constrain growth in ordinary income.
The fifth monitoring point is trading volume and changes in the investor base following the stock split. If trading volume and individual investor participation expand after the split, the low-liquidity discount is expected to decline. Conversely, if trading volume remains largely unchanged, the impact of the stock split may prove limited.
At present, we believe the Company has entered a phase in which its valuation warrants a more bullish reassessment, with a recovery to a PBR of 1.0x in sight. The current 1Q results were positive across earnings progress, purchasing and sales activities, shareholder returns, and measures to improve liquidity. On the other hand, confirmation of the sustainability of this reassessment will require evidence of improvements in gross profit margins, inventory turnover, and operating cash flow from 2Q onward. Accordingly, we conclude that the Company has entered a phase in which its share valuation should be reassessed more positively than before.
Company profile
◇ Specialized real estate rights-adjustment business model. An independent player targeting high profitability in a niche market
Sansei Landic Co., Ltd. is a real estate company specializing in rights adjustment for leasehold land and old, unused properties, securing earnings opportunities in a niche market with limited competition. The Company operates a flow-based business model throughout Japan, purchasing real estate with complex rights relationships, carrying out adjustments and consolidation, and subsequently selling the properties to third parties. Its core businesses are the acquisition of leasehold land associated with land lease rights and old, unutilized properties consisting of land with existing buildings. A key characteristic of the Company is that its property investigation capabilities, negotiation expertise, and legal execution capabilities have been built at the organizational level rather than relying on individual employees. In August 2024, the Company announced a new Medium-term Management Plan covering the period through FY2027. The plan sets forth strengthening existing businesses, developing derivative businesses, improving capital efficiency, and enhancing shareholder returns. The target ROE range is 9%–12%, clearly demonstrating a transition toward management that is conscious of capital costs. In addition, the Company positions its Regional Revitalization Promotion Business as a pillar of its social-issue-resolution model. Through collaboration with local governments, the Company aims to simultaneously create regional vibrancy and earnings opportunities by revitalizing idle real estate and underutilized assets. During the period from 2025 to 2027, priority is being placed on building the business foundation, and initiatives are currently being advanced in Hachimantai City, Iwate Prefecture; Hirado City, Nagasaki Prefecture; and Higashiizu Town, Shizuoka Prefecture.
Key financial data
| Unit: million yen | 2021/12 | 2022/12 | 2023/12 | 2024/12 | 2025/12 | 2026/12 CE |
| Sales | 16,836 | 15,533 | 23,269 | 25,620 | 23,349 | 25,500 |
| EBIT (Operating Income) | 1,118 | 1,469 | 2,155 | 1,883 | 2,248 | 2,400 |
| Pretax Income | 1,004 | 1,270 | 1,756 | 1,585 | 1,852 | 1,900 |
| Net Profit Attributable to Owner of Parent | 609 | 1,060 | 1,183 | 1,051 | 1,295 | 1,330 |
| Cash & Short-Term Investments | 5,361 | 3,837 | 3,770 | 5,013 | 4,717 | |
| Total assets | 20,051 | 28,977 | 30,976 | 33,107 | 40,679 | |
| Total Debt | 8,108 | 16,399 | 16,879 | 18,506 | 25,145 | |
| Net Debt | 2,747 | 12,562 | 13,109 | 13,493 | 20,428 | |
| Total liabilities | 9,749 | 17,921 | 18,899 | 20,349 | 27,127 | |
| Total Shareholders’ Equity | 10,302 | 11,056 | 12,077 | 12,759 | 13,551 | |
| Net Operating Cash Flow | 1,705 | -9,268 | -12 | 1,143 | -5,969 | |
| Capital Expenditure | 40 | 28 | 304 | 138 | 217 | |
| Net Investing Cash Flow | -51 | -267 | -766 | -715 | -464 | |
| Net Financing Cash Flow | -608 | 7,971 | 303 | 1,223 | 6,094 | |
| Free Cash Flow | 1,682 | -9,282 | -291 | 1,049 | -6,177 | |
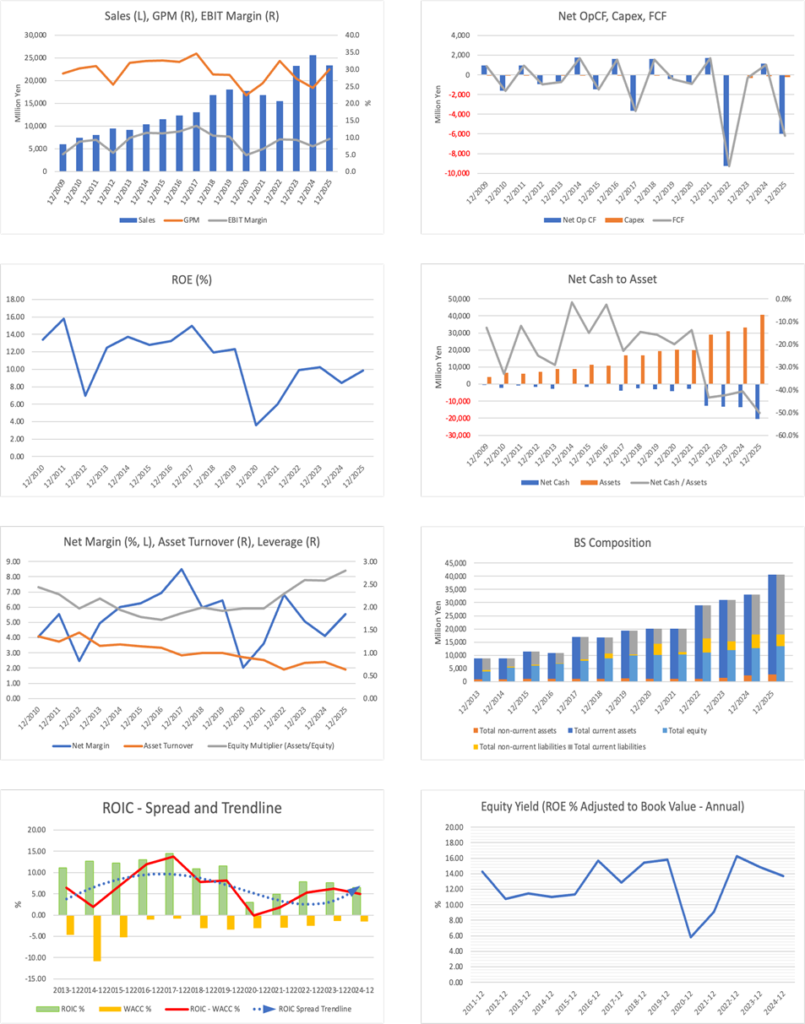
| ROA (%) | 3.04 | 4.32 | 3.95 | 3.28 | 3.51 | |
| ROE (%) | 5.98 | 9.93 | 10.23 | 8.46 | 9.84 | |
| EPS (Yen) | 73.6 | 129.6 | 143.8 | 127.2 | 158.9 | 163.5 |
| BPS (Yen) | 1,249.5 | 1,356.8 | 1,465.5 | 1,541.8 | 1,670.0 | |
| Dividend per Share (Yen) | 26.00 | 28.00 | 33.00 | 41.00 | 46.00 | 51.00 |
| Shares Outstanding (Million shares) | 8.47 | 8.49 | 8.58 | 8.58 | 8.58 |
Source: Omega Investment from company data, rounded to the nearest whole number.
Share price
Key stock price data
Financial data (quarterly basis)
| Unit: million yen | 2024/12 | 2025/12 | 2026/12 | ||||||
| 1Q | 2Q | 3Q | 4Q | 1Q | 2Q | 3Q | 4Q | 1Q | |
| (Income Statement) | |||||||||
| Sales | 7,207 | 5,785 | 8,358 | 4,270 | 8,848 | 5,664 | 5,202 | 3,634 | 9,607 |
| Year-on-year | 11.1% | 5.3% | 11.7% | 12.3% | 22.8% | -2.1% | -37.8% | -14.9% | 8.6% |
| Cost of Goods Sold (COGS) | 5,521 | 4,228 | 6,448 | 3,122 | 5,842 | 4,062 | 3,684 | 2,767 | 6,264 |
| Gross Income | 1,686 | 1,558 | 1,910 | 1,149 | 3,006 | 1,602 | 1,518 | 868 | 3,342 |
| Gross Income Margin | 23.4% | 26.9% | 22.9% | 26.9% | 34.0% | 28.3% | 29.2% | 23.9% | 34.8% |
| SG&A Expense | 1,115 | 1,102 | 1,125 | 1,077 | 1,200 | 1,168 | 1,108 | 1,271 | 1,302 |
| EBIT (Operating Income) | 571 | 455 | 785 | 72 | 1,806 | 434 | 410 | -403 | 2,041 |
| Year-on-year | -49.0% | -15.5% | 16.2% | -140.5% | 216.6% | -4.6% | -47.7% | -662.5% | 13.0% |
| Operating Income Margin | 7.9% | 7.9% | 9.4% | 1.7% | 20.4% | 7.7% | 7.9% | -11.1% | 21.2% |
| EBITDA | 587 | 476 | 806 | 92 | 1,827 | 460 | 442 | -372 | 2,071 |
| Pretax Income | 493 | 369 | 728 | -4 | 1,728 | 349 | 313 | -538 | 1,894 |
| Consolidated Net Income | 328 | 245 | 485 | -7 | 1,175 | 236 | 213 | -329 | 1,317 |
| Minority Interest | 0 | 0 | 0 | 0 | 0 | 0 | 0 | 0 | 0 |
| Net Income ATOP | 328 | 245 | 485 | -7 | 1,175 | 236 | 213 | -329 | 1,317 |
| Year-on-year | -52.0% | -4.0% | 25.2% | -94.9% | 258.2% | -4.0% | -56.1% | 4432.4% | 12.1% |
| Net Income Margin | 4.6% | 4.2% | 5.8% | -0.2% | 13.3% | 4.2% | 4.1% | -9.1% | 13.7% |
| (Balance Sheet) | |||||||||
| Cash & Short-Term Investments | 4,479 | 4,988 | 4,728 | 5,013 | 5,788 | 5,730 | 5,319 | 4,717 | 6,960 |
| Total assets | 30,487 | 30,561 | 29,940 | 33,107 | 31,353 | 32,250 | 35,709 | 40,680 | 44,466 |
| Total Debt | 16,787 | 16,211 | 15,595 | 18,506 | 15,747 | 16,379 | 20,002 | 25,145 | 27,752 |
| Net Debt | 12,308 | 11,223 | 10,867 | 13,493 | 9,959 | 10,649 | 14,683 | 20,428 | 20,792 |
| Total liabilities | 18,354 | 18,163 | 17,173 | 20,349 | 17,712 | 18,471 | 21,832 | 27,128 | 29,821 |
| Total Shareholders’ Equity | 12,133 | 12,398 | 12,768 | 12,759 | 13,641 | 13,779 | 13,877 | 13,551 | 14,645 |
| (Profitability %) | |||||||||
| ROA | 2.75 | 2.66 | 3.02 | 3.28 | 6.14 | 6.01 | 4.93 | 3.51 | 3.79 |
| ROE | 6.98 | 6.74 | 7.32 | 8.46 | 14.73 | 14.43 | 12.13 | 9.84 | 10.16 |
| (Per-share) Unit: JPY | |||||||||
| EPS | 39.8 | 29.7 | 58.6 | -0.9 | 142.4 | 29.1 | 26.2 | -40.5 | 162.3 |
| BPS | 1,472.3 | 1,501.2 | 1,542.9 | 1,541.8 | 1,665.9 | 1,701.6 | 1,709.9 | 1,670.0 | 1,804.8 |
| Dividend per Share | 0.00 | 16.00 | 0.00 | 25.00 | 0.00 | 17.00 | 0.00 | 29.00 | 0.00 |
| Shares Outstanding(million shares) | 8.58 | 8.58 | 8.58 | 8.58 | 8.58 | 8.58 | 8.58 | 8.58 | 8.58 |
Source: Omega Investment from company data, rounded to the nearest whole number.
Financial data (full-year basis)
| Unit: million yen | 2016/12 | 2017/12 | 2018/12 | 2019/12 | 2020/12 | 2021/12 | 2022/12 | 2023/12 | 2024/12 | 2025/12 |
| (Income Statement) | ||||||||||
| Sales | 12,300 | 13,099 | 16,833 | 18,020 | 17,775 | 16,836 | 15,533 | 23,269 | 25,620 | 23,349 |
| Year-on-year | 6.3% | 6.5% | 28.5% | 7.1% | -1.4% | -5.3% | -7.7% | 49.8% | 10.1% | -8.9% |
| Cost of Goods Sold | 8,344 | 8,566 | 12,028 | 12,902 | 13,788 | 12,468 | 10,486 | 16,927 | 19,318 | 16,355 |
| Gross Income | 3,957 | 4,532 | 4,805 | 5,119 | 3,986 | 4,368 | 5,047 | 6,342 | 6,302 | 6,994 |
| Gross Income Margin | 32.2% | 34.6% | 28.5% | 28.4% | 22.4% | 25.9% | 32.5% | 27.3% | 24.6% | 30.0% |
| SG&A Expense | 2,295 | 2,434 | 2,702 | 2,891 | 2,750 | 2,877 | 3,031 | 3,569 | 3,752 | 4,746 |
| EBIT (Operating Income) | 1,446 | 1,762 | 1,766 | 1,861 | 847 | 1,118 | 1,469 | 2,155 | 1,883 | 2,248 |
| Year-on-year | 11.2% | 21.9% | 0.2% | 5.4% | -54.5% | 31.9% | 31.5% | 46.7% | -12.6% | 19.4% |
| Operating Income Margin | 11.8% | 13.5% | 10.5% | 10.3% | 4.8% | 6.6% | 9.5% | 9.3% | 7.3% | 9.6% |
| EBITDA | 1,532 | 1,833 | 1,822 | 1,912 | 896 | 1,161 | 1,517 | 2,236 | 1,962 | 2,357 |
| Pretax Income | 1,329 | 1,672 | 1,539 | 1,759 | 712 | 1,004 | 1,270 | 1,756 | 1,585 | 1,852 |
| Consolidated Net Income | 854 | 1,111 | 1,007 | 1,159 | 358 | 609 | 1,060 | 1,183 | 1,051 | 1,295 |
| Minority Interest | 0 | 0 | 0 | 0 | 0 | 0 | 0 | 0 | 0 | 0 |
| Net Income ATOP | 854 | 1,111 | 1,007 | 1,159 | 358 | 609 | 1,060 | 1,183 | 1,051 | 1,295 |
| Year-on-year | 17.9% | 30.2% | -9.4% | 15.1% | -69.1% | 70.5% | 73.9% | 11.6% | -11.2% | 23.2% |
| Net Income Margin | 6.9% | 8.5% | 6.0% | 6.4% | 2.0% | 3.6% | 6.8% | 5.1% | 4.1% | 5.5% |
| (Balance Sheet) | ||||||||||
| Cash & Short-Term Investments | 2,435 | 3,558 | 3,594 | 4,134 | 4,330 | 5,361 | 3,837 | 3,770 | 5,013 | 4,717 |
| Total assets | 10,833 | 16,916 | 16,777 | 19,294 | 20,071 | 20,051 | 28,977 | 30,976 | 33,107 | 40,679 |
| Total Debt | 2,712 | 7,439 | 6,048 | 7,203 | 8,342 | 8,108 | 16,399 | 16,879 | 18,506 | 25,145 |
| Net Debt | 277 | 3,881 | 2,454 | 3,069 | 4,012 | 2,747 | 12,562 | 13,109 | 13,493 | 20,428 |
| Total liabilities | 3,977 | 8,909 | 7,869 | 9,399 | 10,004 | 9,749 | 17,921 | 18,899 | 20,349 | 27,127 |
| Total Shareholders’ Equity | 6,856 | 8,006 | 8,908 | 9,895 | 10,067 | 10,302 | 11,056 | 12,077 | 12,759 | 13,551 |
| (Cash Flow) | ||||||||||
| Net Operating Cash Flow | 1,611 | -3,666 | 1,617 | -420 | -917 | 1,705 | -9,268 | -12 | 1,143 | -5,969 |
| Capital Expenditure | 111 | 57 | 66 | 61 | 21 | 40 | 28 | 304 | 138 | 217 |
| Net Investing Cash Flow | -184 | 107 | -64 | -71 | -288 | -51 | -267 | -766 | -715 | -464 |
| Net Financing Cash Flow | -1,278 | 4,667 | -1,495 | 984 | 953 | -608 | 7,971 | 303 | 1,223 | 6,094 |
| Free Cash Flow | 1,536 | -3,692 | 1,572 | -446 | -923 | 1,682 | -9,282 | -291 | 1,049 | -6,177 |
| (Profitability ) | ||||||||||
| ROA (%) | 7.68 | 8.01 | 5.98 | 6.42 | 1.82 | 3.04 | 4.32 | 3.95 | 3.28 | 3.51 |
| ROE (%) | 13.24 | 14.96 | 11.90 | 12.32 | 3.58 | 5.98 | 9.93 | 10.23 | 8.46 | 9.84 |
| Net Margin (%) | 6.94 | 8.48 | 5.98 | 6.43 | 2.01 | 3.62 | 6.82 | 5.08 | 4.10 | 5.55 |
| Asset Turn | 1.11 | 0.94 | 1.00 | 1.00 | 0.90 | 0.84 | 0.63 | 0.78 | 0.80 | 0.63 |
| Assets/Equity | 1.72 | 1.87 | 1.99 | 1.92 | 1.97 | 1.97 | 2.30 | 2.59 | 2.58 | 2.80 |
| (Per-share) Unit: JPY | ||||||||||
| EPS | 104.9 | 134.4 | 119.6 | 137.1 | 42.3 | 73.6 | 129.6 | 143.8 | 127.2 | 158.9 |
| BPS | 841.3 | 958.0 | 1,054.5 | 1,170.2 | 1,192.9 | 1,249.5 | 1,356.8 | 1,465.5 | 1,541.8 | 1,670.0 |
| Dividend per Share | 12.00 | 18.00 | 21.00 | 23.00 | 25.00 | 26.00 | 28.00 | 33.00 | 41.00 | 46.00 |
| Shares Outstanding (million shares) | 8.15 | 8.35 | 8.45 | 8.46 | 8.47 | 8.47 | 8.49 | 8.58 | 8.58 | 8.58 |
Source: Omega Investment from company data, rounded to the nearest whole number.