2026-09-10
Home
Japanese

Omega Investment Co., Ltd.
Hamee (Company note – Q4 update)
| Share price (7/14) | ¥278 | Dividend Yield (27/4 CE) | 1.1 % |
| 52weeks high/low | ¥1,485/250 | ROE(26/4) | 6.1 % |
| Avg Vol (3 month) | 161 thou shrs | Operating margin (26/4) | 4.5 % |
| Market Cap | ¥4.5 bn | Beta (5Y Monthly) | 0.8 |
| Enterprise Value | ¥6.8 bn | Shares Outstanding | 16.3 mn shrs |
| PER (27/4 CE) | 19.4 X | Listed market | TSE Standard |
| PBR (26/4 act) | 0.6 X |
| Click here for the PDF version of this page |
| PDF version |
FY04/2026 saw lower sales and lower earnings, but finished above the revised forecast. A new medium-term management plan has begun.
◇ Full-year FY04/2026 results highlights: lower sales and lower earnings, although the impact of deconsolidation was also significant
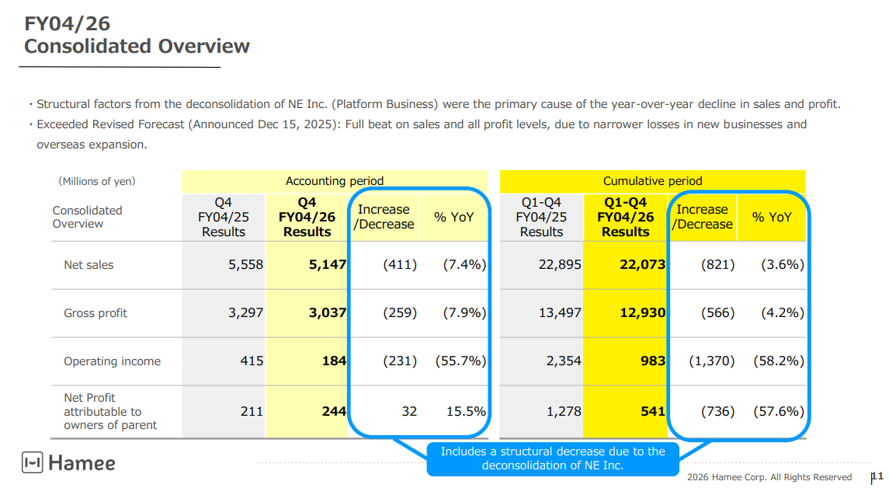
Hamee (hereinafter, the Company) announced its full-year FY04/2026 results on June 15, 2026, with lower sales and earnings YoY.
Overview of results: On a full-year consolidated basis, net sales were JPY22.07 billion (down 3.6% YoY), operating profit was JPY980 million (down 58.2% YoY), ordinary profit was JPY760 million (down 67.6% YoY), net income attributable to owners of parent was JPY540 million (down 57.6% YoY), basic earnings per share was JPY33.85, and dividend per share was JPY22.50.
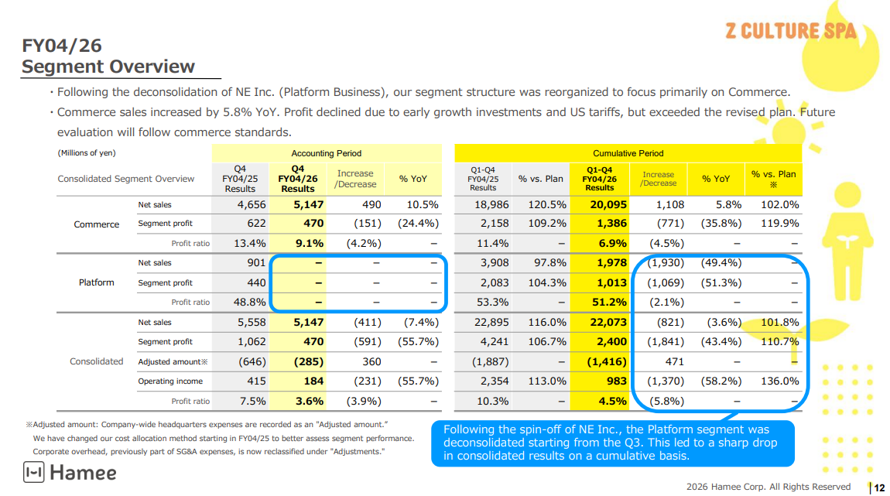
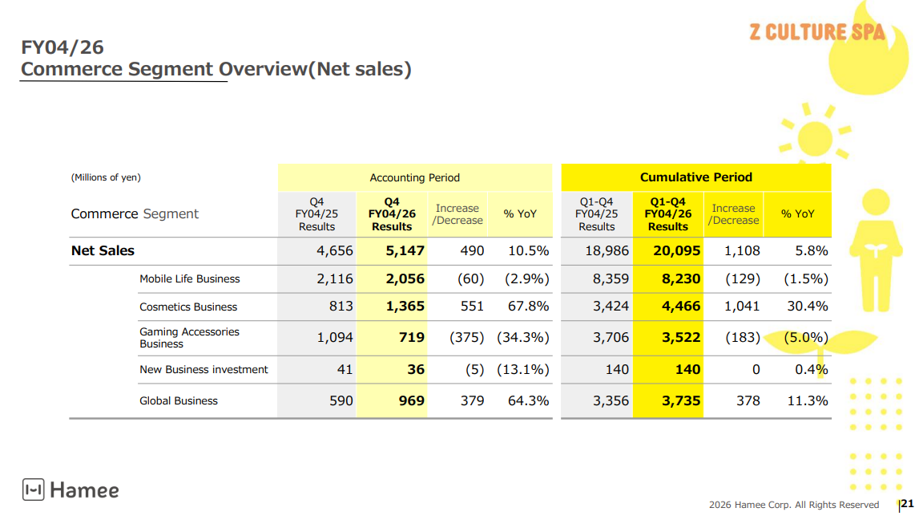
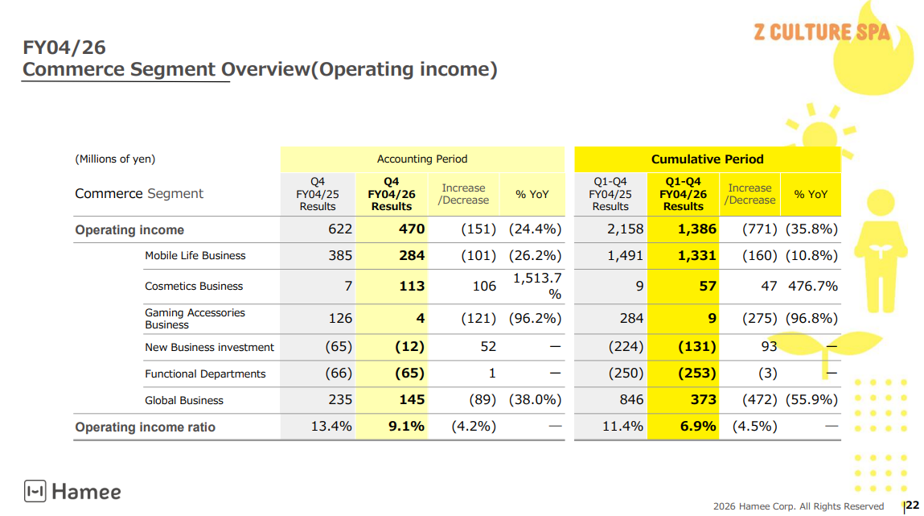
Considering the impact of the deconsolidation of the subsidiary (NE Inc.) at the end of the first half, it can be said that, in substance, results were higher sales and lower earnings. The Commerce Business, the continuing business, posted net sales of JPY20.10 billion (up 5.8% YoY), and segment profit of JPY1.39 billion (down 35.8% YoY). The Cosmetics Business and the Global Business drove net sales. However, in terms of operating profit, upfront expenses continued in the Cosmetics Business, and U.S. tariffs also had an impact. As a result, the Company was unable to offset the deterioration in earnings in the highly competitive Mobile Life Business and Gaming Accessories Business.
However, relative to the full-year forecast announced on December 15, 2025, net sales and all profit measures came in above forecast. This was the result of strong domestic sales in the Cosmetics Business, a decrease in inventory valuation losses, thorough cost management, a reduction in losses in new businesses, and profit contribution from overseas subsidiaries. It can be said that the actual situation is not as bad as it appears.
In the balance sheet, cash and deposits and shareholders’ equity declined due to the deconsolidation of NE Inc. The increase in inventories was limited.
Business-specific highlights: The Cosmetics Business achieved both continued high growth and the maintenance of profitability, but the other businesses, namely the Mobile Life Business, Gaming Accessories Business, and Global Business, were sluggish.
Mobile Life Business: Net sales of JPY8.23 billion (down 1.5% YoY) and business profit of JPY1.33 billion (down 10.8% YoY). EC sales were strong, but wholesale sales struggled. The Company promoted cross-selling of MagSafe-compatible smartphone cases and peripheral accessories. It continues to expand its product lineup, including electronic accessories and products that reflect fashion trends (such as BeBling), and aims to stabilize the business further.
Cosmetics Business (new name: Beauty Business): Net sales of JPY4.47 billion (up 30.4% YoY) and business profit of JPY60 million (up 476.7% YoY). Led by the cosmetics brand ByUR, the business entered the profitability phase. The reorganization of sales channels has been completed, and the expansion of stores carrying the products continues (8,000 stores). Although expenses were incurred upfront, net sales increased due to strong sales of base makeup products, and business profit remained positive for the second consecutive fiscal year. Progress was also made in launching skincare products, as well as inner-beauty supplement products under the ByGLOW brand. Benefits on the cost side from scale expansion are also expected.
Gaming Accessories Business: Net sales of JPY3.52 billion (down 5.0% YoY) and business profit of JPY10 million (down 96.8% YoY). The business is developed under the Pixio brand. Price competition intensified in gaming monitors, and the Company is strengthening the business base through the rollout of color variations for monitors, the expansion of peripheral accessories such as monitor arms and cables, and expansion into gaming desks and chairs that contribute to proposals for total space coordination.
Global Business: Net sales of JPY3.74 billion (up 11.3% YoY) and business profit of JPY370 million (down 55.9% YoY). Transactions with major U.S. mass retailers expanded through products such as the musical novelty item “Otamatone” and character IP collaboration products for “Squishies” (slow-rising toys). Overseas rollout of the Company’s own brands also progressed (including launching ByUR in the United States and Pixio in South Korea). Meanwhile, the decline in business profit was mainly due to consolidation adjustments related to intercompany transactions (elimination of unrealized profit), and the actual situation before such adjustments was at the same level as the previous year.
◇ A new medium-term management plan has been launched: aiming to set a new record high in business profit in FY04/2028
On June 15, 2026, the Company formulated its medium-term management plan (FY04/2027-FY04/2029). This is the first medium-term plan since the successful completion of NE Inc.’s spin-off IPO in November 2025 and the establishment of a structure focused on the Commerce Business.
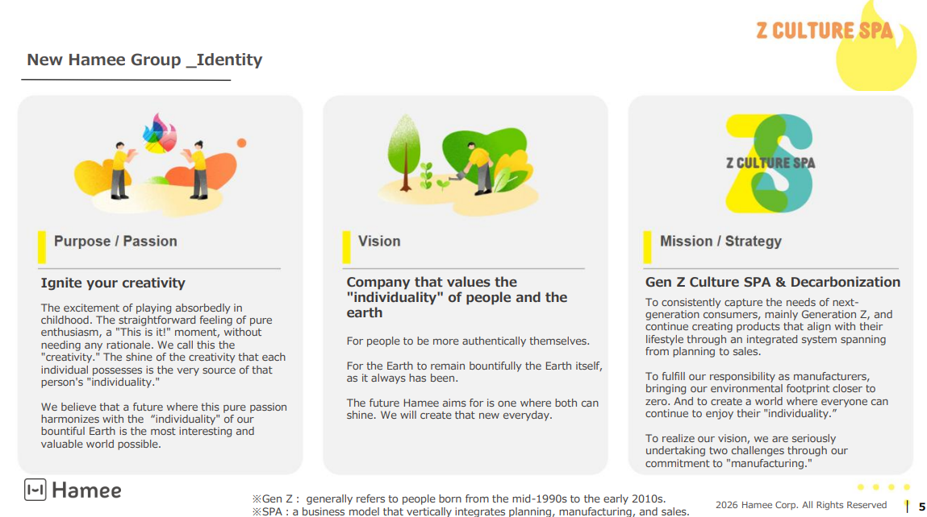
There has been no major change from the Company’s previous vision of what it aims to become. Based on the Purpose / Passion of “Ignite your creativity,” it sets out the Vision of being a “Company that values the ‘individuality’ of people and the earth.” It will promote “Gen Z Culture SPA & Decarbonization” as its Mission / Strategy.
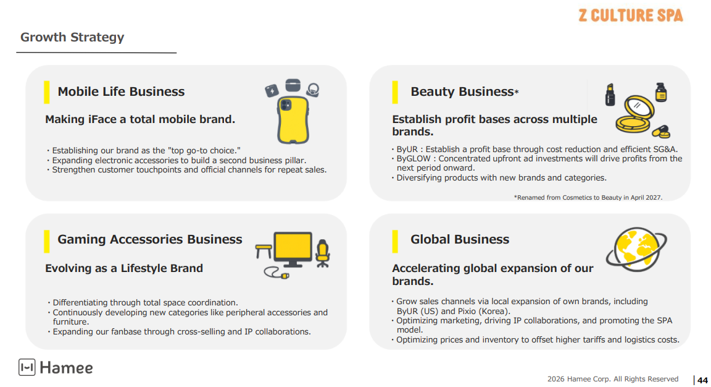
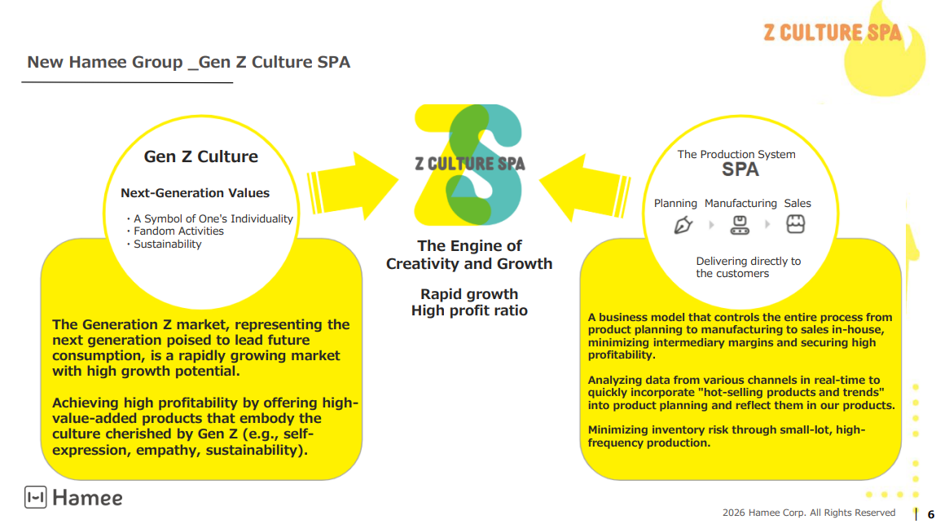
More specifically, concerning the business model of “planning -> manufacturing -> sales -> turning customers into fans -> repeat purchase,” which is the value creation model of the “Gen Z Culture SPA” type, the Company will further refine the model in each of the four businesses in which it has built its business base to date (the Mobile Life Business, Beauty Business, Gaming Accessories Business, and Global Business).
Numerical plan
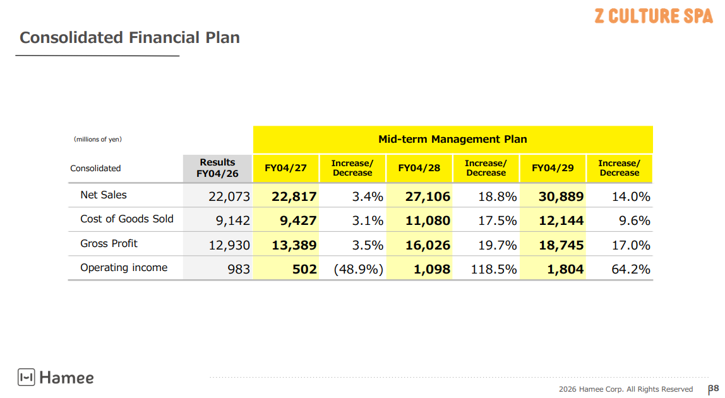
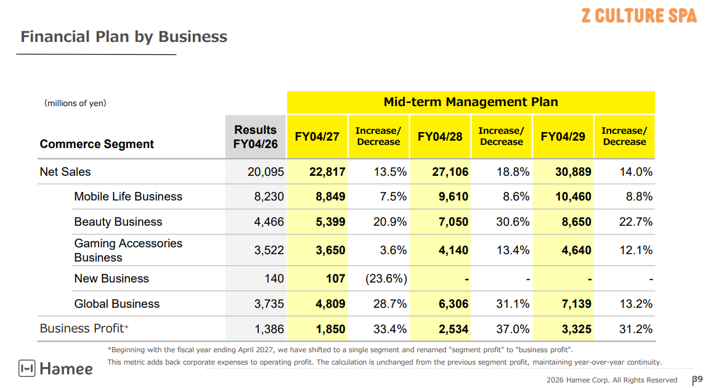
The numerical plan is as follows. Put simply, the plan is to surpass the Commerce Business’s previous peak business profit of JPY2.5 billion (FY04/2021) in FY04/2028 (the next fiscal year) and continue growing.
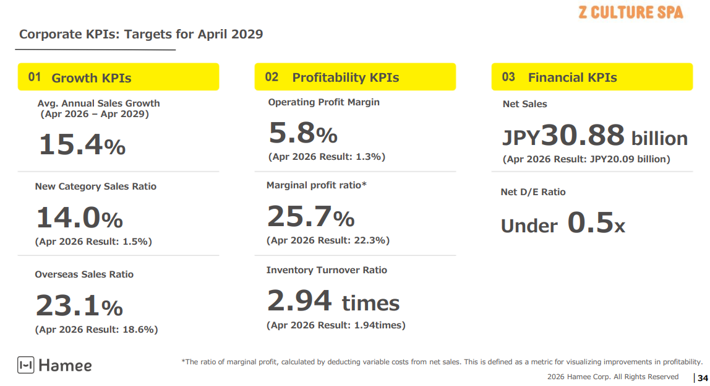
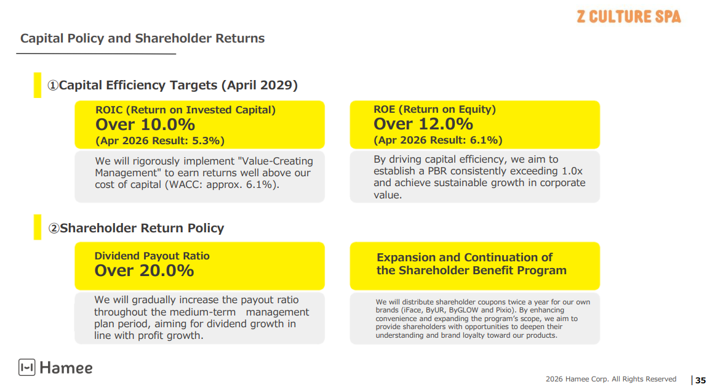
As target levels for FY04/2029, the Company has also presented ROIC of 10.0% or more, ROE of 12.0% or more (and achieving a PBR of 1.0x or higher), a net D/E ratio of 0.5x or less, and a dividend payout ratio of 20.0% or more.
Source: Company material
Source: Company material
Source: Company material
Source: Company material
◇ Full-year FY04/2027 outlook: the Company forecast is for higher sales and lower earnings, but in substance, the forecast is for higher sales and higher earnings
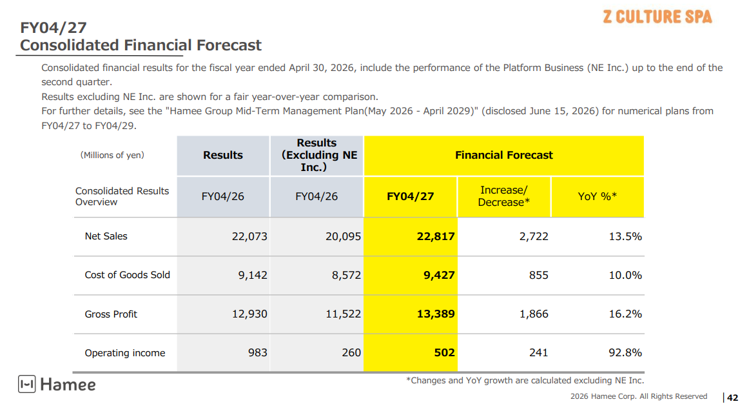
Consolidated earnings forecast: For the full year, net sales are projected at JPY22.82 billion (up 3.4% YoY), operating profit at JPY500 million (down 48.9% YoY), ordinary profit at JPY370 million (down 51.5% YoY), net income attributable to owners of parent at JPY230 million (down 57.4% YoY), basic earnings per share at JPY14.13, and dividend per share at JPY3.00.
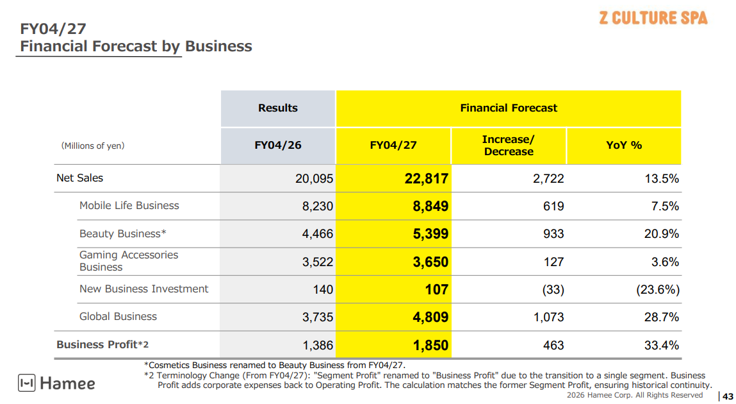
One factor behind the large rates of earnings decline is that the impact of NE Inc.’s spin-off remains for half of the fiscal year. Excluding this impact, net sales are forecast to increase 13.5%, business profit (JPY 1.85 billion) to increase 33.4%, and operating profit to increase 92.8%; therefore, the forecast is, in substance, for higher sales and higher earnings.
In addition, FY04/2027 is positioned as a period of preparation toward the “next growth phase,” and the Company plans to make proactive upfront investments.
Source: Company material
Source: Company material
Source: Company material
◇ Expansion of shareholder returns and the shareholder benefit program
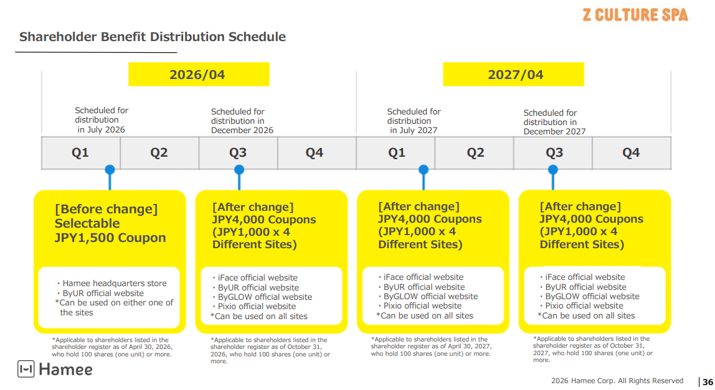
As mentioned earlier, the forecast dividend per share for FY04/2027 is JPY3.00 (dividend payout ratio of 21%). Based on the current share price, the dividend yield is slightly above 1%. Since the Company is in the process of strengthening its growth base, it appears unavoidable that the dividend payout ratio will remain low. However, to increase the number of shareholders who have a deep understanding of and attachment to the Company’s businesses, the shareholder benefit program will be expanded. Distribution of shareholder benefits twice a year is planned, and the details are as follows.
Source: Company material
◇ Share price trends and points of focus going forward
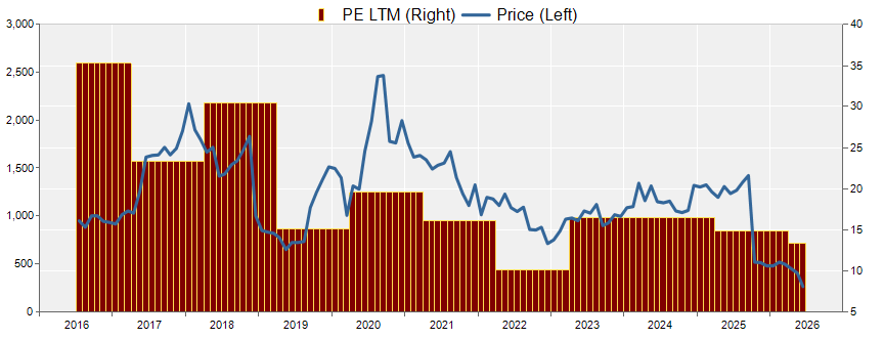
The Company’s share price had been declining gradually since October 2025. However, it fell sharply after the shares went ex-dividend and ex-rights for shareholder benefits on April 28, 2026, and then fell again from June 16, 2026, following this earnings announcement. As a result, the share price, which had been JPY519 at the end of October 2025, fell to JPY250 on June 24, 2026, and has only recently begun to recover.
This series of share price movements can be considered to have been due to the following factors:
- Because of the impact of the spin-off of NE Inc. as well, earnings trends in FY04/2026 and FY04/2027 appear weak
- In some of the Company’s business areas, the business environment has become more severe, and despite sluggish earnings growth, the need to strengthen growth investment has increased
- Among investors, the recognition spread that it would take more time before it could be confirmed whether the Company would realize the growth depicted in the medium-term management plan
However, more recently,
- As a result of the sharp fall in the share price, PBR declined to around 0.6x, easing downside concerns
- It was shown that, on a business profit basis for the Commerce Business, which is the continuing business, profit is expected to turn upward from FY04/2027
- The new medium-term management plan clearly showed that the Company aims to achieve growth and improve capital efficiency
- The shareholder benefit program was expanded to attract long-term shareholders who will remain aligned with the Company’s growth
These factors appear to have begun receiving positive evaluations.
In light of the above, we would like to focus on the following points going forward. We would like to identify the catalyst that will determine whether the share price will bottom out and turn upward.
- Whether FY04/2027 will progress, as per the Company forecast, with higher sales and higher earnings in substance. If the business environment does not improve, whether the Company can assess the effectiveness of its upfront investments and prioritize them appropriately. As a result, whether earnings will grow steadily
- In particular, how the Beauty Business’s marginal profit will improve. Whether it will become a second earnings pillar following the Mobile Life Business
- Whether a new record high in business profit will come into view
- Whether the number of users and shareholders who become fans of the Company’s businesses will increase, leading to stable growth in earnings and the share price
Overview of full-year FY04/2026 results
Overview of company-wide performance
Source: Company material
Source: Company material
Overview of the Commerce Segment
Source: Company material
Source: Company material
Hamee Group strategy
Source: Company material
Source: Company material
Company profile
◇Hamee Corp. (hereinafter, the Company) was founded in 1997, listed its shares on the TSE Mothers in 2015, and is currently listed on the TSE Standard Market. It had operated the following two segments through separate companies: the “Commerce Segment,” which develops businesses such as the Mobile Life Business (mobile accessories, etc.), the Beauty Business (cosmetics), the Gaming Accessories Business (gaming monitors, etc.), and the Global Business; and the “Platform Segment,” whose primary business is to provide EC Attractions”Next Engine,” a cloud (SaaS)-based service that automates tasks related to operating online shops for e-commerce operators and centrally manages order processing and inventory status for multiple stores across online marketplaces.
On November 4, 2025, NE Inc., which was responsible for the Platform Segment, was listed. The Company specializes in the Commerce Segment and is promoting the “deepening of Gen Z Culture SPA” and “contribution to a decarbonized society.” In June 2026, it formulated a new medium-term management plan, and the results from that plan are expected.
Key financial data
| Unit: million yen | 2022/4 | 2023/4 | 2024/4 | 2025/4 | 2026/4 | 2027/4 CE |
| Sales | 13,413 | 14,038 | 17,612 | 22,895 | 22,074 | 22,817 |
| EBIT (Operating Income) | 2,202 | 1,251 | 1,964 | 2,346 | 900 | |
| Pretax Income | 2,463 | 1,396 | 2,009 | 1,991 | 733 | |
| Net Profit Attributable to Owner of Parent | 1,744 | 945 | 1,122 | 1,278 | 541 | 230 |
| Cash & Short-Term Investments | 4,026 | 3,536 | 4,022 | 4,994 | 1,812 | |
| Total assets | 10,524 | 12,392 | 14,885 | 17,303 | 13,574 | |
| Total Debt | 544 | 1,300 | 2,327 | 4,076 | 4,100 | |
| Net Debt | -3,482 | -2,236 | -1,694 | -918 | 2,288 | |
| Total liabilities | 2,271 | 3,431 | 4,728 | 6,733 | 6,255 | |
| Total Shareholders’ Equity | 8,253 | 8,961 | 10,157 | 10,570 | 7,320 | |
| Net Operating Cash Flow | 1,186 | 695 | 886 | 827 | -108 | |
| Capital Expenditure | 1,018 | 487 | 477 | 783 | 422 | |
| Net Investing Cash Flow | -886 | -1,507 | -877 | -922 | -479 | |
| Net Financing Cash Flow | 298 | 263 | 380 | 1,171 | 108 | |
| Free Cash Flow | 362 | 405 | 577 | 225 | -411 | |
| ROA (%) | 18.49 | 8.25 | 8.22 | 7.94 | 3.51 | |
| ROE (%) | 23.60 | 10.98 | 11.73 | 12.33 | 6.05 | |
| EPS (Yen) | 109.7 | 59.4 | 70.4 | 80.2 | 33.9 | 14.4 |
| BPS (Yen) | 519.1 | 563.0 | 637.6 | 662.6 | 457.5 | |
| Dividend per Share (Yen) | 22.50 | 22.50 | 22.50 | 22.50 | 22.50 | 3.00 |
| Shares Outstanding (Million shares) | 16.27 | 16.27 | 16.28 | 16.29 | 16.33 |
Source: Calculated by Omega Investment based on FactSet’s standard criteria, rounded to the nearest whole number.
Share price
Financial data (quarterly basis)
| Unit: million yen | 2024/4 | 2025/4 | 2026/4 | ||||||
| Q4 | Q1 | Q2 | Q3 | Q4 | Q1 | Q2 | Q3 | Q4 | |
| (Income Statement) | |||||||||
| Sales | 4,829 | 4,579 | 6,099 | 6,659 | 5,559 | 5,290 | 5,942 | 5,694 | 5,147 |
| Year-on-year | 38.1% | 38.1% | 41.3% | 29.3% | 15.1% | 15.5% | -2.6% | -14.5% | -7.4% |
| Cost of Goods Sold (COGS) | 1,977 | 1,841 | 2,628 | 2,668 | 2,261 | 2,275 | 2,315 | 2,443 | 2,110 |
| Gross Income | 2,852 | 2,738 | 3,471 | 3,991 | 3,297 | 3,016 | 3,627 | 3,251 | 3,038 |
| Gross Income Margin | 59.1% | 59.8% | 56.9% | 59.9% | 59.3% | 57.0% | 61.0% | 57.1% | 59.0% |
| SG&A Expense | 2,306 | 2,505 | 2,691 | 3,074 | 2,882 | 2,845 | 3,092 | 3,157 | 2,853 |
| EBIT | 551 | 233 | 780 | 917 | 416 | 171 | 534 | 94 | 184 |
| Year-on-year | 545.8% | 24.7% | 65.9% | 21.3% | -24.6% | -26.5% | -31.5% | -89.7% | -55.7% |
| Operating Income Margin | 11.4% | 5.1% | 12.8% | 13.8% | 7.5% | 3.2% | 9.0% | 1.7% | 3.6% |
| EBITDA | 749 | 435 | 941 | 1,163 | 623 | 376 | 765 | 279 | 370 |
| Pretax Income | 576 | 200 | 811 | 702 | 278 | 97 | 422 | 28 | 187 |
| Consolidated Net Income | 428 | 101 | 564 | 400 | 212 | 26 | 274 | -4 | 245 |
| Minority Interest | 0 | 0 | 0 | 0 | 0 | 0 | 0 | 0 | 0 |
| Net Income ATOP | 428 | 101 | 564 | 400 | 212 | 26 | 274 | -4 | 245 |
| Year-on-year | 228.4% | -176.6% | 68.8% | -18.6% | -50.5% | -74.6% | -51.4% | -100.9% | 15.5% |
| Net Income Margin | 8.9% | 2.2% | 9.3% | 6.0% | 3.8% | 0.5% | 4.6% | -0.1% | 4.8% |
| (Balance Sheet) | |||||||||
| Cash & Short-Term Investments | 4,022 | 3,642 | 3,912 | 4,204 | 4,994 | 4,172 | 5,317 | 2,329 | 1,812 |
| Total assets | 14,885 | 15,295 | 16,838 | 18,197 | 17,303 | 16,416 | 19,556 | 14,139 | 13,574 |
| Total Debt | 2,327 | 3,232 | 3,980 | 3,927 | 4,076 | 3,850 | 5,150 | 4,500 | 4,100 |
| Net Debt | -1,694 | -410 | 68 | -277 | -918 | -322 | -167 | 2,171 | 2,288 |
| Total liabilities | 4,728 | 5,242 | 6,490 | 7,553 | 6,733 | 5,980 | 8,449 | 6,931 | 6,255 |
| Total Shareholders’ Equity | 10,157 | 10,053 | 10,348 | 10,644 | 10,570 | 10,437 | 11,107 | 7,209 | 7,320 |
| (Profitability %) | |||||||||
| ROA | 8.22 | 9.81 | 10.56 | 9.22 | 7.94 | 7.58 | 5.01 | 3.14 | 3.51 |
| ROE | 11.73 | 14.43 | 16.26 | 14.73 | 12.33 | 11.74 | 8.50 | 5.69 | 6.05 |
| (Per-share) Unit: JPY | |||||||||
| EPS | 26.9 | 6.4 | 35.4 | 25.1 | 13.3 | 1.6 | 17.1 | -0.2 | 15.3 |
| BPS | 637.6 | 630.7 | 648.8 | 667.4 | 662.6 | 653.1 | 694.2 | 450.5 | 457.5 |
| Dividend per Share | 22.50 | 0.00 | 0.00 | 0.00 | 22.50 | 0.00 | 0.00 | 0.00 | 22.50 |
| Shares Outstanding(million shares) | 16.28 | 16.29 | 16.29 | 16.29 | 16.30 | 16.30 | 16.33 | 16.33 | 16.33 |
Source: Calculated by Omega Investment based on FactSet’s standard criteria, rounded to the nearest whole number.
Financial data (full-year basis)
| Unit: million yen | 2017 | 2018 | 2019 | 2020 | 2021 | 2022 | 2023 | 2024 | 2025 | 2026 |
| (Income Statement) | ||||||||||
| Sales | 8,503 | 9,379 | 10,300 | 11,325 | 12,363 | 13,413 | 14,038 | 17,612 | 22,895 | 22,074 |
| Year-on-year | 30.8% | 10.3% | 9.8% | 10.0% | 9.2% | 8.5% | 4.7% | 25.5% | 30.0% | -3.6% |
| Cost of Goods Sold | 4,485 | 4,618 | 5,056 | 4,894 | 4,802 | 4,892 | 5,563 | 6,745 | 9,398 | 9,143 |
| Gross Income | 4,018 | 4,761 | 5,244 | 6,431 | 7,562 | 8,522 | 8,476 | 10,867 | 13,497 | 12,931 |
| Gross Income Margin | 47.3% | 50.8% | 50.9% | 56.8% | 61.2% | 63.5% | 60.4% | 61.7% | 59.0% | 58.6% |
| SG&A Expense | 2,916 | 3,381 | 4,080 | 4,686 | 5,382 | 6,319 | 7,225 | 8,959 | 11,151 | 12,031 |
| EBIT (Operating Income) | 1,102 | 1,380 | 1,164 | 1,745 | 2,180 | 2,202 | 1,251 | 1,964 | 2,346 | 900 |
| Year-on-year | 146.8% | 25.2% | -15.7% | 50.0% | 24.9% | 1.0% | -43.2% | 57.0% | 19.5% | -61.6% |
| Operating Income Margin | 13.0% | 14.7% | 11.3% | 15.4% | 17.6% | 16.4% | 8.9% | 11.1% | 10.2% | 4.1% |
| EBITDA | 1,272 | 1,627 | 1,525 | 2,227 | 2,694 | 2,840 | 2,042 | 2,749 | 3,162 | 1,707 |
| Pretax Income | 1,010 | 1,259 | 1,179 | 1,582 | 2,144 | 2,463 | 1,396 | 2,009 | 1,991 | 733 |
| Consolidated Net Income | 696 | 873 | 821 | 1,069 | 1,556 | 1,744 | 945 | 1,122 | 1,278 | 541 |
| Minority Interest | 0 | 0 | 0 | 0 | 0 | 0 | 0 | 0 | 0 | 0 |
| Net Income ATOP | 696 | 873 | 821 | 1,069 | 1,556 | 1,744 | 945 | 1,122 | 1,278 | 541 |
| Year-on-year | 169.7% | 25.4% | -5.9% | 30.2% | 45.5% | 12.0% | -45.8% | 18.6% | 13.9% | -57.6% |
| Net Income Margin | 8.2% | 9.3% | 8.0% | 9.4% | 12.6% | 13.0% | 6.7% | 6.4% | 5.6% | 2.5% |
| (Balance Sheet) | ||||||||||
| Cash & Short-Term Investments | 1,324 | 1,695 | 1,660 | 3,453 | 3,355 | 4,026 | 3,536 | 4,022 | 4,994 | 1,812 |
| Total assets | 4,240 | 5,042 | 5,761 | 8,097 | 8,342 | 10,524 | 12,392 | 14,885 | 17,303 | 13,574 |
| Total Debt | 468 | 298 | 500 | 1,740 | 104 | 544 | 1,300 | 2,327 | 4,076 | 4,100 |
| Net Debt | -856 | -1,397 | -1,160 | -1,713 | -3,251 | -3,482 | -2,236 | -1,694 | -918 | 2,288 |
| Total liabilities | 1,484 | 1,445 | 1,572 | 3,272 | 1,814 | 2,271 | 3,431 | 4,728 | 6,733 | 6,255 |
| Total Shareholders’ Equity | 2,756 | 3,597 | 4,189 | 4,824 | 6,528 | 8,253 | 8,961 | 10,157 | 10,570 | 7,320 |
| (Cash Flow) | ||||||||||
| Net Operating Cash Flow | 576 | 1,246 | 651 | 1,934 | 1,941 | 1,186 | 695 | 886 | 827 | -108 |
| Capital Expenditure | 228 | 437 | 291 | 649 | 351 | 1,018 | 487 | 477 | 783 | 422 |
| Net Investing Cash Flow | -433 | -674 | -671 | -1,020 | -412 | -886 | -1,507 | -877 | -922 | -479 |
| Net Financing Cash Flow | 69 | -230 | -7 | 933 | -1,736 | 298 | 263 | 380 | 1,171 | 108 |
| Free Cash Flow | 464 | 960 | 526 | 1,440 | 1,760 | 362 | 405 | 577 | 225 | -411 |
| (Profitability ) | ||||||||||
| ROA (%) | 19.18 | 18.81 | 15.21 | 15.43 | 18.94 | 18.49 | 8.25 | 8.22 | 7.94 | 3.51 |
| ROE (%) | 29.30 | 27.48 | 21.10 | 23.73 | 27.42 | 23.60 | 10.98 | 11.73 | 12.33 | 6.05 |
| Net Margin (%) | 8.18 | 9.31 | 7.97 | 9.44 | 12.59 | 13.00 | 6.73 | 6.37 | 5.58 | 2.45 |
| Asset Turn | 2.34 | 2.02 | 1.91 | 1.63 | 1.50 | 1.42 | 1.23 | 1.29 | 1.42 | 1.43 |
| Assets/Equity | 1.53 | 1.46 | 1.39 | 1.54 | 1.45 | 1.28 | 1.33 | 1.43 | 1.55 | 1.73 |
| (Per-share) Unit: JPY | ||||||||||
| EPS | 44.2 | 54.7 | 51.2 | 67.4 | 98.4 | 109.7 | 59.4 | 70.4 | 80.2 | 33.9 |
| BPS | 174.0 | 224.1 | 263.0 | 305.5 | 411.1 | 519.1 | 563.0 | 637.6 | 662.6 | 457.5 |
| Dividend per Share | 4.50 | 5.50 | 6.50 | 7.00 | 10.00 | 22.50 | 22.50 | 22.50 | 22.50 | 22.50 |
| Shares Outstanding (million shares) | 15.74 | 15.94 | 16.08 | 16.10 | 16.21 | 16.27 | 16.27 | 16.28 | 16.29 | 16.33 |
Source: Calculated by Omega Investment based on FactSet’s standard criteria, rounded to the nearest whole number.