2026-11-18
Home
Japanese

Omega Investment Co., Ltd.
Sansei Landic (First read : 3277)
Old unutilized property sales drive earnings; inventory turnover and interest costs come next
| Share price ¥781 (Nov. 13 close) | Forecast EPS ¥134.62 | Actual BPS ¥933.91 (Sep. 30) | Forecast dividend ¥37.50 |
| Simplified ROE 14.4% | Forecast P/E 5.8x | P/B 0.84x |
| Click here for the PDF version of this page |
| PDF version |
First Read | Assessing Earnings Growth
We favor maintaining our bullish medium- to long-term investment view. Operating income for the first nine months reached ¥3.340 billion, or 90.8% of the full-year Company forecast of ¥3.680 billion. Strong growth in old unutilized property sales, alongside steady leasehold land sales, has translated into higher earnings. Whether that growth can be sustained depends not only on profitability by property but also on the holding period from purchase to exit and borrowing costs. More important than near-term earnings strength is whether the Company can sustain high capital efficiency from 2027 onward.
Earnings Core | Old Unutilized Properties and Profit Margins
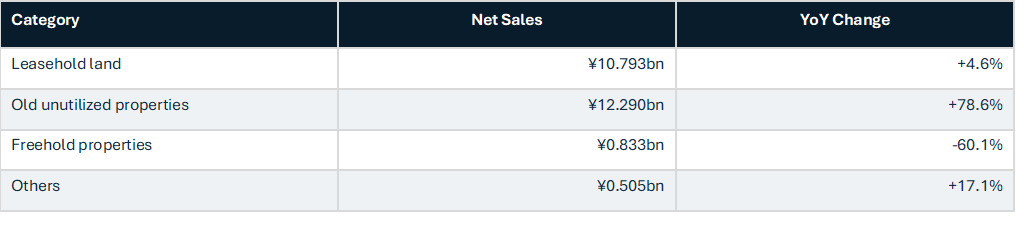
Net sales rose 23.9% year on year to ¥24.422 billion, while operating income increased 26.0% to ¥3.340 billion, for an operating margin of 13.7%. Old unutilized property sales increased 78.6% to ¥12.290 billion, leading growth, while leasehold land sales rose 4.6% to ¥10.793 billion. Yet interest expense rose from ¥242 million to ¥432 million, keeping ordinary income growth at 20.7%. The Company maintained its full-year forecast, which requires operating income of ¥339 million in 4Q. We consider the forecast highly achievable, but quarterly earnings depend on the timing of property sales; the nine-month progress rate alone is not enough to assume that full-year earnings will exceed guidance.
Net Sales by Property Category, First Nine Months
Implications for Equity Value | Turning Inventory into Profit and Cash
Real estate for sale totaled ¥33.509 billion at the end of September, with net debt of ¥20.518 billion. The relatively recent acquisition profile of its inventory and the Company’s rights-adjustment capabilities, emphasized in our previous 2Q Update Report, remain competitive strengths. But inventory growth alone does not create shareholder value. Nine-month interest expense increased 78.0% year on year, making higher interest rates and longer holding periods a material risk. No 3Q cash flow statement was prepared, so the latest results cannot by themselves confirm stronger cash conversion.
Our previous 12–18-month fair-value range of ¥1,000–1,200 and 2030 median future fair value of ¥1,600 per share are Omega Investment estimates premised on improved inventory turnover and capital efficiency. The latest results support that direction, but our analysis must also reflect the planned revision of numerical targets under the Medium-term Management Plan around February 2027 and the profitability of derivative businesses from 2028 onward. We will present our formal investment view and updated fair value in an upcoming Update Report after further reviewing the results and management’s explanations.
Company Profile
Sansei Landic purchases real estate with complex rights relationships, including leasehold land, old unutilized properties, and freehold properties, then creates value through rights adjustment and resale. It is also developing derivative businesses involving co-ownership interests, the Long-term holding business of Old unutilized properties, loan-for-use, and leasehold rights.
Note: The share price is the November 13, 2026 close. BPS is calculated by Omega Investment using September-end shareholders’ equity of ¥15,224,788 thousand divided by 16,302,246 shares outstanding net of treasury shares. Simplified forecast ROE is the Company’s forecast EPS of ¥134.62 divided by BPS of ¥933.91. The ¥37.50 forecast dividend is adjusted for the July 2-for-1 stock split.
References: FY12/2026 3Q earnings release and supplemental materials.
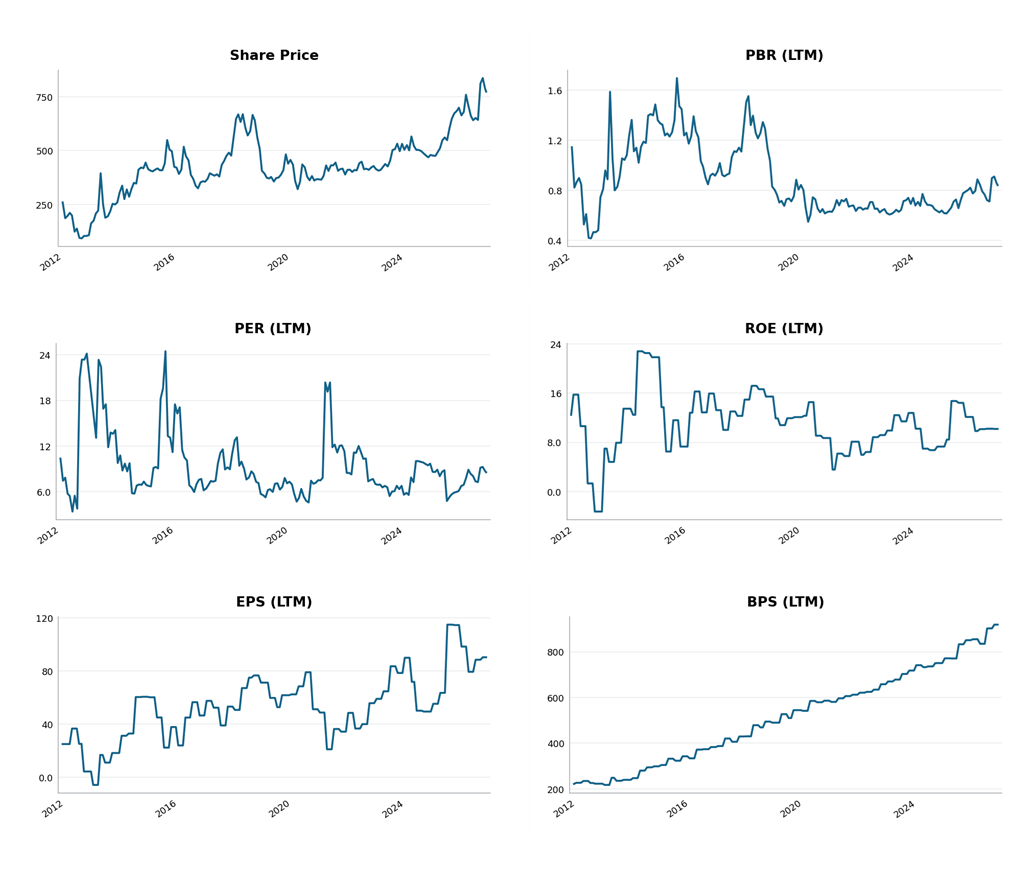
Sansei Landic (3277) | Long-Term Share Price and Valuation Trends
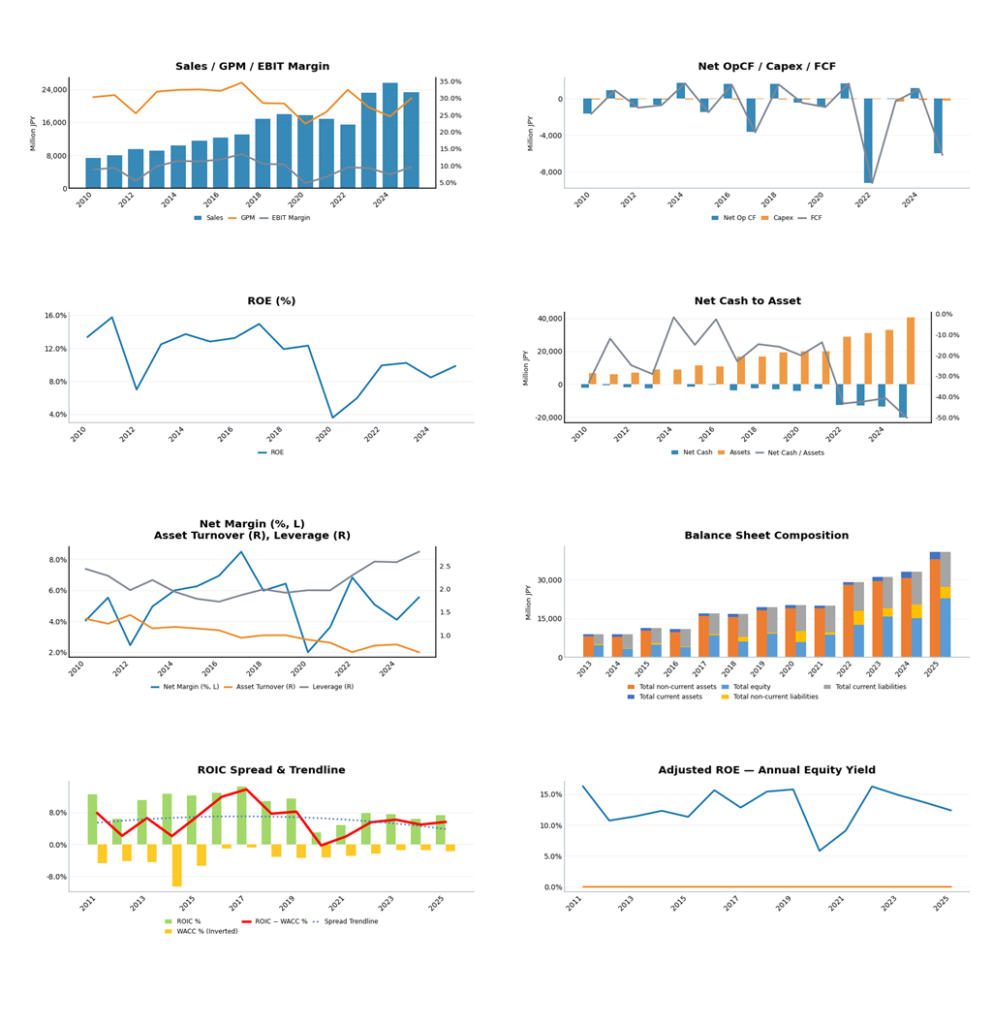
Sansei Landic (3277) | Long-Term Performance, Financial Position and Capital Efficiency