2026-07-27
Home
Japanese

Omega Investment Co., Ltd.
TENPO INNOVATION (Initiation)

Model resiliency proven under the pandemic
Attractive candidate to outperform in the high inflation environment
| Click here for the PDF version of this page |
| PDF Version |
SUMMARY
- According to the JF Food Service Industry Market Trend Survey for March 2022, total restaurant stores declined -1.0% YoY, and relative to March 2019, declined 6.4%, yet to post a meaningful recovery. For the same period, subleased restaurant store properties for TENPO INNOVATION increased 14.7% YoY, and relative to March 2019, increased 33.7%. In other words, there is no correlation between TENPO INNOVATION subleased restaurant store properties and the underlying restaurant market trend.
- This is because the Company has expertise in finding and subleasing relatively small, low rent, vacated-furnished restaurant store properties, many in central Tokyo, where there is always high demand. Even in an industry with well-recognized high turnover rates, strict ascertainment in selecting store properties to sublease ensures that new tenants can easily be found. A less well-understood point about the business model is that profit margins have a built-in structural growth factor going forward as the ratio of subleases with successor tenants rises from the current roughly 25%; acquisition costs such as key money, etc. on procuring new properties to sublease are sunk on the first tenant, and they drop out with successors (turnover actually increases profit margins).
- The US Bureau of Labor Statistics reported the CPI for March 2022 was 8.5%, the highest level in 40 years, and Fed officials have signaled they may need to raise rates to ‘restrictive’ levels to stabilize inflation and the economy. The stock market is now climbing the so-called “wall of worry” faced with the outlook for rising interest rates and slowing economic growth. Our thesis (investment opportunity) is the share price has underperformed due to being associated with the restaurant market, but in reality, sales are growing at highly stable sustainable double-digits, and profit margins are rising.
TENPO INNOVATION : Sustainable double-digit growth with high stability
Financial Indicators
| Share price (6/10) | 850 | 23.3 P/E (CE) | 20.5x |
| YH (22/3/29) | 909 | 23.3 EV/EBITDA (CE) | 10.5x |
| YL (22/1/27) | 790 | 22.3 ROE (act) | 21.1% |
| 10YH (19/12/11) | 1,117 | 22.3 ROIC (act) | 18.6% |
| 10YL (20/4/6) | 477 | 22.3 P/B (act) | 4.51x |
| Shrs out. (mn shrs) | 17.674 | 22.3 DY (act) | 1.41% |
| Mkt cap (¥ bn) | 15.023 | ||
| EV (¥ bn) | 11.556 | ||
| Equity ratio (3/31) | 28.0% |
Table of Contents
| ① | INTRODUCTION: Restaurant industry trends under COVID-19, and our thesis (investment opportunity) |
| ② | BUSINESS: Business description, model strengths and attractive features, corporate history, key director bios |
| ③ | EARNINGS: FY3/22 review and FY3/23 outlook, MTP overview and targets |
| ④ | SHAREHOLDERS: Share price and valuations trend, major shareholders, shareholder returns |
| ⑤ | SUPPLEMENT: as reported financial statements |
TENPO INNOVATION : Specialist in subleasing vacated-furnished restaurant store properties in Tokyo
PART ①:INTRODUCTION
Highly stable, defensive business model with sustainable double-digit growth
TENPO INNOVATION conducted an IPO and listed its shares on the TSE Mothers market in Oct-2017, and successfully moved to the TSE 1ST Section in Oct-2018. While it has been listed on the TSE Prime market since this April, the high potential of its business model and attractive profit structure is not yet widely understood, in our view. We examine the Company’s business description and strengths and attractive characteristics of its business model in Part 2, however as a brief capsule summary, the Company is primarily engaged in restaurant store subleasing business in the greater Tokyo Metropolitan area, with a high weighting in central Tokyo store properties. It is the only listed company focused on this highly specialized business, and there are no major direct competitors, listed or not.
Omega Investment’s thesis (investment opportunity) for TENPO INNOVATION
- In Part 1, we present both macro-level and micro-level data that clearly shows that the restaurant industry, like all areas in hospitality services (travel, lodging, dining, drinking, live entertainment, etc.), was severely affected by spread of the once-in-a-century COVID-19 global pandemic, due to repeated declarations of a state of emergency, restrictions on economic activities, stay-at-home orders, widespread adoption by companies of telework policies allowing employees to work from home, shortened and/or suspended business hours for dining and drinking establishments, as well as health guidelines from the national and local governments strongly urging people to avoid congregating in enclosed, indoor spaces.
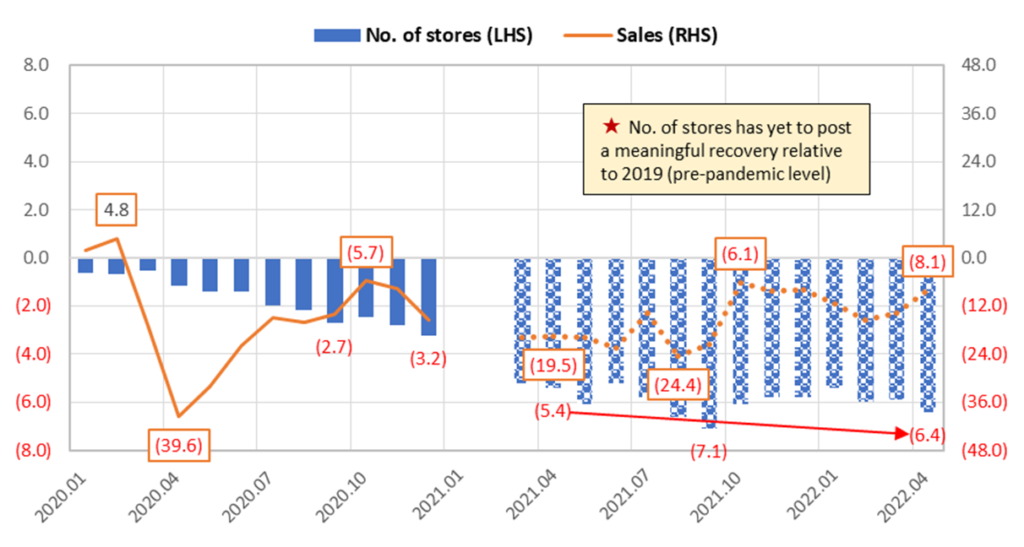
- While micro data collected from restaurant operators shows a recovery in YoY figures in 2021 relative to the lows in 2020, YoY statistical analysis can be somewhat misleading, and as of Apr-2022, data from the JF monthly survey shows that relative to Apr-2019, i.e. prior to COVID-19, total restaurant industry sales were still down -8.1%, and the number of stores was still down -6.4%, actually worse than -5.4% in Apr-2021. At the same time, TENPO INNOVATION only experienced a slight -1.9% dip in the number of subleased store properties from the Jun-20 peak to the low in Oct-20, ending FY3/21 +1.3% YoY.
- At a minimum, the market is incorrectly conflating the underlying market trend in the number of total restaurant stores as an indicator for the Company’s business, and as a result of strong earnings performance, undervaluation has become more pronounced.
TENPO INNOVATION: Metropolitan Tokyo restaurant store property subleasing specialist
METI Trends in Food and Beverage Related Industries in 2021
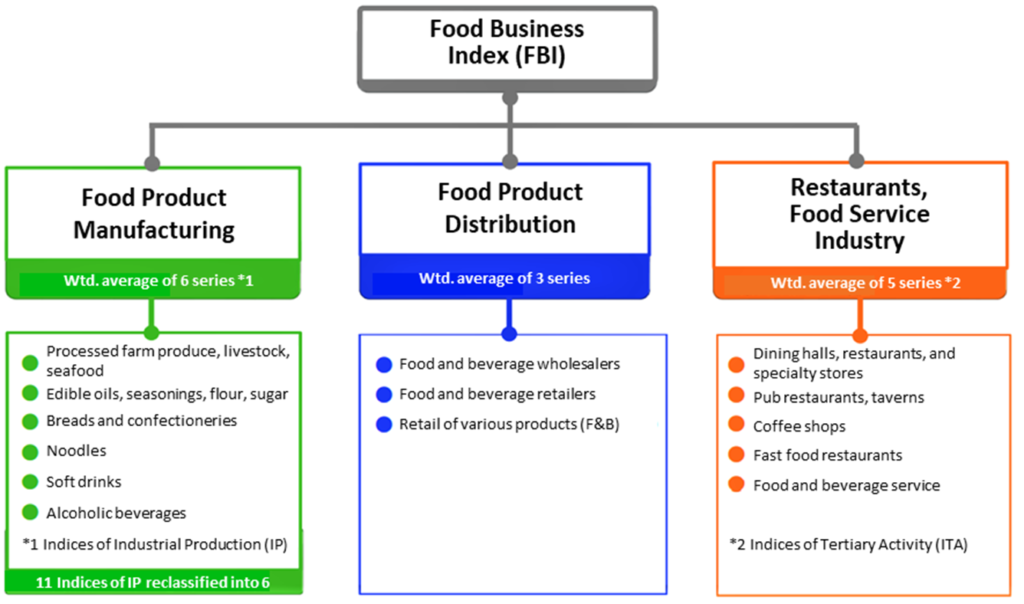
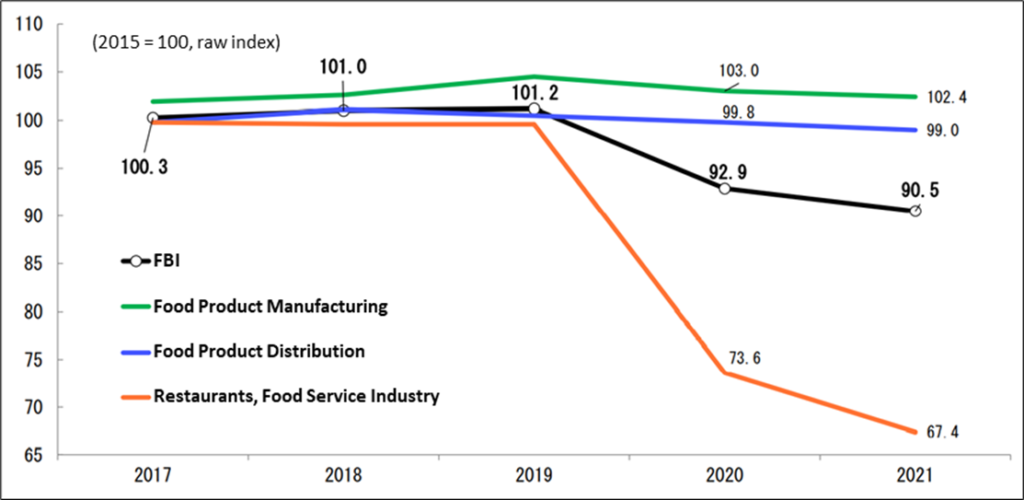
For macro-level data, we have found METI’s semi-annual (May/Oct) Trends in Food and Beverage Related Industries provides the most useful top-down approach, which gives a handy snapshot overview of current trends in food service-related industries. The methodology employed in creating the Food Business Index (FBI) shown below draws on METI’s database for indices of industrial production (IP) for manufacturing sectors and indices of tertiary activity (ITA) for service sectors. The advantage of this index-based approach is that it provides an accurate picture of the trend level of an historical time series without suffering from the shortcomings of the base effect inherent in YoY statistical analysis, and the current FBI series is indexed to 2015 = 100.
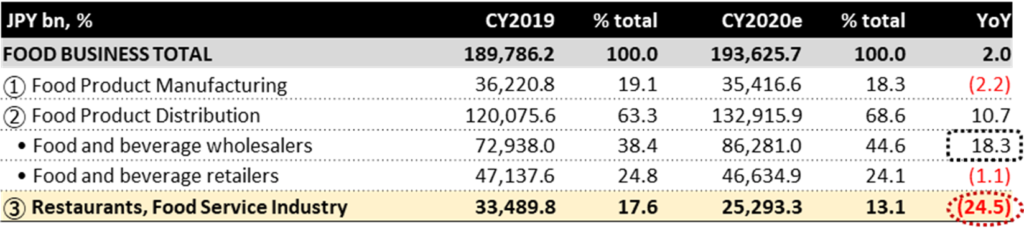
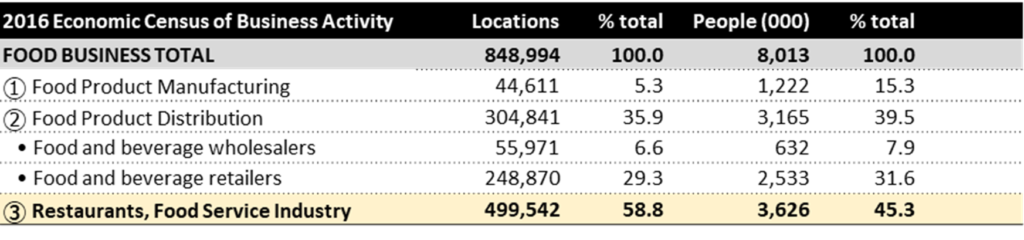
The two tables at the bottom of the page provide the nominal scale of the three component sectors of overall food business in Japan, as well the number of business locations and employees for each from the 2016 Census of Economic Activity. The key takeaways from the CY2020 market are F&B wholesalers increased +18.3%, while restaurants declined -24.5%.
Food and Beverage-related Business Nominal Size (JPY bn)
Food and Beverage-related Business No. of Locations and No. of Employees
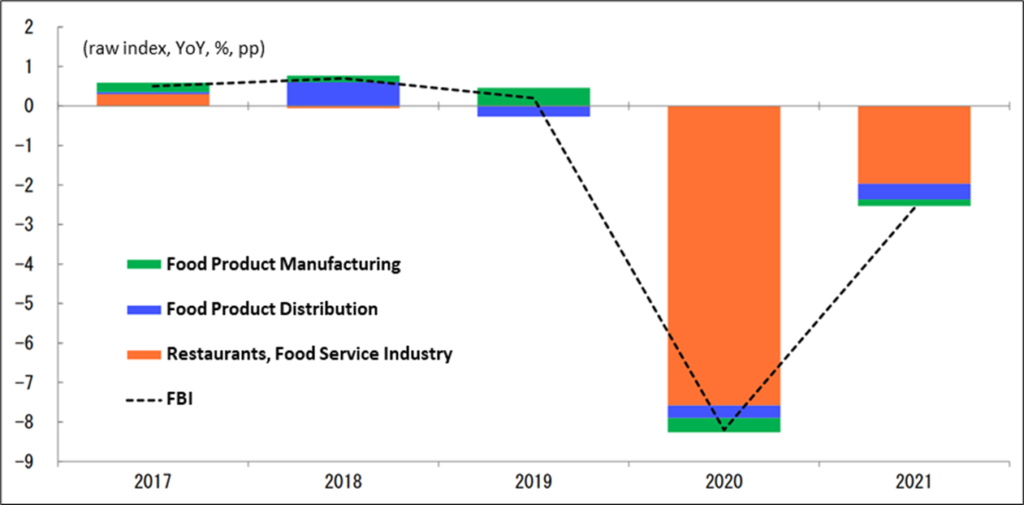
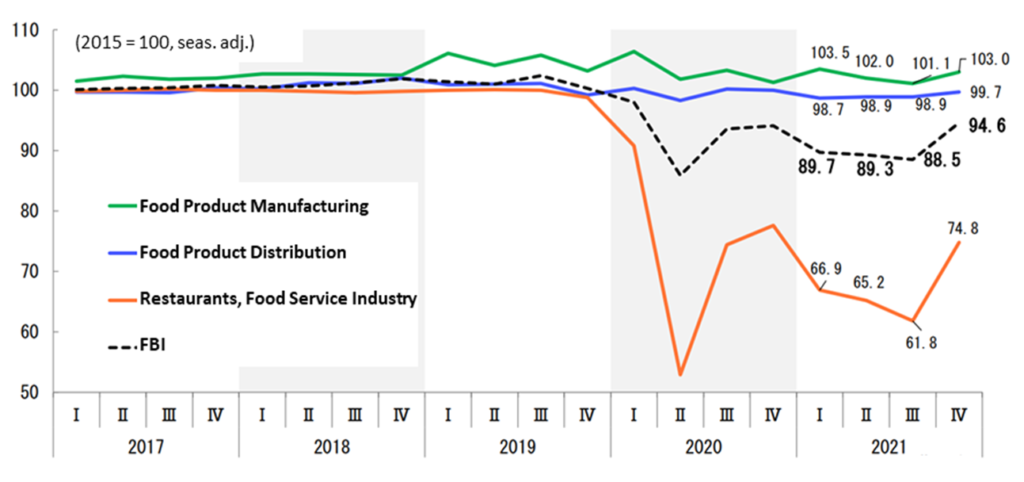
The title of METI’s Office of Economic Analysis report published on May 20, 2022 is “Food Business in 2021: Food Service Industry Declines for Second Consecutive Year, Sluggishness Continues.” In 2021, the FBI had an index value of 90.5, a year-on-year decline of -2.6%, the second consecutive year of decline. The three industries included in the index are Food Product Manufacturing (-0.6% YoY), Food Product Distribution (-0.8% YoY), and Restaurants, Food Service Industry (-8.4% YoY). Regarding the degree of impact on the FBI’s year-over-year growth rate by component sector, Restaurants, Food Service Industry contributed -2.0 percentage points to the 2021 FBI’s -2.6% YoY growth rate, followed by Food Product Distribution which contributed -0.4pp. In 2021, the impact of the decline in Restaurants, Food Service Industry remained significant. In other words, restaurants accounted for virtually all the decline in 2020 and 2021.
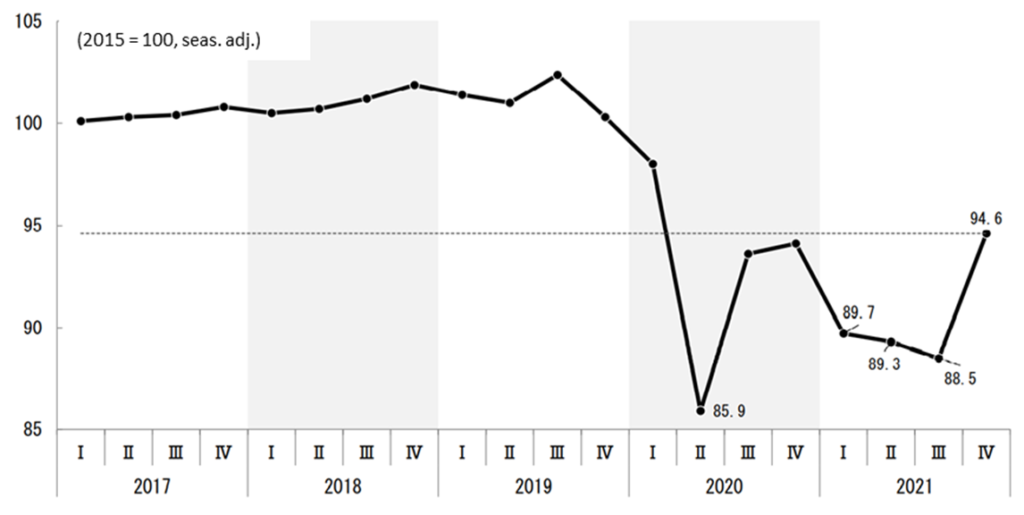
The three graphs on the following page show the trend of the various indices on a quarterly basis. Despite a recovery trend in the second half of 2020, the FBI in 2021 fell sharply in the first quarter, -4.7% quarter-over-quarter, and continued to decline through the 3Q. The index value of 88.5 is the second lowest level within the current series (since 2013) after the index value of 85.9 in the 2Q of 2020, again virtually all due to the decline in restaurants.
METI Food Business Index (FBI) Annual Trend
Degree of impact on FBI year-on-year growth rate
FBI Quarterly Trend (seasonally adjusted)
FBI Quarterly Breakdown of Component Industries (seasonally adjusted)
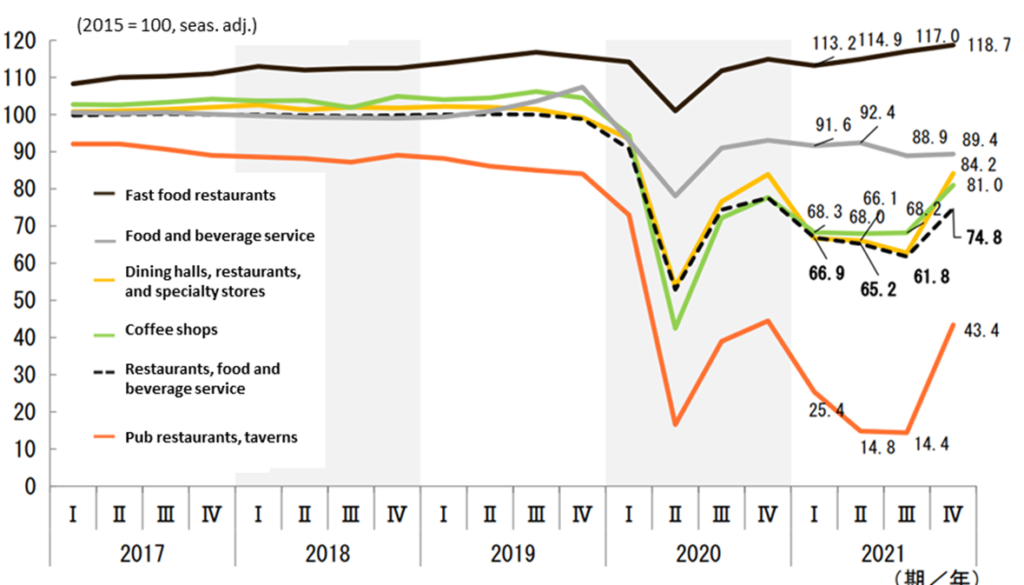
Restaurants, Food Service Industry Quarterly Breakdown of Component Industries (S.A.)
JF Monthly and Annual Surveys of the Food Service Industry
Indexed from 2015 = 100, macro-level data showed METI’s Food Business Index (FBI) for the Restaurants, Food Service Industry had an annual value of 67.4, and on a quarterly basis, 3Q 2021 posted the second lowest value of 61.8, and 4Q 74.8, attesting to the severity of the impact to the industry in the wake of COVID-19. For micro-level data, we have found the monthly and annual surveys by the Japan Foodservice Association (JF) provide the most useful bottom-up approach, providing timely updates for the restaurant industry based on direct responses from restaurants and food and beverage service providers.
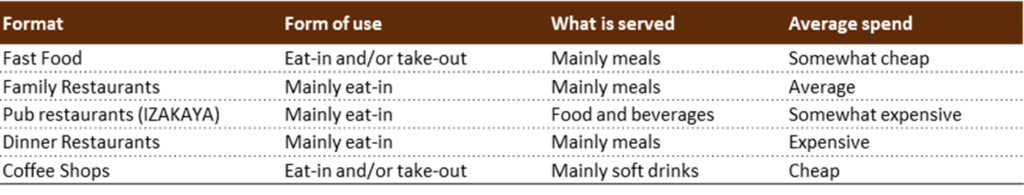
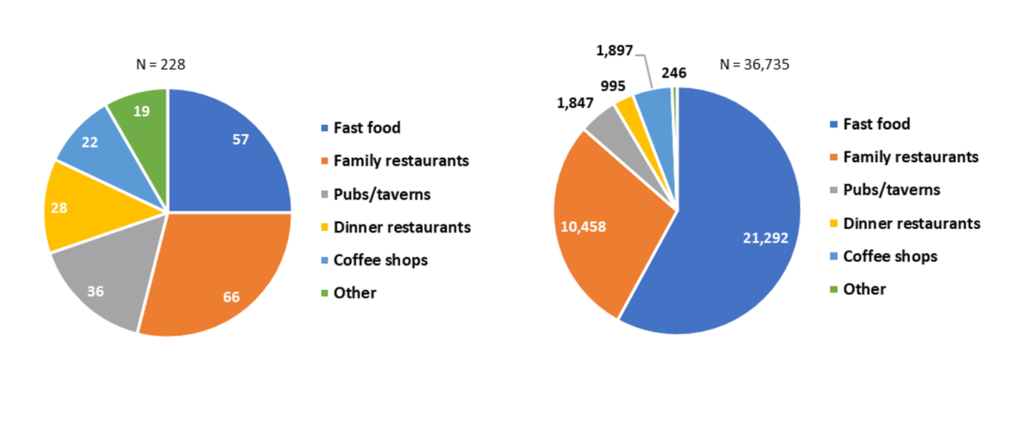
The pie graphs below show the Apr-2022 JF Food Service Industry Market Trend Survey was based on responses from 228 companies which operate 36,735 stores, a more than adequate sample size to accurately reflect the underlying trends, and the pie graphs present the breakdown by restaurant format. The table above the two pie graphs provides a description of each of the restaurant formats, which is based on definitions and the classification system employed by METI. JF also produces an annual report estimating the market size of the Foodservice Industry, which is adopted by METI in its FBI analysis. Data from Japan Foodservice Association (JF) “Estimation of Food Service Industry Market Size,” December 2021 is summarized on P9. The key takeaway from the long-term graph on the top of the page is simply the extent of the shock from COVID-19 within a 40-year horizon.
Then P10 provides a summary of monthly and annual data from JF Food Service Industry Market Trend Surveys. The key takeaway from the annual graph at the top of the page is that net store closures (JF stores data is based on all stores) is a lagging indicator to the recovery in sales and customer traffic. The middle graph shows the YoY trend of monthly data from JF surveys. Based on this graph, one might conclude that the restaurant industry entered a recovery trend from the 2H of 2021. HOWEVER, YoY statistical analysis can be misleading in the wake of large swings. JF recognized this phenomenon, and from its Mar-21 survey report, it added two columns on the right-hand side of the data table to include comparisons relative to the same month in 2019, i.e. before the pandemic. The key takeaway from the lower graph which shows the comparison versus 2019 is that total stores have yet to post a meaningful recovery, -6.4% in Apr-22, worse than -5.4% in Apr-21.
Japan Foodservice Assoc.
JF was established in 1974 under approval of the Ministry of Agriculture, Forestry and Fisheries. The number of regular and supporting member companies has reached 800, representing an estimated market size of approx. ¥25 trillion with 5 million workers.
JF Restaurant Format Classifications Based on METI Statistics Definitions
JF Food Service Industry Market Trend Survey Apr-2022 No. of Companies (left) and No. of Stores (right)
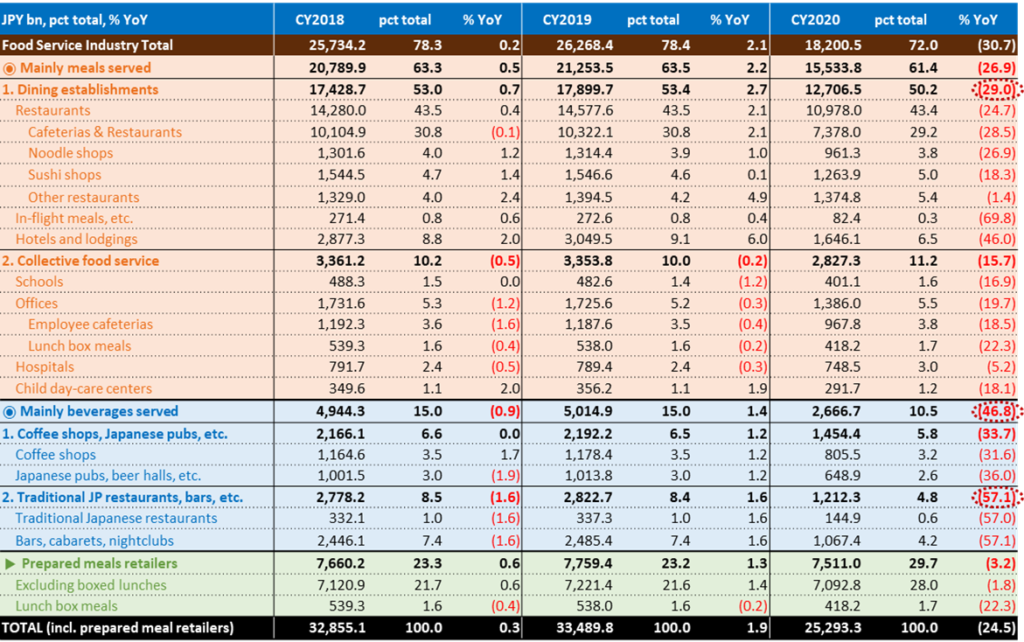
Japan Foodservice Association [JF] Estimated Restaurant Industry Market Size (JPY trn)
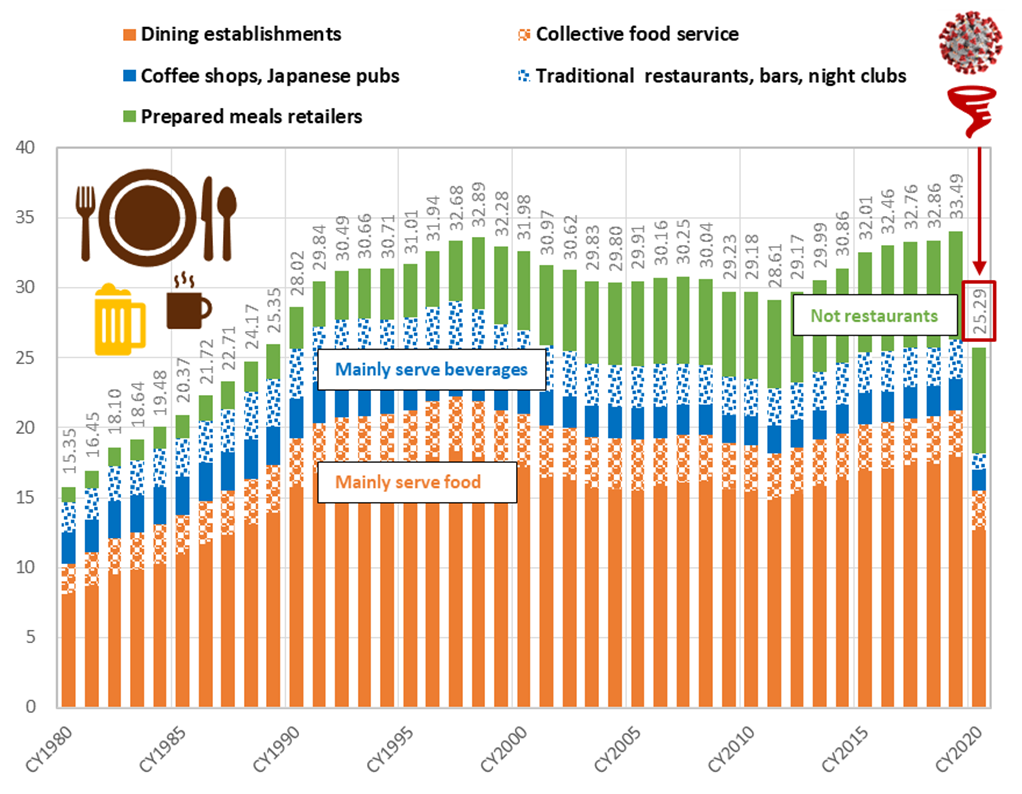
Japan Foodservice Association (JF) Estimated Restaurant Industry Market Size (JPY bn)
JF Food Service Industry Market YoY Trend Survey – Annual Results Reports
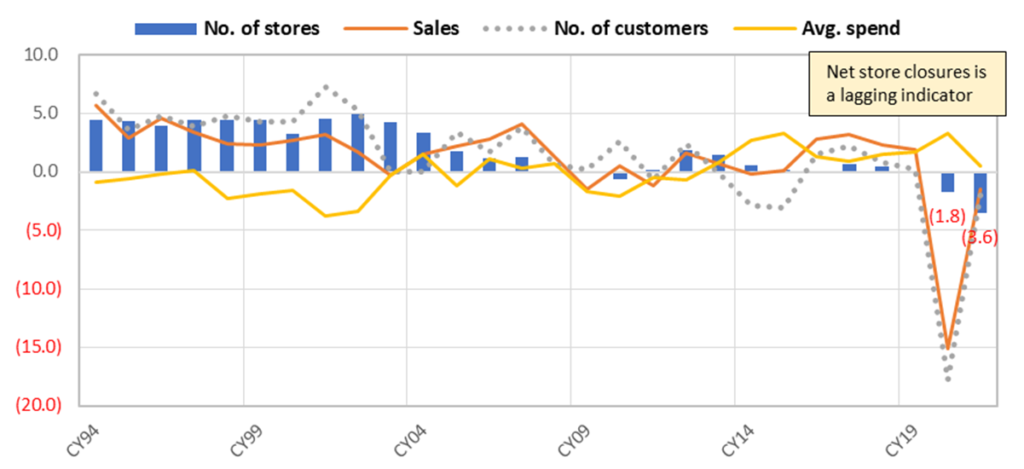
 |  |  |  |
| No. of stores | Sales | No. of customers | Avg. spend |
JF Food Service Industry Market YoY Trend Survey – Monthly Results Reports
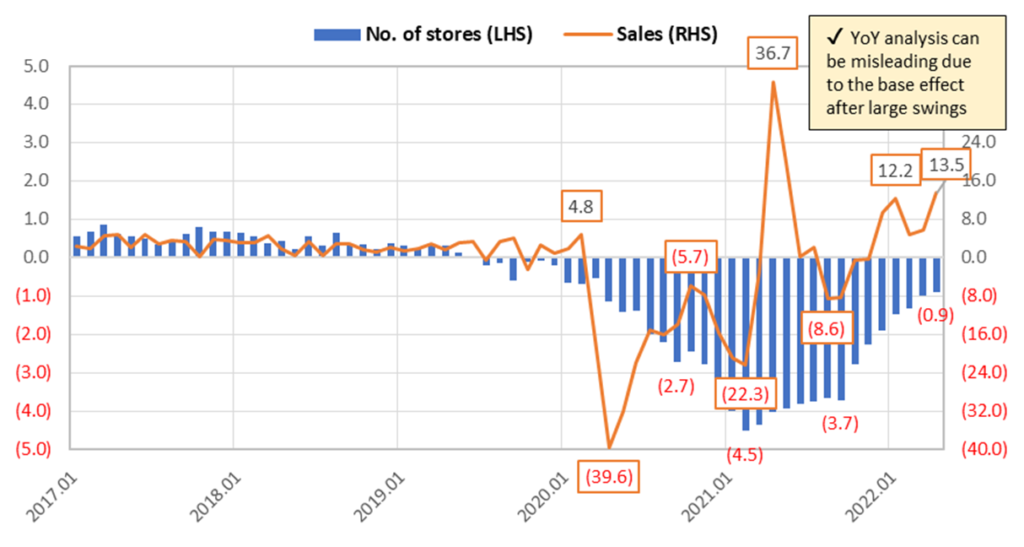
Key takeaways:
❶ Net store closures of restaurants in the all-stores data on the right is clearly a lagging indicator relative to sales. The middle graph on the right suggests the impact from a once-in-a-century global pandemic appears to be mitigating finally.
JF Food Service Industry Market YoY Monthly Trend Survey – adjusted vs. 2019*
❷ However, YoY figures, by definition, are versus the same month in the previous year, which can be deceptive after large declines.
In order to strip out the base level effect, from Mar-2021, the JF monthly survey results report added two new columns to include sales and no. of stores comparisons versus the corresponding month in 2019 (see lower graph on the right).
TENPO INNOVATION subleased store properties are uncorrelated with the market
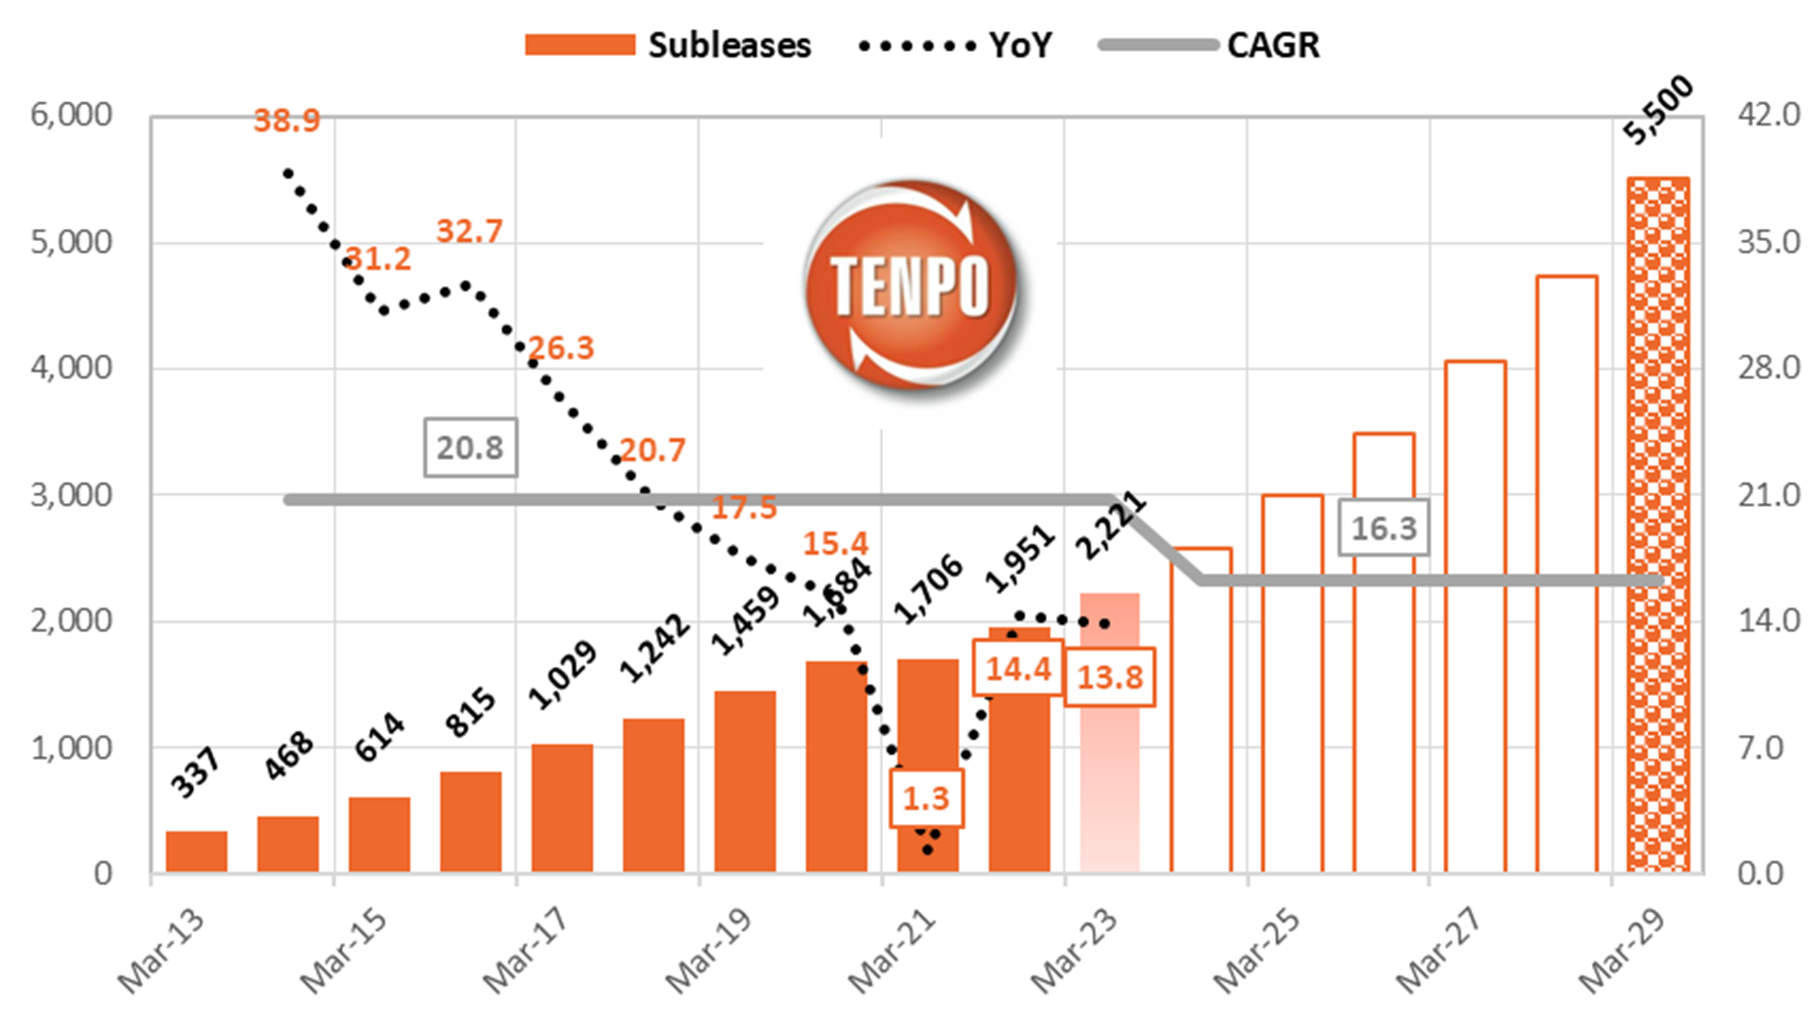
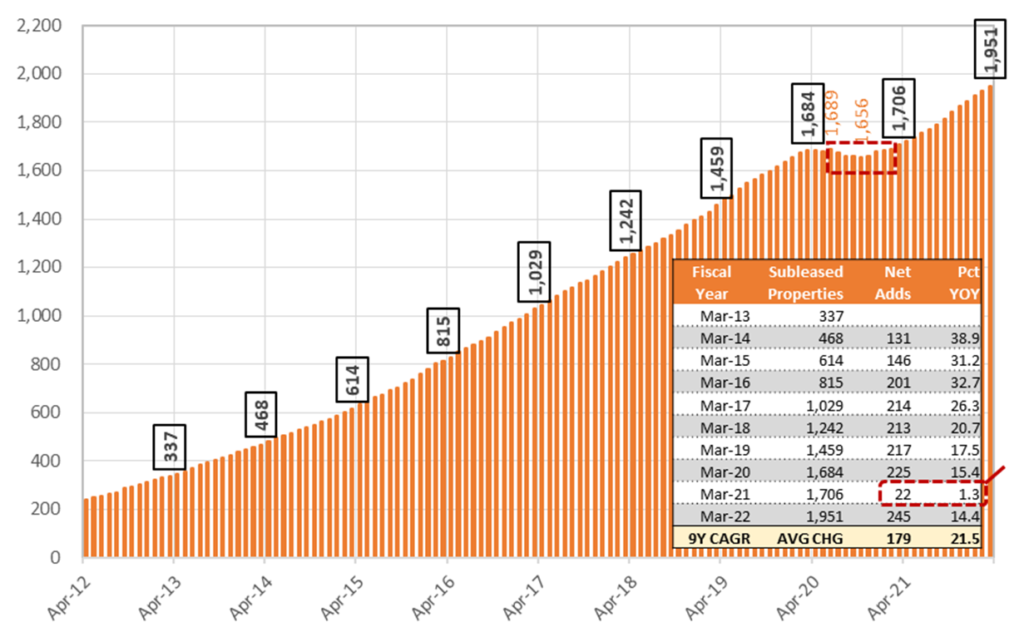
According to the JF Food Service Industry Market YoY Trend Survey for March 2022, total stores declined -1.0% YoY, and relative to March 2019, declined 6.4%, yet to post a meaningful recovery. Well, what about the trend for the Company? For the same period, subleased restaurant store properties for TENPO INNOVATION increased 14.7% YoY, and relative to March 2019, increased 33.7%. In other words, there is no correlation between TENPO INNOVATION subleased restaurant store properties and the underlying market trend for total stores. They are completely uncorrelated. The graph below shows the long-term monthly trend of the Company’s subleased restaurant store properties.
Monthly trend of subleased store properties: textbook definition of stable high growth
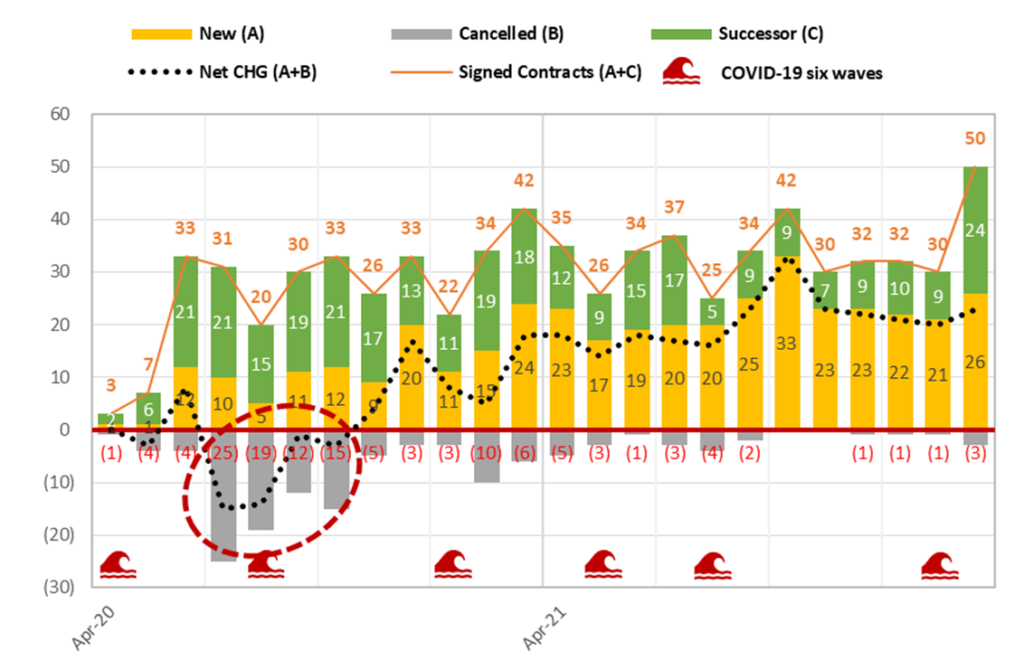
Monthly trend of sublease contract transactions
TENPO INNOVATION : Sustainable double-digit growth with high stability
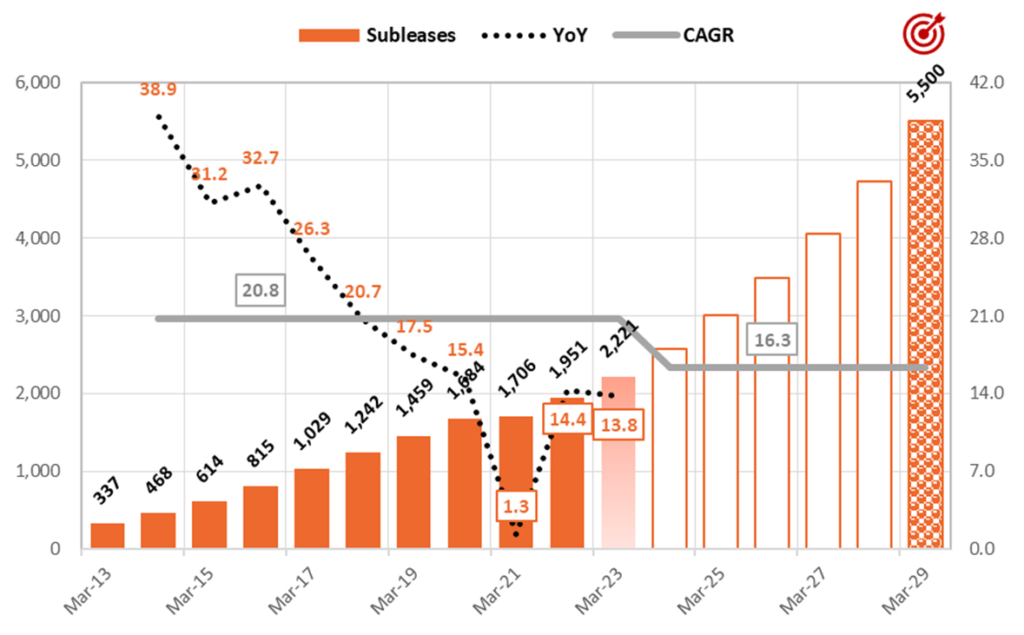
Despite the severe impact on the restaurant industry from COVID-19, TENPO INNOVATION only experienced a slight dip in the number of subleased store properties from the previous peak of 1,689 stores in Jun-20, down -1.95% or -33 stores to 1,656 at the low in Oct-20 (tiny red box at the top of the graph on P11), and then exceeded the previous peak by the end of Feb-21 to 1,690, and finished FY3/21 at 1,706 as of the end of Mar-21, +1.3% or +22 stores YoY. We examine details of the highly stable business model in Part 2, however the brief capsule summary is that when the Company concludes a lease agreement with the owner of a store property, as the tenant it is automatically granted a lease right, whereby in principle, unless the Company cancels the agreement, it can continue to renew the lease.
The graph above shows the Company’s medium-term target for 5,500 subleased properties by the end of FY3/29, implying 6-year CAGR of +16.3% per year. This target was not randomly formulated by simply assigning a certain CAGR growth rate, rather, it is equivalent to a roughly 5% market share of the estimated 110,000 viable candidate restaurant store property universe in Tokyo and the three surrounding prefectures, based on the total number of 160,000 restaurants from the 2016 Economic Census of Business Activity. In order to achieve this target, a key initiative in the Company’s Medium-Term Management Plan is to boost its salesforce from the current 40 professionals (14 store procurement, 26 finding subleasing tenants) to 100 (30 store procurement, 70 finding subleasing tenants).

PART ② BUSINESS

Business description and strengths and attractive features of the business model
When you go to the Company’s website and open the home page, you are presented with an aerial view of central Tokyo. Then if you click on the lower right-hand corner, a 1:24 minute flashy YouTube video with a catchy soundtrack starts playing, highlighting some headline bullet points about the attractiveness of the Tokyo restaurant market.
TOKYO × TENPO INNOVATION
Grab Tokyo.
The world’s largest number of passengers Shinjuku Station: 3.59 million
The world’s largest number of restaurants Metropolitan Tokyo: 79,601
The world’s top gastronomic city No. of Michelin-star restaurants: 226
We compete in this city with the highest potential.
The world’s most traversed pedestrians Shibuya
The world’s best subculture district Akihabara
There is more we can do.
99% untapped market.
We will not stop and will keep pushing forward.
It will become a big swell and envelop this city.
From because we can do it → so we will do it.

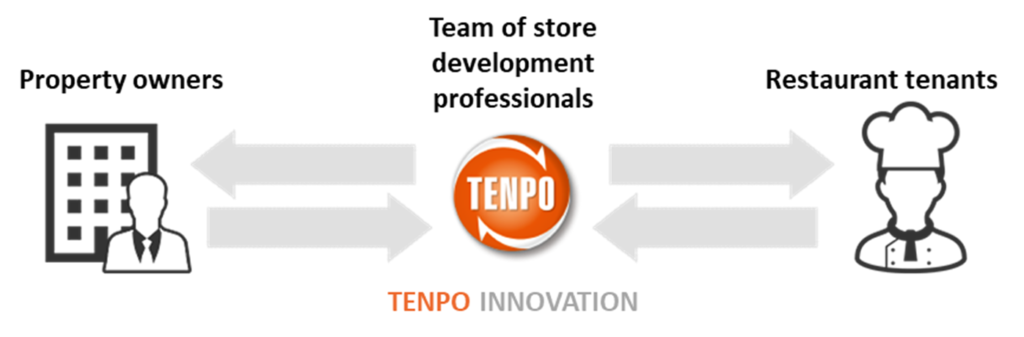
TENPO INNOVATION: Restaurant store property subleasing specialist
TENPO INNOVATION is a real estate company, but it does not handle agency brokerage business and management business as in the case of a general real estate company. Further, TENPO INNOVATION is a real estate company specializing in stores. General real estate companies handle residential properties, offices, warehouses, parking lots, among others. The Company doesn’t handle any of these, and only specializes in store properties. And roughly 90-95% of contracts are for restaurants, so the Company is a specialist in store subleasing business for restaurants.
The Company leases mainly vacated-furnished store properties from real estate owners, and then subleases them to restaurant operators. According to the Company, the standard format of lease contracts with owners stipulates 3-months notice required to cancel a contract, and it is automatically granted a lease right, whereby unless the Company cancels a contract, in principle it can continue to renew the lease. This lease right is a key factor in the long-term stability of the Company’s subleasing business, as demonstrated in the exhibits on P10. Standard sublease contracts with restaurant operators stipulate 7-months notice required to cancel a contract. Store operators are required to give a deposit equivalent to 10-months rent, provide a co-signer on the lease, and enter a rent fulfillment guarantee agreement with a rent guarantee provider.
Revenue from store subleasing business is divided into “initial” and “running.” Initial revenue consists of 1) non-refundable “key money,” a custom specific to the Japanese market, which is a mandatory payment from a new tenant to a landlord, and is not returned when the lease is cancelled, and 2) proceeds from the sale of fixtures to the new tenant entering a vacated-furnished property. Running revenue consists of monthly rent payments from store tenants. According to the Company, the breakdown is roughly 10% from initial revenue and 90% from running. While the restaurant industry itself is known to be plagued with a relatively high number of failures, making average contract length effectively immaterial, the Company says average turnover has been quite consistent over time, equivalent to roughly 10% every year, or 50% every 5 years.
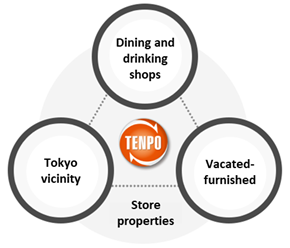
Expertise in finding and subleasing relatively small, low rent, vacated- furnished restaurant store properties, many in central Tokyo.
The company is also engaged in real estate sales business, which is revenue recorded from the sale of real estate for sale, etc. For subleasing business, procuring attractive store properties is a key point, and real estate agents are a prime source of good information on viable candidate properties meeting the Company’s requirements. However, from a real estate agent’s point a view, one month’s rent, or roughly 200-300,000 yen, is the standard commission to find a tenant, which is not a significant amount of money. At the same time, commission on the purchase or sales of a property can be several million yen up to 10,000,000 yen.
The primary motivation to engage in this business is to establish and maintain good relationships with real estate agents, since they have valuable information on properties to procure for subleasing. The average size of a real estate purchase is small, averaging around one hundred million yen, and is quickly turned around for resale, for an average holding period of roughly 8 months (sometimes over 1 year). The average gross profit margin is around 30%. Next, we look at the typical workflow for the 3 main areas of operation for mainstay restaurant store subleasing business.
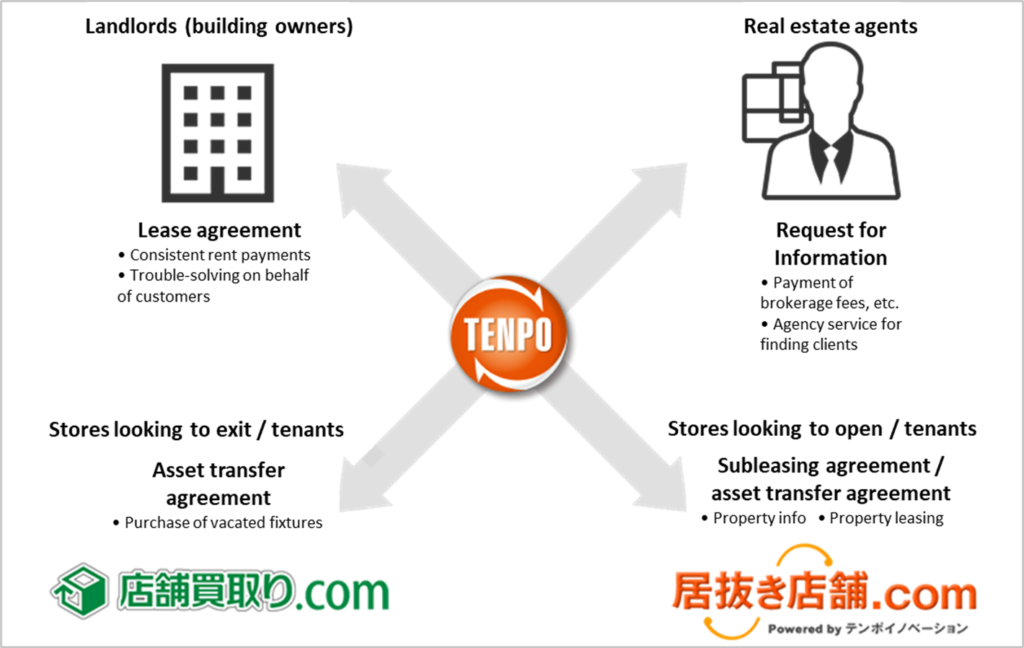
Store property leasing from owners (procurement)
Through sales activities to real estate agents by sales representatives assigned by major train station areas, introductions from business partners and existing store operators, etc., as well as through in-house website “TENPOKAITORI.com,” (‘Store buy-backs’.com) which specializes in store purchases, the Company collects information on stores that are considering withdrawing from the market, and proceeds to research properties to be handled by the Company. TENPO INNOVATION has accumulated expertise in property evaluation based on lengthy experience in handling store properties and subsequent verification and analysis of such properties.
In addition, each property survey is conducted based on the know-how cultivated through the experience and expertise of our property management staff, which supports the handling of properties. After the property survey, we negotiate with the lender or real estate agent of the candidate property, negotiate the details of the lease agreement, pay the deposit and other contractual fees, and conclude the lease agreement between the property owner and the Company.
Store property subleasing to tenants
For store properties for which we have concluded lease contracts, we solicit prospective tenants by using real estate agents as intermediaries and by introducing them to members of our website “INUKITENPO.com” (‘Vacated-furnished stores’.com), which provides information mainly on vacated-furnished store properties, a mechanism that facilitates those who wish to open stores to search for properties. The site enhances the value of information by quickly posting and updating property information obtained daily.
As of March 31, 2022, the site has 74,415 members, which is one of the Company’s strengths in matching prospective tenants with stores. In addition, the Company also conduct sales activities to approach a wide range of people who are interested in opening new stores. After receiving an application for a property from a prospective tenant, staff conduct a credit screening, negotiate the details of a sublease agreement, receive a security deposit and other contractual payments, and conclude a sublease agreement between the Company and the tenant.
Store property management
In property management work, TENPO INNOVATION is building operations by utilizing its accumulated know-how to address issues such as rent collection and troubleshooting that plague real estate owners and property management companies. In addition, in order to prevent problems or detect and deal with them at an early stage, we check properties, collect information, and build relationships with store operators and others.
TENPO INNOVATION Corporate History
| Date | Summary |
| 2007.11 | In preparation for spin-off, Tenpo-Renovation Spin-off Unit Co., Ltd. established in Roppongi, Minato-ku, Tokyo (capital 50,000 yen, now the Company) |
| 2007.12 | Took succession of a portion of the restaurant store open and exit support business from the former Tenpo- Renovation Inc. through spin-off |
| 2008.01 | Company name changed to Tenpo-Renovation Inc. |
| Increased capital to 10 million yen | |
| 2008.05 | Telewave Co., Ltd. (now iFLAG Co., Ltd.) acquired all shares (became a consolidated subsidiary of Telewave Co., Ltd.) |
| Head office relocated to Nishi-Shinjuku, Shinjuku-ku, Tokyo | |
| 2009.06 | Launched INUKITENPO.com (i-tenpo.com), a website for information on vacated-furnished properties for restaurant stores |
| 2009.07 | CROPS CORPORATION acquired all shares (became a consolidated subsidiary of CROPS CORPORATION) |
| 2009.09 | Head office relocated to Ebisu, Shibuya-ku, Tokyo |
| 2010.04 | Increased capital to 90 million yen |
| 2010.06 | Launched TENPOKAITORI.com (k-tenpo.com), a website for buyout of vacated-furnished properties for restaurant stores |
| 2012.02 | Head office relocated to Nishi-Shinjuku, Shinjuku-ku, Tokyo |
| 2012.12 | Shinbashi Branch opened in Shinbashi, Minato-ku, Tokyo |
| 2013.04 | Ikebukuro branch opened in Higashi-Ikebukuro, Toshima-ku, Tokyo |
| 2013.05 | Company name changed to Tenpo Innovation CO., LTD. |
| 2014.11 | Ueno Branch opened in Ueno, Taito-ku, Tokyo |
| 2015.05 | Roppongi Branch opened in Roppongi, Minato-ku, Tokyo |
| 2016.05 | Head office relocated to Shinjuku, Shinjuku-ku, Tokyo (4 branches including Shinbashi branch closed and integrated into head office) |
| 2017.10 | Listed on the Tokyo Stock Exchange Mothers Market |
| 2018.10 | Changed listing designation to the First Section of the Tokyo Stock Exchange |
Source: compiled by Omega Investment from FY3/21 Annual Securities Report (YUHO), June 16, 2021
Corporate history
In November 2007, the Company was established as Tenpo-Renovation Inc. to prepare for the spin-off of Tenpo-Renovation Inc. in December 2007, and took over a part of the restaurant exit support business (introduction of properties and support for those who wish to open new restaurants, and purchase of restaurant facilities and support for those who wish to exit) from Tebpo-Renovation.
The former Tenpo-Renovation Inc. was established in October 2001 as a subsidiary of REINS International Inc. for the purpose of managing restaurants (the trade name at the time of incorporation was Rayfields Corporation, with brands such as “Gyu-Kaku,” the largest yakiniku chain in Japan, as well as Izakaya and Shabu-Shabu restaurants). In April 2005, the company started a new restaurant exit support business (the actual beginning of the present Company’s business activities). At the time of the corporate spin-off in December 2007, the restaurant exit support business was divided into the business related to REINS International properties and the business related to properties other than REINS International properties, and the Company took over the business related to properties other than those related to REINS International properties.
It became a consolidated subsidiary of Telewave (now iFlag) in the same year, a consolidated subsidiary of CROPS CORPORATION (9428) in 2009, and changed the Company’s name to TENPO INNOVATION in 2013.
Yasuo Hara (born December 25, 1964)
| Date | Summary |
| Nov-05 | Joined Reins International Inc., seconded to former Tenpo-Renovation Inc. |
| Jan-08 | Seconded to the Company |
| May-08 | Director and General Manager of Sales Dept. of the Company |
| Oct-09 | Director, in charge of Web Sales Dept. and Planning Sales Dept., and General Manager of Web Sales Dept. of the Company |
| Jan-10 | Director, in charge of Business Start-up Support Sales Dept. of the Company |
| Jun-11 | Representative Director, President and General Manager of Business Start-up Support Sales Dept. of the Company |
| Apr-12 | Representative Director, President and General Manager of Restaurant Store Leasing Dept. of the Company |
| Sep-14 | Representative Director, President and General Manager of Store Leasing Business Dept. of the Company |
| Oct-15 | Representative Director and President of the Company (to present) |
Note: Yasuo Hara owns 750,000 shares of the Company.
Yohei Shimura (born August 20, 1977)
| Date | Summary |
| Apr-01 | Joined Reins International Inc. |
| Apr-05 | Director of the former Tenpo-Renovation Inc. |
| Nov-07 | Director and General Manager of Administration Dept. of the Company |
| Jun-11 | Managing Director, in charge of Administration Dept. and General Manager of Administration Dept. |
| Apr-14 | April 2014 Managing Director of the Company, in charge of Administration Dept. |
| Oct-15 | October 2015 Managing Director, in charge of Business Administration Dept. and Property Management Dept. and General Manager of Business Administration Dept. of the Company |
| Jun-16 | June 2016 Managing Director, in charge of Business Administration Dept. and General Manager of Business Administration Dept. of the Company |
| Apr-18 | April 2018 Managing Director of the Company, in charge of Business Administration Dept. |
| Apr-19 | April 2019 Senior Managing Director of the Company, in charge of Business Administration Dept. of the Company (to present) |
Note: Yohei Shimua owns 504,000 shares of the Company.
Source: compiled by Omega Investment from FY3/21 Annual Securities Report (YUHO), June 16, 2021.
OMEGA Interview with Senior Managing Director Yohei Shimura
OMEGA: Despite the severe impact on the restaurant industry from COVID-19, TENPO INNOVATION only experienced a slight dip in the number of subleased store properties from the previous peak of 1,689 stores in Jun-20, down -1.95% or -33 stores to 1,656 at the low in Oct-20, and then exceeded the previous peak by the end of Feb-21 to 1,690, and finished FY3/21 at 1,706 as of the end of Mar-21, +1.3% or +22 stores YoY. To what do you attribute this incredibly resilient performance relative to the overall market?
SHIMURA: The main decrease from store closures was observed in relatively large properties over 30 tsubo (over 1,000 square feet), such as those opened by major chain stores, as well as properties with high rents. At the same time, TENPO INNOVATION only focuses on relatively small properties with low rents in good locations in central Tokyo. There is always strong demand for these somewhat rare finds, our area of expertise, and on the assumption that the pandemic will come under control, restaurant operators wishing to open a store who had been waiting for a chance saw an opportunity and pulled the trigger on concluding a sublease.
OMEGA: please elaborate on TENPO INNOVATION’s definition of a “good store property.”
SHIMURA: Yes, we have 3 main criteria when selecting properties to lease for the purpose of subleasing: 1) The store is on the ground floor facing a street, 2) rent is cheap, and 3) it is a vacated-furnished store. Conventional wisdom is that a “good store property” has high pedestrian traffic, is near a station and/or is located on a main street. For fast food and other major restaurant chain stores, that is likely a requirement. However, for individual or small business restaurant operators, the corresponding high rents for those store properties is simply a non-starter economically, considering initial start-up costs in addition to running costs. In our accumulated experience, there is always high demand for store properties with low rent and that are vacated-furnished stores, even if the location is slightly further away from a station. Similar to low rent, the key point about vacated-furnished properties is lowering the initial investment cost.
OMEGA: I see. Changing the topic, how did TENPO INNOVATION arrive at the current business model and attractive profit structure?
SHIMURA: When the Company was originally established 17 years, it was not real estate business, rather, consulting business to support restaurant store exiting and opening. The only thing that had been decided was to engage in business related to restaurant store openings in Tokyo, but without a clear idea of what operations would be profitable. The most important focus at that time was not only handling restaurant store properties, but also introducing the business model of prosperous restaurants in the form of franchises, undertaking construction work on store properties, consulting work for unprofitable restaurants to help them improve their sales, etc., however, we stopped all of these activities when demand was low and the business was unprofitable. We found the highest demand was for introductions to vacated-furnished store properties in good locations in Tokyo, and we accordingly focused our efforts in that area.
We converted our consulting business to real estate business in order to earn recurring stock income from subleasing. This was a critical turning point for us. I believe that it would have been difficult for professionals well-versed in real estate to be successful in this area. The market for store properties is quite small and highly specialized, even within the real estate industry. Our background was in a company that operated “Gyu-Kaku” yakiniku restaurants, and we were amateurs in the real estate field. However, from our experience in opening restaurants ourselves, we accumulated store property know-how.
Rather than a clear plan to engage in real estate business, our aim was to leverage our know-how for store properties as if we were opening a restaurant for ourselves. It took a while to find the right model, but this put the Company on a sustainable growth path.
OMEGA: You explained your criteria for selecting store properties to lease for the purpose of subleasing. Are there any criteria for selecting prospective tenants? Are there any advantages/disadvantages in type of restaurant format?
SHIMURA: Actually, there are not many requirements. We are quite strict in selecting store properties to procure for subleasing, however in the case of prospective tenants, after undergoing a routine credit screening, incoming tenants are required to put down a 10-month security deposit, have a co-signer on the lease as guarantor, and enter a rent guarantee agreement. In the end, it is very difficult to judge whether a new tenant will have a successful restaurant business or not, since the restaurant industry itself has a high open and close ratio, and many restaurants are prone to failure. TENPO INNOVATION’s business model is designed such that, even if a tenant opens a restaurant that fails, if the store property meets the aforementioned criteria, we can simply recruit the next tenant, as these store properties are always in high demand.
Attributes of prospective tenants that work in their favor would include having existing store (s) with a good track record, as well as being able to fund the opening without taking out a loan. Regarding type of restaurant format, I believe our portfolio reflects general trends in the overall market. For example, we have a large number of Izakaya (Japanese-style pubs) and ramen (Chinese noodles) shops as tenants.
OMEGA: I see, so selecting good store properties really is the key factor to medium-term growth, which is a good lead into my next question. In the Company’s Medium-Term Management Plan, one of the key targets in the growth strategy is expanding your salesforce to 100 by FY3/25 (3 years later). If possible, please explain the correlation of the number of sales staff with the number of store properties subleased.
SHIMURA: Yes, it is extremely important to have employees who are capable of procuring good properties. The basic breakdown of sales staff is 30% for procuring store properties and 70% for finding tenants. From a simple theoretical perspective, we have to first increase the number of leased store properties, and then fill them with new tenants. Since we are not competing with any rival company for a certain property per se, as long as we can increase the number of capable sales staff, we can recruit new tenants, and we also have our website to help recruit tenants. We currently have 14 sales professionals dedicated to store property procurement, and a rough average is 20 per person per year, so roughly 280 store properties.
OMEGA: Thank you, the growth strategy seems clear and straightforward, focused on strengthening and expanding procurement. I would like to return to the Company’s business model, and the tenet of having attractive qualities of both growth and stability. I feel that the market’s lack of understanding on this point, as well as misunderstanding that the Company’s earnings are somehow linked to the performance of the overall restaurant market, have contributed to share price underperformance, despite strong business results. If possible, please summarize the key reasons for having both growth and stability.
SHIMURA: Yes, OK. Well, regarding stability, a key point is the lease right automatically granted when we lease a store property from an owner. In principle, unless we cancel the lease contract, we can continue to renew it. In the case of the global outbreak of COVID-19 from Feb-2020, confronted with declarations of a state of emergency, stay-at-home orders and shortened/suspended business hours for restaurants by the Governor of Tokyo, and while there was a pickup in contract cancellations in July through October of that year, strong underlying demand for our store properties was a positive surprise, resulting in the rapid turnaround you mentioned earlier.
Regarding growth, we discussed the growth achieved from steadily increasing the number leased store properties. However, there is also a less understood structural growth element built into our earnings structure from rising profit margins on store subleasing business. Specifically, there are initial acquisition costs associated with entering a new lease agreement. Similar to our subleasing tenants, when we enter a lease agreement with a property owner, we must pay one-time costs of non-refundable key money, contract-related costs, etc.
Annual subleasing contract cancellations have been consistent over time, averaging 10% every year, or 50% every 5 years. When one of our existing tenants exits the business, and we recruit a new tenant, the aforementioned acquisition costs of the store property were sunk on the first subleasing contract, and from the second contract onward, key money and other initial income are effectively pure profits, with little associated acquisition cost. Roughly 25% of current sublease contracts have been replaced by successor tenants, but the number of successor tenants is steadily rising over time, resulting in a steady increase in profit margins going forward.
OMEGA: Wow! Tenant turnover actually boosts profit margins for TENPO INNOVATION. That point does not appear to be discounted in the current share price. OK, changing the topic again, I am struck by the fact that a Nagoya-based company is your major shareholder. Does that suggest future potential to expand business to the CHUBU and/or KANSAI regions? Please explain the background of CROPS CORPORATION (9428) taking a majority stake in the Company.
SHIMURA: The Nagoya and Tokyo areas were not a factor. CROPS has two business policies, one of which is to be involved in recurring stock business. Second, CROPS itself is in the cell phone sales agency business. It has other group companies in building maintenance, temporary staffing, etc., with a view toward diversifying risk within the business portfolio. TENPO INNOVATION’s recurring stock model from subleasing revenue, and being in the real estate industry, was a good fit for the CROPS group portfolio.
Regarding CHUBU or KANSAI, the answer is no. The simple reason is that the Tokyo market is huge, and there is tremendous upside opportunity from focusing solely on that market. In addition to Tokyo residents eager to open restaurants in Tokyo, there are also many people from rural areas with similar ambitions, and foreign nationals, such as Chinese, Nepalese, etc., now account for roughly 10% of new openings. Our current medium-term strategy is to leave no stone unturned in the attractive Tokyo market. There is still a lot of work to do.
OMEGA: Understood. Finally, you issued a press release on March 24 announcing the establishment of a subsidiary to handle rent guarantee business. Could you give a brief overview of this new business?
SHIMURA: Certainly. Presently, subleasing tenants basically sign a rent guarantee contract with a guarantee company. Until now, we have used an outside guarantee company, but by doing this within our group, we are able to internalize the revenue. We believe that we can adequately control the risk, since the sublease agreement includes a security deposit and a joint guarantor, and we have expertise in credit management and rent collection.
PART ③ EARNINGS
FY3/22 marked a return to double-digit growth in net sales and profits
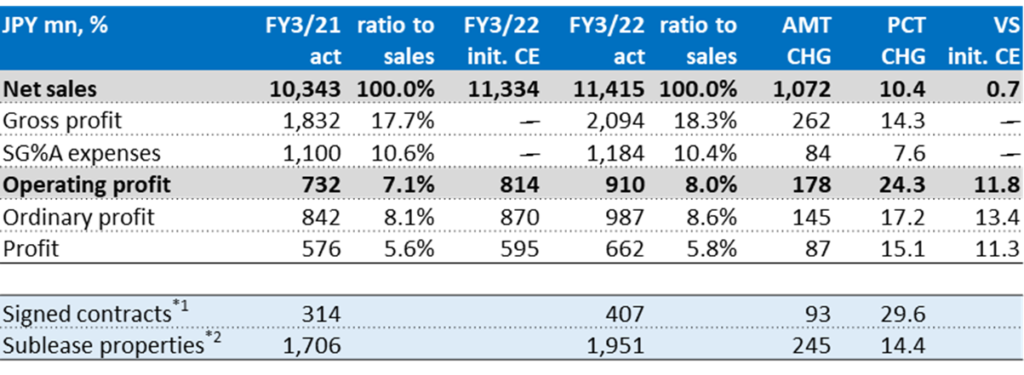
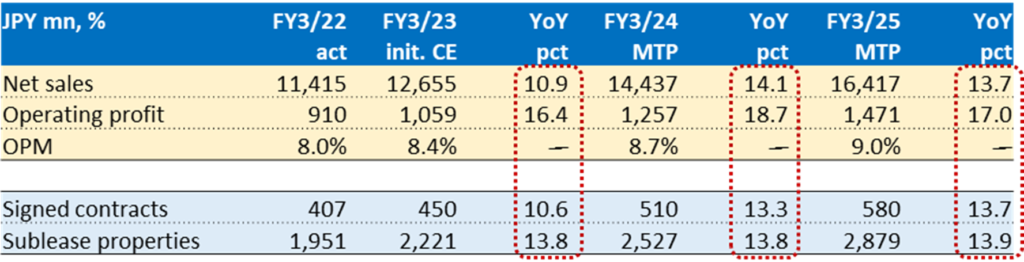
Following the brief slowdown in earnings growth in FY3/21 in the wake of the pandemic, as can be seen in the summary table below, FY3/22 results exceeded initial guidance, with net sales increasing +10.4% YoY and operating profit increasing +24.3%. The number of signed contracts (new contracts + successor contracts) increased from 314 → 407 (+93, +30% YoY), and the number of active subleased properties increased from 1,706 → 1,951 (+246, +14% YoY). The breakdown of signed contracts by quarter was: 1Q 95, 2Q 96, 3Q 104 and 4Q 112, posting a full-fledged return to double-digit growth.
Gross profit increased +14.3% YoY, and GPM improved by 0.6pp from 17.7% → 18.3%. As described earlier, out of an abundance of caution in April 2020 immediately after the global outbreak of COVID-19, the Company gave notice to landlords (owners) on a certain number of leased store properties, and the graph on the bottom of P11 shows the pickup in cancellations in the Jul-Sep quarter of 2020. During FY3/22, the increased cost of sales associated with those cancellations disappeared, resulting in the sharp improvement in GPM. OPM get a further boost from controlling SG&A costs, rising 0.9pp from 7.1% → 8.0%.
TENPO INNOVATION 4Q FY3/22 Results Summary
Source: compiled by Omega Investment from IR results briefing materials.
Trend of Sales Breakdown by Income Category (JPY mn)
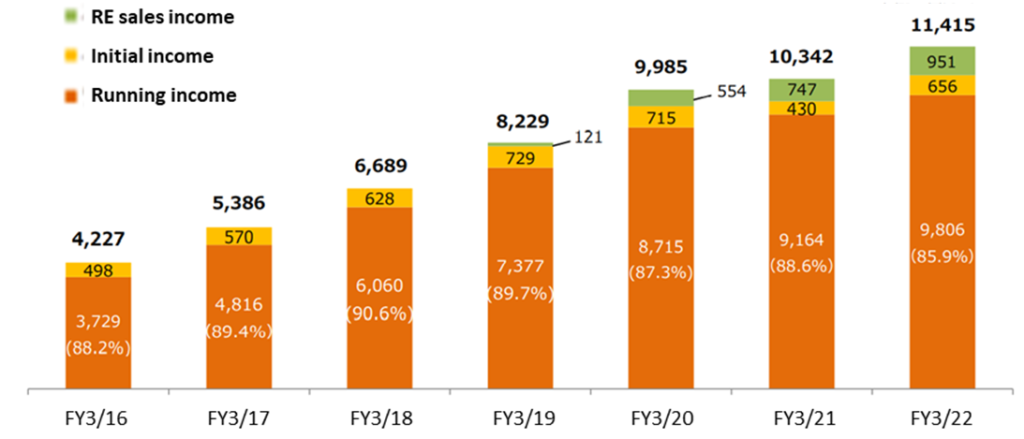
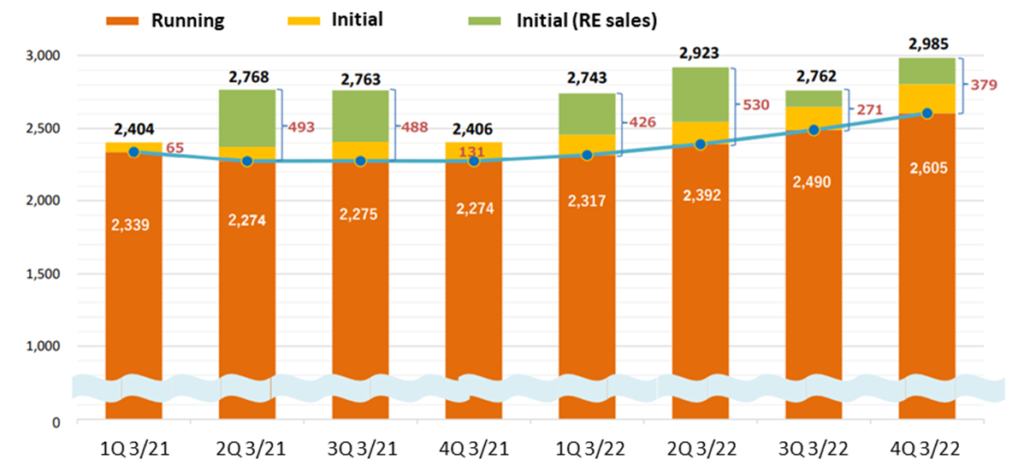
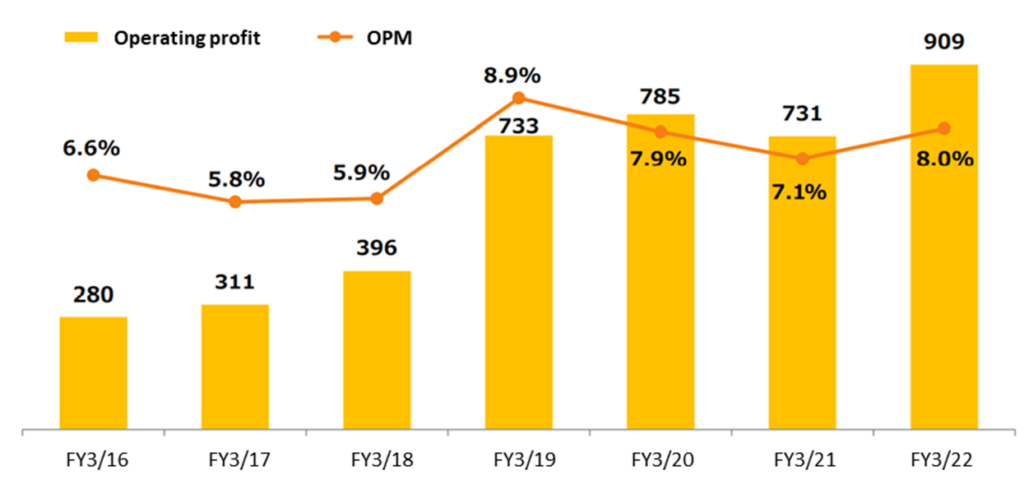
The graph on the bottom of the previous page and the graph below show the trend of sales breakdown by income category. In addition to steady and consistent growth in running income as the number of subleased store properties continues to grow, initial income posted a healthy gain on the sharp recovery in signed contracts, as well as real estate sales making a contribution in every quarter last term. The graph at the bottom of the page shows the trend in operating profit. After the brief dip in FY3/21, operating profit has also achieved a full-fledged recovery to double-digit growth.
The table on the top of the following page summarizes forecasts and operating targets for FY3/23, as well as for the following two fiscal years through FY3/25 in the Company’s Medium-Term Management Plan. A key takeaway from the red dashed box outlines is the Company is targeting double-digit growth in signed contracts, subleased properties, and accordingly in net sales, as well as ongoing OPM improvement, in part driven by the rise in the ratio of successor contracts describer earlier.
Quarterly Trend of Sales Breakdown by Income Category (JPY mn)
Trend of Operating Profit (JPY mn) and OPM
TENPO INNOVATION Medium-Term Management Plan
Priority initiative to strengthen and enhance the sales force
The Company has the following medium-term and long-term targets.
By FY3/25, increase the Sales Dept. from 40 professionals to 100 (currently 14 in charge of property procurement → 30, 26 in charge of finding tenants → 70)
▶Subleased store property net adds to 600 per year (by FY3/26)
▶Contracts signed to 1,000 per year (by FY3/27)
By FY3/29, increase the number of active subleased store properties to 5,500
▶Net sales ¥30 billion
▶Operating profit ¥3 billion
▶OPM 10.0%
As TENPO INNOVATION is the only specialist firm engaged in this restaurant store property subleasing business, this is no easy task, and cannot be accomplished by simply directing a headhunting firm to find the required personnel (they simply do not exist). Management fully recognizes that the way forward is to find suitable personnel and provide advanced level on-the-job training by existing professional staff. The point is that there is a lot of technical background knowledge required about property specifications such as rent, location and facilities (the correct amperage requirements for electricity supply, drainage pipe diameter, etc.).
The Company summarizes its HR strategy for the Sales Dept. in a 3-point plan: ① increase staff, ② provide advanced OTJ training and ③ transfer capable staff to property procurement. Management envisions this extensive training for staff to procure properties to lease for the purpose of subleasing will take one year. Specifically, it will try to develop a standard method of passing on the expert knowledge involving the 237 items/steps from introduction of the property to concluding a subleasing agreement. Then, recognizing that procurement has a high level of difficulty and strategically holds the highest importance to future growth, it will optimize transfer and assignment of capable staff.
Then, in order to achieve the second long-term goal above of increasing the number of active subleased store properties to 5,500 by FY3/29, management will employ a strategy of ④ procurement area focus. Specifically, roughly 30 procurement staff will cover approximately 1,000 station areas and 2,000 real estate agents. For terminal stations with more than 1 million passengers and major real estate agencies, multiple procurement staff will be assigned. The target is to achieve procuring roughly 600 store properties per year (or 50 per month) by FY3/26.
PART ④ SHAREHOLDERS
3Y Share Price Chart and Trend of Valuations
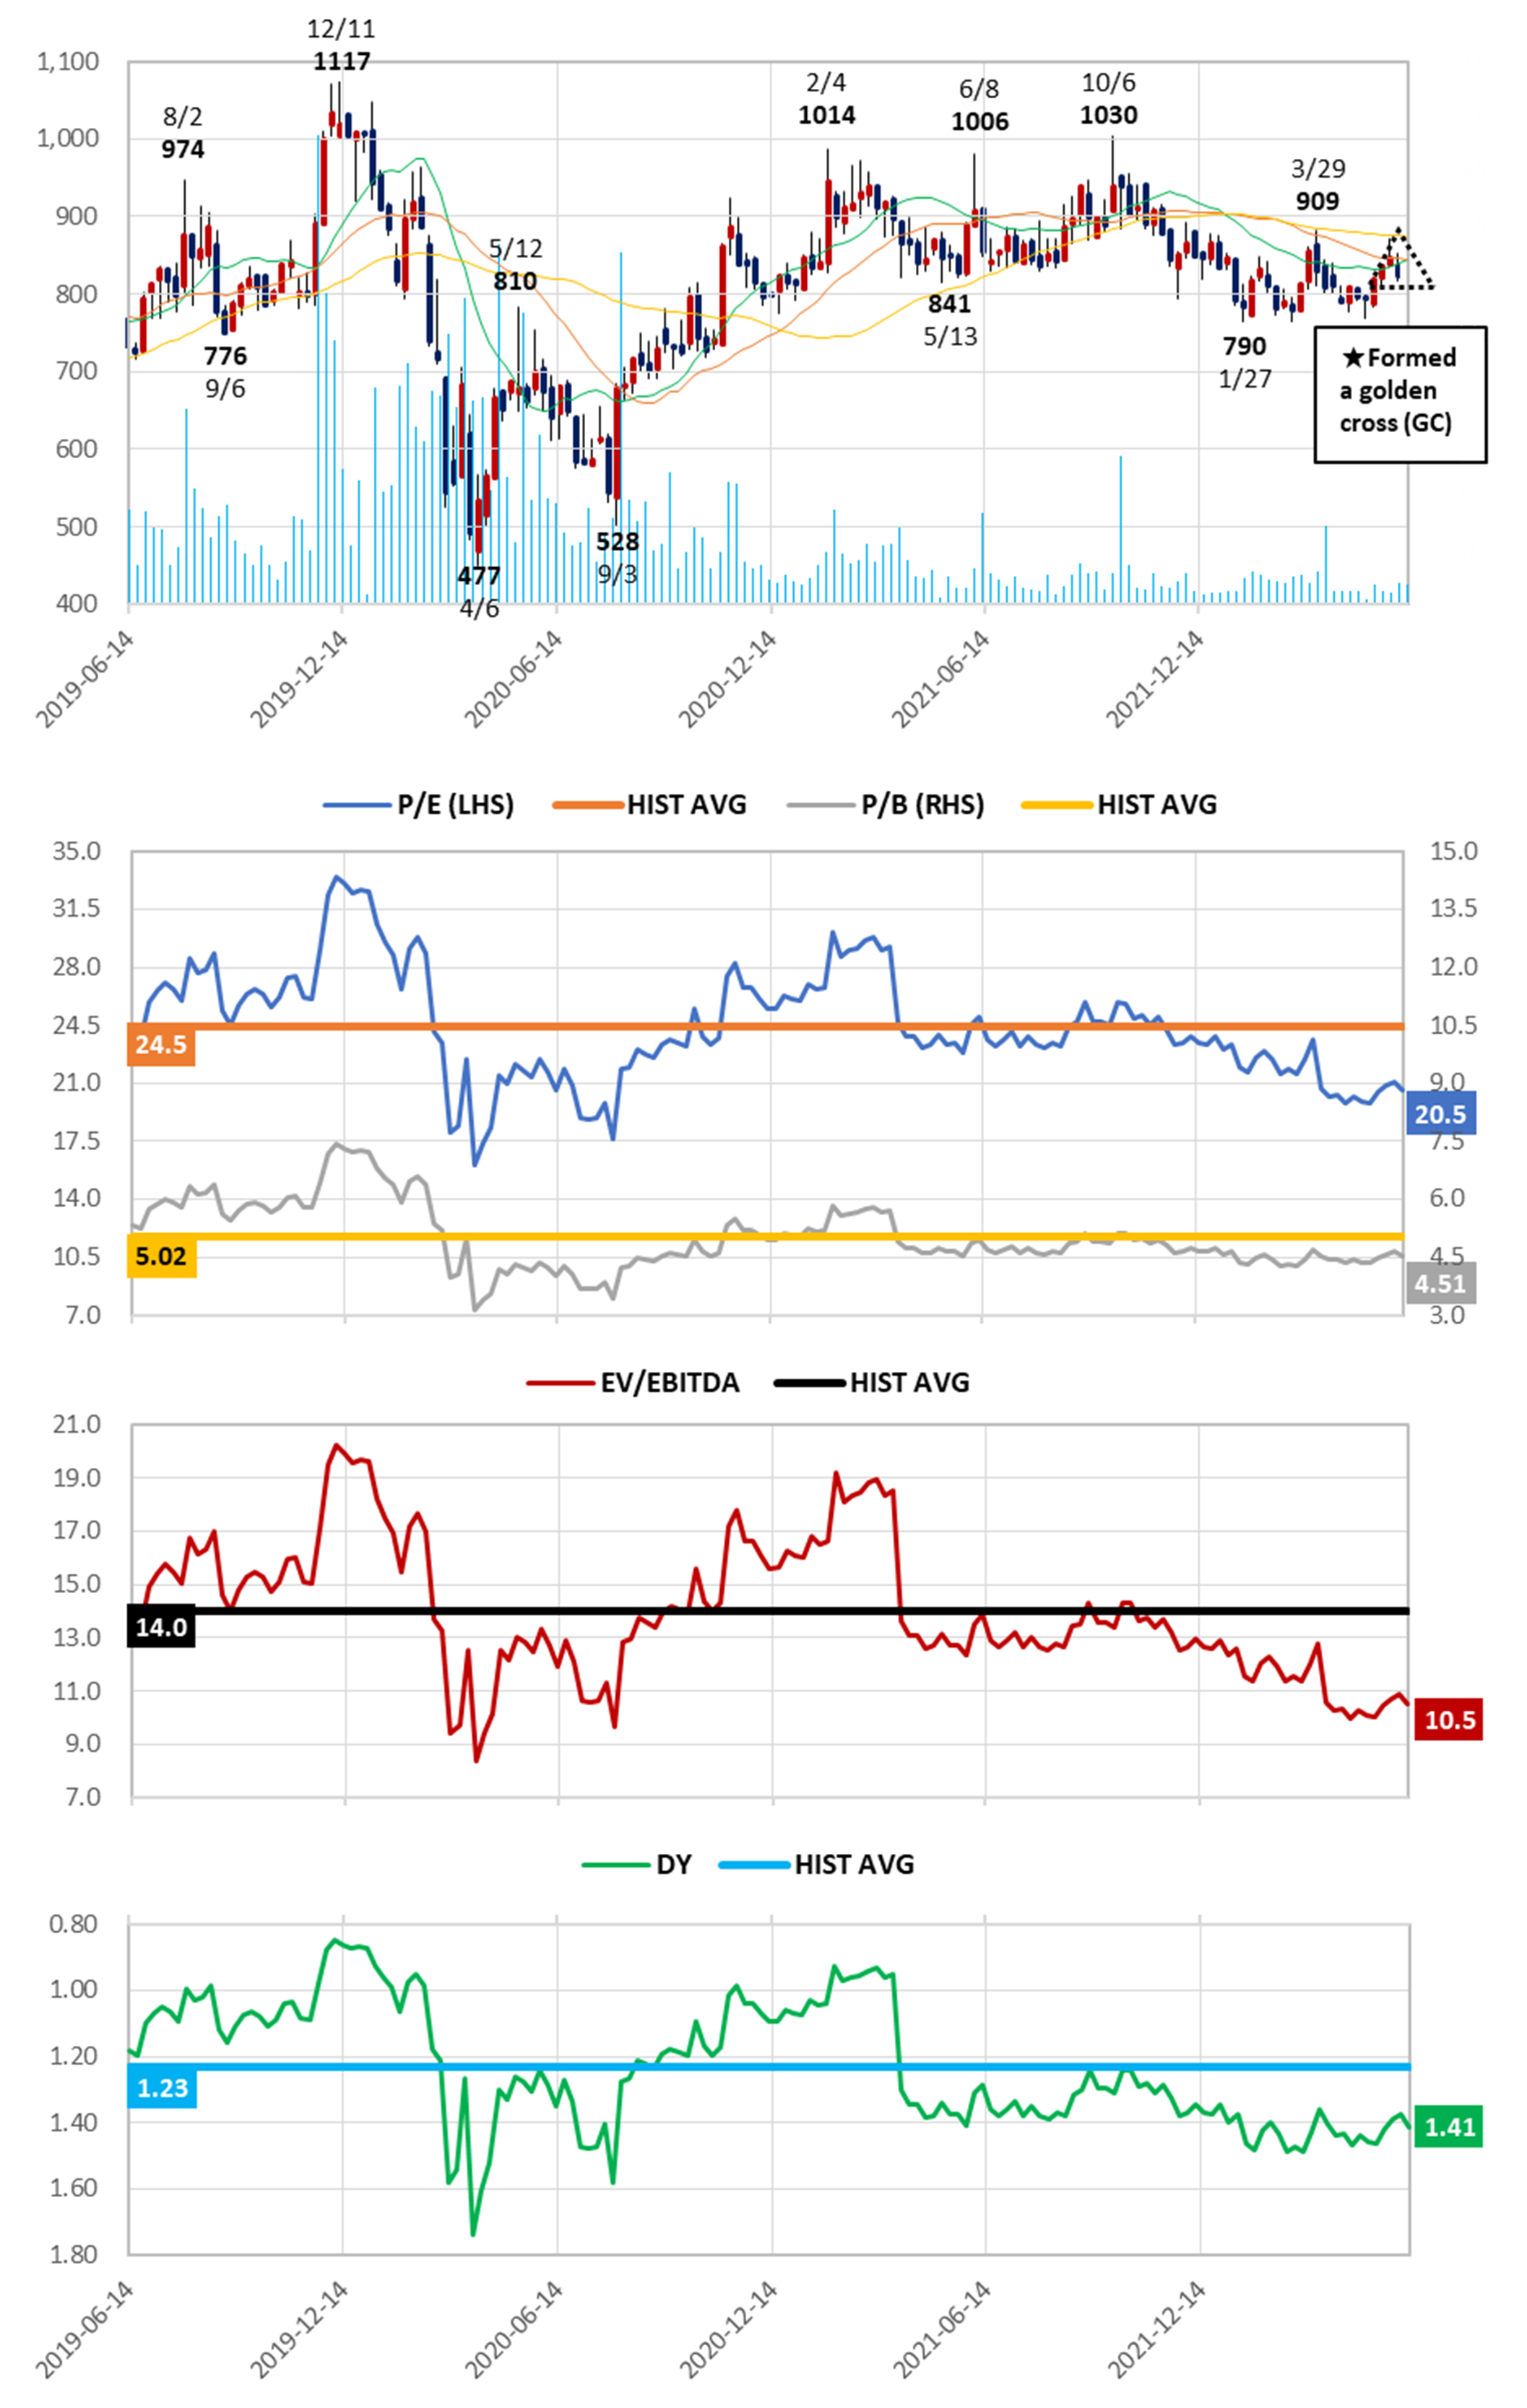
Key takeaways:
❶ The current P/E is trading on a 16% discount and EV/EBITDA is trading on a 25% discount, each to their respective historical averages, reflecting ongoing double-digit growth in earnings.
❷ The equity ratio on the surface may appear low at 28.0%, however this reflects the fact that the B/S is comprised of a large amount of deposits paid and received. The Company is debt-free, and the B/S is extremely healthy.
❸ The company does not disclose initial guidance for the annual dividend, so the lower graph assumes the same dividend as last term of ¥12.00 per share.
❹ On technical indicators, the 13W MA closed above the 26W MA in the week ended June 10, forming a golden cross (GC).
3Y Relative Share Price Performance
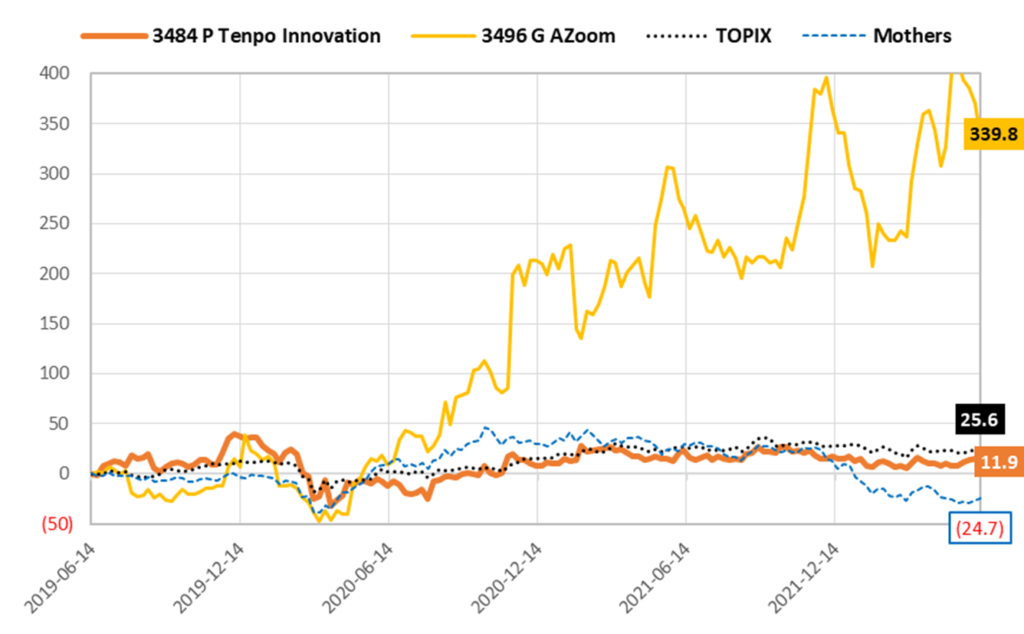
- As described earlier, TENPO INNOVATION operates a unique business model, drawing on its expertise and know-how in handling restaurant store properties, and there are no other competitors involved in the highly specialized market for subleasing vacated-furnished store properties. In that sense, there is no peer available to use for comparison. However, in the course of gathering background information for this report, we identified a company with some similarities in its business model. AZoom Co., Ltd. was established in 2009 in Tokyo, and it also created a recurring stock model in real estate business.
- This company leases vacant parking lots from owners, mainly in office buildings and condominiums for sale buildings in Metropolitan Tokyo, and then subleases them to tenants on monthly contracts. Its portal site “CarParking” is a highly effective tool to find tenants, and it also generates introduction fees to other parking lot operators. The revenue breakdown is roughly 86% for subleasing rent income, and 10% customer introduction fees. AZoom’s results briefing materials present similar graphs with a highly stable growth trend for subleasing contracts. To be fair, top line growth is higher than TENPO INNOVATION, but the subsequent sharp rise in AZoom’s share price has also put valuations at extreme premiums. Specifically, the P/E is trading on 35.6x, and the P/B is on 12.5x!
- To reiterate our thesis (investment opportunity), we believe that TENPO INNOVATION’s share price has been penalized by association with the overall restaurant market, which suffered significant negative impact due to the pandemic, resulting in substantial underperformance of the share price. However, as earnings for TENPO INNOVATION continue to deliver consistent double-digit top line growth, coupled with rising profit margins from the structural improvement factor of the rise in the ratio of successor subleases going forward, undervaluation becomes increasingly more pronounced.
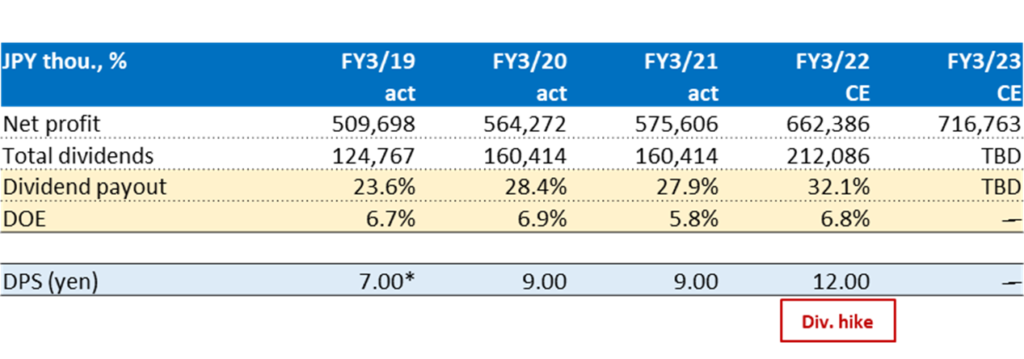
Shareholder Return Policy
The Company’s basic policy is to pay stable dividends while strengthening its management base. The dividend per share (DPS) for the fiscal year ending March 31, 2023 is currently undecided, to be disclosed as soon as it becomes available.
Trend of Dividends Paid and Payout Ratio
Source: compiled by Omega Investment from IR results briefing materials.
*Note: adjusted to reflect the stock split.
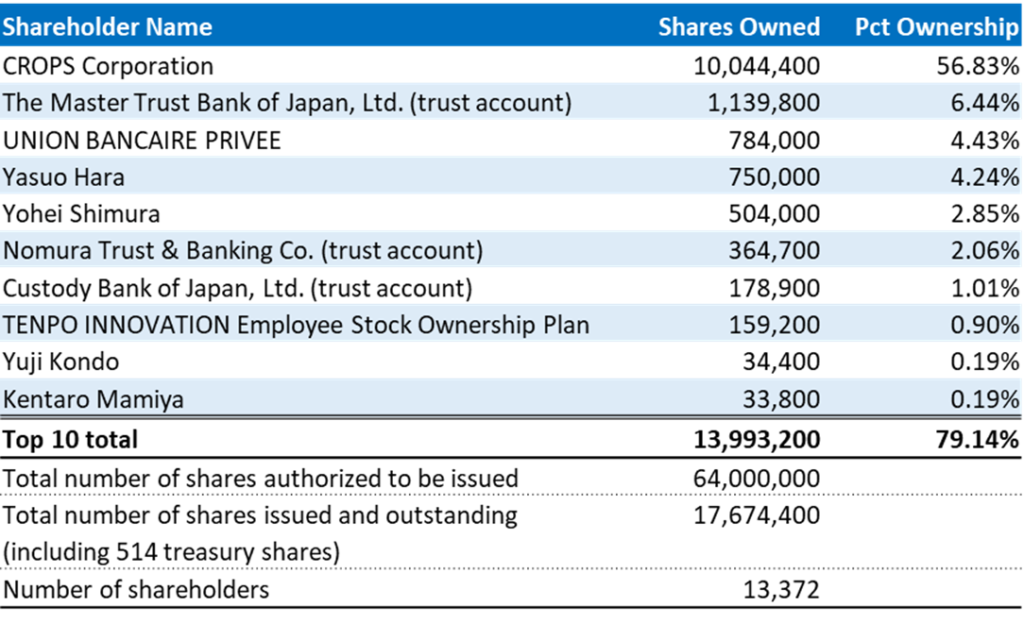
Major Shareholders (as of March 31, 2022)
SUPPLEMENT
Summary of Non-consolidated Financial Results
for the FY Ended March 2022 (J-GAAP)
(→ as reported financial statements)
●Non-consolidated Balance Sheets ①
●Non-consolidated Balance Sheets ②
●Non-consolidated Income Statements
●Non-consolidated Cash Flow Statements
Non-consolidated Balance Sheets ①
| Previous FY end (as of March 31, 2021) |
Current FY end (as of March 31, 2022) |
|
| Assets | ||
| Current assets | ||
| Cash and deposits | 2,908,850 | 3,467,517 |
| Accounts receivable – trade | 26,590 | 7,649 |
| Real estate for sale | 518,715 | 329,732 |
| Supplies | 310 | 7,366 |
| Advance payments to suppliers | 23,064 | 38,267 |
| Prepaid expenses | 826,071 | 953,698 |
| Other | 93,915 | 54,851 |
| Total current assets | 4,397,518 | 4,859,082 |
| Non-current assets | ||
| Property, plant and equipment | ||
| Buildings, net | 285,947 | 681,819 |
| Tools, furniture and fixtures, net | 8,624 | 4,777 |
| Land | 10,352 | 10,352 |
| Construction in progress | 141,111 | ― |
| Total property, plant and equipment | 446,035 | 696,949 |
| Intangible assets | ||
| Software | 14,614 | 9,409 |
| Leasehold interests in land | 17,477 | 16,649 |
| Other | ― | 5,126 |
| Total intangible assets | 32,091 | 31,185 |
| Investments and other assets | ||
| Long-term prepaid expenses | 138,396 | 189,978 |
| Deferred tax assets | 233,019 | 268,620 |
| Guarantee deposits | 5,122,621 | 5,783,811 |
| Other | 58,981 | 68,811 |
| Total investments and other assets | 5,553,017 | 6,311,221 |
| Total non-current assets | 6,031,144 | 7,039,357 |
| Total assets | 10,428,662 | 11,898,440 |
Non-consolidated Balance Sheets ②
| Previous FY end (as of March 31, 2021) |
Current FY end (as of March 31, 2022) |
|||||
| Liabilities | ||||||
| Current liabilities | ||||||
| Accounts payable – other | 112,828 | 107,280 | ||||
| Accrued expenses | 4,431 | 5,248 | ||||
| Income taxes payable | 131,731 | 252,375 | ||||
| Advances received | 42,246 | 52,741 | ||||
| Deposits received | 379,382 | 239,990 | ||||
| Unearned revenue | 1,005,568 | 1,198,323 | ||||
| Provision for bonuses | 32,650 | 53,435 | ||||
| Other | 46,782 | 13,687 | ||||
| Total current liabilities | 1,755,621 | 1,923,082 | ||||
| Non-current Liabilities | ||||||
| Asset retirement obligations | 4,454 | 48,395 | ||||
| Guarantee deposits received | 5,482,052 | 6,308,921 | ||||
| Long-term unearned revenue | 225,240 | 290,074 | ||||
| Total non-current liabilities | 5,711,746 | 6,647,391 | ||||
| Total liabilities | 7,467,368 | 8,570,474 | ||||
| Net assets | ||||||
| Shareholders’ equity | ||||||
| Share capital | 308,394 | 308,394 | ||||
| Capital surplus | ||||||
| Legal capital surplus | 539,930 | 539,930 | ||||
| Total capital surplus | 539,930 | 539,930 | ||||
| Retained earnings | ||||||
| Legal retained earnings | 6,960 | 6,960 | ||||
| Other retained earnings | ||||||
| Retained earnings brought forward | 2,106,391 | 2,473,144 | ||||
| Total retained earnings | 2,113,351 | 2,480,104 | ||||
| Treasury shares | (382) | (463) | ||||
| Total shareholders’ equity | 2,961,294 | 3,327,966 | ||||
| Total net assets | 2,961,294 | 3,327,966 | ||||
| Total liabilities and net assets | 10,428,662 | 11,898,440 | ||||
Non-consolidated Income Statements
Previous Fiscal Year
|
Current Fiscal Year
|
|
| Net sales | 10,342,680 | 11,415,134 |
| Cost of sales | 8,511,065 | 9,321,400 |
| Gross profit | 1,831,615 | 2,093,734 |
| Selling, general and administrative expenses | 1,099,795 | 1,183,880 |
| Operating profit | 731,819 | 909,853 |
| Non-operating income | ||
| Penalty income | 40,319 | 7,047 |
| Compensation income | 91,776 | 139,339 |
| Subsidy income | 33,518 | 38,304 |
| Litigation-related income | 12,745 | 8,313 |
| Other | 979 | 427 |
| Total non-operating income | 179,339 | 193,432 |
| Non-operating expenses | ||
| Compensation expenses | 55,873 | 108,026 |
| Litigation-related expenses | 8,635 | 8,253 |
| Other | 4,935 | 369 |
| Total non-operating expenses | 69,444 | 116,649 |
| Ordinary profit | 841,714 | 986,636 |
| Profit before income taxes | 841,714 | 986,636 |
| Income taxes – current | 244,788 | 359,851 |
| Income taxes – deferred | 21,319 | (35,601) |
| Income taxes | 266,107 | 324,250 |
| Profit | 575,606 | 662,386 |
Non-consolidated Cash Flow Statements
Previous Fiscal Year
|
Current Fiscal Year
|
|
| Cash flows from operating activities | ||
| Profit before income taxes | 841,714 | 986,636 |
| Depreciation | 19,671 | 39,605 |
| Increase (decrease) in provision for bonuses | 3,300 | 20,785 |
| Subsidy income | (33,518) | (38,304) |
| Decrease (increase) in prepaid expenses | 53,231 | (127,626) |
| Decrease (increase) in long-term prepaid expenses | 46,337 | (51,582) |
| Decrease (increase) in guarantee deposits | 105,617 | (661,190) |
| Increase (decrease) in unearned revenue | (67,541) | 192,755 |
| Increase (decrease) in long-term unearned revenue | (50,316) | 64,834 |
| Increase (decrease) in guarantee deposits received | (99,842) | 826,869 |
| Decrease (increase) in inventories | 131,934 | 181,927 |
| Other | (38,997) | (103,841) |
| Subtotal | 911,590 | 1,330,867 |
| Income taxes paid | (279,063) | (245,334) |
| Subsidies received | 33,518 | 38,304 |
| Other | 21 | 24 |
| Net cash provided by (used in) operating activities | 666,067 | 1,123,862 |
| Cash flows from investing activities | ||
| Purchase of property, plant and equipment | (128,320) | (256,565) |
| Purchase of intangible assets | (1,750) | (3,085) |
| Purchase of insurance funds | (9,830) | (9,830) |
| Net cash provided by (used in) investing activities | (139,900) | (269,480) |
| Cash flows from financing activities | ||
| Purchase of treasury shares | ― | (135,300) |
| Dividends paid | (160,414) | (160,414) |
| Net cash provided by (used in) financing activities | (160,414) | (295,714) |
| Net increase (decrease) in cash and cash equivalents | 365,752 | 558,666 |
| Cash and cash equivalents at beginning of period | 2,543,098 | 2,908,850 |
| Cash and cash equivalents at end of period | 2,908,850 | 3,467,517 |