2026-07-09
Home
Japanese

Omega Investment Co., Ltd.
Chiome Bioscience (Investment report – Basic)
| Share price (6/16) | ¥68 | Dividend Yield (26/12 CE) | – % |
| 52weeks high/low | ¥66/161 | ROE(25/12 act) | -65.1 % |
| Avg Vol (3 month) | 642.1 thou shrs | Operating margin (TTM) | -165.1 % |
| Market Cap | ¥5.07 bn | Beta (5Y Monthly) | 0.4 |
| Enterprise Value | ¥3.96 bn | Shares Outstanding | 74.659 mn shrs |
| PER (26/12 CE) | – X | Listed market | TSE Growth |
| PBR (25/12 act) | 3.8 X |
| Click here for the PDF version of this page |
| PDF version |
Share price decline has improved risk-reward. Shift to slightly bullish while assessing supply-demand risk.
Investment conclusion
Share price decline has improved risk-reward. Shift to slightly bullish while assessing supply-demand risk
Chiome Bioscience Inc. (the “Company”) has strengthened its basic stance on the Company’s shares by one notch from “neutral to slightly bullish” at the time of the previous 4Q update to “slightly bullish.” The basis for this judgment lies in the relationship between the share price level and fundamentals. Since the previous update, the share price has declined significantly, while no major deterioration in fundamentals was confirmed in the Q1 FY12/2026 results announced on May 14. Rather, net sales in the drug discovery support business increased year-on-year, and the operating loss narrowed. Business progress related to CBA-1205, CBA-1535, IDD, and biosimilars is also continuing, and the argument behind the previous judgment—that “visualization of earnings from drug discovery is the turning point for the share price”—has not broken down. In the previous update as well, visualization of earnings from drug discovery, monetization of IDD projects, and a slowdown in cash consumption were identified as the turning points for the share price.
The Company states its mission as “Shine light on unmet needs. Bring a brighter future to patients.” and is a biotech venture that generates antibody drug development candidates to address unmet needs. The Company positions the drug discovery & development business as the “source of growth,” the drug discovery support business as “securing stable revenue,” and IDD as “expanding business opportunities,” and aims to increase corporate value through a “sustainable growth model based on a three-layer portfolio” that organically connects people, goods, money, and information both inside and outside the Company. This explanation by the Company is also easy for investors to understand regarding the Company’s current position. The drug discovery & development business is a high-risk, high-return source of growth that aims to obtain upfront payments, milestones, and royalties through the conclusion of out-licensing agreements, centered on CBA-1205 and CBA-1535. The drug discovery support business is a “high-value-added contract research business” that provides antibody generation, antibody engineering, and protein preparation and is a source of cash flow generation that earns revenue in a short period of time. IDD is a medium-risk, medium-return growth area that leverages the Company’s technological and drug discovery capabilities in antibody drug discovery and expands business opportunities into exploratory research, clinical development, and biosimilar development.
In FY12/2025, the Company recorded net sales of 593 million yen, an operating loss of 979 million yen, and a net loss of 982 million yen. The upfront payment from the PFKR license agreement booked in the previous fiscal year was absent in the current fiscal year, and net sales declined year on year, but this was due to a reduction in upfront income and does not need to be causally linked to a deterioration in underlying earning power. Rather, the points that should be watched are that net sales in the drug discovery support business were 593 million yen, exceeding the Company’s plan of 500 million yen; R&D expenses decreased from 936 million yen to 776 million yen, and the operating loss narrowed from 1.030 billion yen in the previous fiscal year to 979 million yen. The drug discovery support business secured a segment profit of 356 million yen, while the drug discovery & development business recorded a segment loss of 777 million yen. In other words, the structure in which drug discovery support earns profit and drug discovery & development invests was confirmed. In the most recent 4Q update, it was also emphasized that FY12/2025 saw a decline in sales due to a reaction-driven decrease in upfront income, while R&D expenses were contained and the loss narrowed.
In Q1 FY12/2026, net sales were 147 million yen, the operating loss was 232 million yen, the ordinary loss was 232 million yen, and the net loss was 233 million yen. Year on year, net sales increased from 138 million yen to 147 million yen, and the operating loss narrowed from 264 million yen to 232 million yen. R&D expenses decreased from 203 million yen to 174 million yen, and declines in clinical development-related and other expenses contributed to the improvement in earnings. Cash and deposits decreased from 1.205 billion yen at the end of FY12/2025 to 1.141 billion yen at the end of Q1 FY12/2026, but net assets increased from 1.122 billion yen to 1.311 billion yen. At present, while cash consumption continues, cost control and capital reinforcement through the exercise of stock acquisition rights are progressing simultaneously.
On the other hand, the decline in the share price has reduced the valuation risk borne by investors. At the time of the previous 4Q update, the continued high PBR despite the loss-making phase and supply-demand pressure from the exercise and sale of stock acquisition rights, with Growth Capital as the scheduled allottee, were recognized as factors capping the upside. However, as the share price has corrected at present, expectations for the same business progress have declined, and the upside room if out-licensing, formation of IDD projects, and accumulation of drug discovery support sales are confirmed has become relatively larger. Therefore, rather than mechanically maintaining the same “neutral to slightly bullish” stance as before, we believe it is appropriate to reflect the change in the share price level and tilt the investment conclusion toward “slightly bullish.”
However, this judgment does not downplay supply–demand risk. Since the Company issued the 23rd series of stock acquisition rights with a price-adjustment clause in November 2025, with Growth Capital as the scheduled allottee, an increase in supply through exercise and sale has tended to be perceived during phases of share price increases. In the most recent 4Q update, it was stated that the scheduled allottee would repeatedly recover funds by selling the shares acquired through exercise, and this was summarized as a structure in which the higher the share price rises, the more additional supply is likely to be perceived. This supply-demand factor tends to cap the upside during short-term rebound phases. Accordingly, in terms of investment behavior, rather than chasing the upside based only on the story, a realistic stance is to gradually raise the evaluation while taking into account the improved risk-reward resulting from the share price decline and confirming out-licensing, joint development, monetization of IDD projects, progress toward 600 million yen in drug discovery support sales, and a slowdown in cash consumption.
The Company’s shares are not a stable growth stock for which a return to profitability is already visible, but an event-driven stock for which the valuation rises while confirming visualization of earnings from drug discovery and the buildup of drug discovery support and IDD. Looking at market indicators, including an actual PBR of 5.13x, profitability expectations are reflected in the share price to some extent. However, the decline in the share price after the previous update has improved the expected return relative to the same fundamentals. If disclosures appear in drug discovery from which earnings terms and timing of recognition can be read, the share price evaluation will rise by one notch. On the other hand, while disclosures remain limited to progress reports and the weight on supply and demand remains, the share price is likely to move within a range. We see the current phase as one in which the attractiveness of the share price level has increased compared with the previous report, and in which, if supply-demand digestion and visualization of earnings progress, an upward revision to the share price range can be expected.
1. Company overview and business structure
A biotech venture that combines drug discovery & development, drug discovery support, and IDD, with an antibody creation platform at its core
The Company is an antibody drug discovery venture established in February 2005 and listed on the TSE Growth Market in December 2011. It has its head office and technology research laboratory in Shibuya-ku, Tokyo, and its drug discovery research laboratory in Kawasaki City, Kanagawa Prefecture, and has 64 employees. Its business activities are research and development of antibody drugs and related operations, and the Company can be positioned as “Biotech company dedicating to satisfy unmet medical needs.” Its mission is “Shine light on unmet needs. Bring a brighter future to patients,” and its vision is “To become the No. 1 biotech venture that discovers and develops antibody drug candidates for unmet medical needs.”
The Company’s characteristic is not merely being an R&D-type biotech venture, but rather that it uses its antibody drug discovery platform to combine three businesses: drug discovery & development, drug discovery support, and IDD. The Company defines its core competence as “Chiome’s mAb Discovery Engine”. It summarizes “Chiome’s drug discovery capability” as “ability to identify promising products × practical capability to complete the process from research to entering clinical trials as quickly and directly as possible.” This means the practical capability to integrate, despite being a small organization, antibody generation, antibody functional modification, affinity maturation, protein preparation, nonclinical studies, bio-CMC development, drug substance manufacturing, investigational drug manufacturing, clinical trial operations, and clinical development project management functions in an end-to-end manner. In the upstream processes from drug discovery research to clinical development, the Company has an agile R&D structure unique to a venture company, and its basic stance is to make efficient investment decisions with minimal person-hours and funds, aiming for maximum returns.
As its technological base, the ADLib® system, Tribody®, and DoppeLib are important. The ADLib® system is a technology that generates human antibodies in vitro without the use of living organisms. It can obtain human antibodies in a short period of time and, unlike animal immunization methods, is less susceptible to immune tolerance. Another feature is that, by using autonomous gene diversification, it can continuously increase antibody affinity. Tribody® is a multispecific antibody technology that provides three binding sites in a single molecule and enables combinations of distinct functions. CBA-1535 is a clinical development product using this Tribody® and is part of a pipeline the Company positions as entering clinical development as a world-first drug discovery modality. DoppeLib is a bispecific antibody generation technology that uses the ADLib® system, and its development is progressing as a cell-surface display technology for evaluating many samples at high speed. It is positioned as an important technology for the future of the IDD business, and collaborations with multiple companies are underway.
The Company’s business segments are the “drug discovery & development business” and the “drug discovery support business.” The drug discovery & development business conducts in-house or joint development of antibody drugs in disease areas with high unmet medical needs, licenses patents and other rights related to the resulting antibodies to pharmaceutical companies and others, and receives upfront payments, milestones, royalties, and other income. The Company positions this as a “business responsible for growth.” On the other hand, the drug discovery support business supports drug discovery research conducted by pharmaceutical companies, diagnostic drug companies, universities, and other research institutions, and earns service fees and other income. It is a “high-value-added contract research business” that provides antibody generation, antibody engineering, and protein preparation using the Company’s antibody drug discovery technology platform, mainly to major domestic pharmaceutical companies, and the Company positions this as a “business that secures stable revenue.”
In addition, the Company is developing IDD as a third pillar. IDD is a drug discovery platform provision business that leverages the Company’s technological and antibody drug discovery capabilities to promote biologics drug discovery by pharmaceutical companies and drug discovery startups. The targets range widely, from exploratory research and clinical development to biosimilar development, and the contract forms are flexibly designed, from consignment/outsourcing agreements to joint research and development agreements. The Company explains that the consignment/outsourcing type contributes to financial stability, while the joint research and development type contributes to future earnings and corporate value. From an investor’s perspective, IDD is an area for expanding business opportunities that is positioned between the one-shot earnings of the drug discovery & development business and the stable revenue of the drug discovery support business.
How to view this business structure is the starting point for evaluating the Company’s shares. Looking only at the drug discovery & development business, the Company is a biotech venture that is loss-making up front and awaiting out-licensing events. However, as the drug discovery support business generates net sales and segment profit, and IDD expands into external projects and the biosimilar field, the Company is evolving into a company that deploys its antibody drug discovery platform across multiple revenue models. Nevertheless, at present, the sales scale of drug discovery support remains around 600 million yen. It has not reached the point of fully absorbing the R&D expenses of the drug discovery & development business. Therefore, a full-fledged increase in corporate value requires out-licensing revenue in drug discovery, formation of IDD projects, and continuous upside in drug discovery support.
2. Business strengths
Drug discovery capability in upstream processes that combines the ability to identify promising products and the practical capability to complete the process from research to entering clinical trials
The Company’s strength lies not only in technologies for creating antibodies themselves but also in the practical capability to identify promising leads, generate antibody candidates, and complete the process through nonclinical studies, CMC, and entry into clinical trials. As the Company describes it, “ability to identify promising products × practical capability to complete the process from research to entering clinical trials as quickly and directly as possible,” the Company’s value lies not only in finding candidate substances at an early stage of R&D, but also in the ability to prepare data and development packages in a form that can withstand out-licensing to pharmaceutical companies and others or joint development.
This point is important in evaluating a drug discovery venture. In biotech ventures, even with excellent targets or antibody candidates, if CMC, manufacturing, nonclinical studies, clinical trial design, and intellectual property strategies are weak, the projects tend to become difficult for pharmaceutical companies to in-license. In addition to antibody generation technologies such as ADLib®, Tribody®, and DoppeLib, the Company organizes, through internal and external networks, clinical trial notification and clinical development practices, drug substance and investigational drug manufacturing, and patent strategy. This means that the Company has a “bridging function” that advances drug discovery projects to a stage where pharmaceutical companies can evaluate them, rather than being merely a technology venture.
In the drug discovery & development business, CBA-1205 and CBA-1535 are the core. CBA-1205 is an antibody with enhanced ADCC activity that targets DLK1, and development is progressing in refractory cancers, particularly hepatocellular carcinoma, melanoma, pediatric cancer, and other cancers. The Company is developing CBA-1205 as a cancer therapeutic antibody that recognizes and attacks the protein DLK1, which is specific to hepatocellular carcinoma and other cancers. In the first part, high safety was confirmed at doses up to 30 mg/kg, and an SD evaluation accompanied by tumor shrinkage in a melanoma patient has continued for more than four years. In the latter part, PR, namely tumor shrinkage of 30% or more, has been confirmed in a hepatocellular carcinoma patient in whom DLK1 expression was confirmed. In Q1 FY12/2026, enrollment of patients with hepatocellular carcinoma and melanoma was completed, and evaluation of continuing-dosing cases and data analysis are underway. In addition, based on joint research with IGTP in Europe, the pediatric cancer part is being promoted, and a high expression rate of DLK1 has been confirmed at present. Furthermore, the Company has also received a notice of allowance for a European patent regarding the combination of CBA-1205 and lenvatinib.
The significance of the investment in CBA-1205 lies not simply in the clinical trial progressing. It lies in the fact that, through multiple parts—hepatocellular carcinoma, melanoma, and pediatric cancer—it is evolving into a program aimed at maximizing product value and consideration upon out-licensing. By combining hepatocellular carcinoma, melanoma, and pediatric solid tumors, the Company aims to maximize product value and improve the economic terms upon out-licensing. In other words, CBA-1205 is moving from initial safety confirmation to the stage of creating a depth of data that can be used in out-licensing negotiations. Future KPIs include evaluation of ongoing dosing cases, data analysis results, DLK1 expression rate, confirmation of additional responses or long-term SD, and developments in intellectual property and clinical development, including combination with lenvatinib.
CBA-1535 is a Tribody®-type T cell engager that targets 5T4 × CD3 × 5T4 and is a clinical pipeline representative of the Company’s technological base. 5T4 is a cancer antigen expressed in multiple solid tumors, and CD3 is a protein on T cells. CBA-1535 exerts cytotoxic activity by bringing cancer cells and T cells into proximity and inducing T cell proliferation and activation. The assumed target indications are malignant mesothelioma, small-cell lung cancer, non-small-cell lung cancer, triple-negative breast cancer, and other cancers.
The Phase 1 clinical study of CBA-1535 is designed to evaluate safety and tolerability as monotherapy in patients with solid tumors in the first part, and to evaluate the combination with cancer immunotherapy drugs in the latter part. The Company states that, at present, responses are beginning to be seen in parameters indicating T cell activation, that only minor adverse reactions have been observed, and that there are no safety data indicating development concerns. Furthermore, with a view to the possibility of out-licensing based solely on data from the monotherapy component, the Company plans to extend the monotherapy component and expand the data.
The investment focus for CBA-1535 is whether, amid intensifying competition in the T cell engager field for solid tumors, the Company can increase the probability of successful development of this drug through early licensing to a company with strong development funding capabilities. Whereas CBA-1205 is a program aimed at maximizing product value and consideration upon out-licensing, CBA-1535 is positioned as a program aimed at out-licensing based on monotherapy data. Therefore, the KPIs for CBA-1535 are progress in dose escalation, safety, tolerability, biomarkers indicating T cell activation, and early pharmacodynamic signals. In particular, whether safety and signals are confirmed in high-dose evaluation after protocol revision will affect the reality of out-licensing negotiations.
The strength of the drug discovery support business lies in its transaction base with pharmaceutical companies and others. Major customers include CHUGAI PHARMACEUTICAL, Chugai Pharmabody Research, Mitsubishi Tanabe Pharma, ONO PHARMACEUTICAL, Kyowa Kirin, and Takeda Pharmaceutical, and sales alliances include Merck and FUJIFILM Wako Pure Chemical. This indicates that the Company’s antibody generation technology platform has practical value for external customers. The drug discovery support business does not fluctuate significantly due to a single out-licensing event, unlike the drug discovery & development business. However, it serves as a support base for R&D investment through stable sales and a high segment profit margin.
The strength of IDD is that the Company can deploy its drug discovery capabilities to external projects. In Q1 FY12/2026, the Company advanced clinical development consulting for drug discovery conducted by biotech ventures and science support for startups through collaboration with Axcelead Drug Discovery Partners. Consultations on science support before and after the establishment of biotech ventures have also increased. Furthermore, the Company has built high-throughput screening technology for bispecific antibodies using DoppeLib and is collaborating with multiple companies. Discussions are also progressing with potential new partners for biosimilar development, and revenue from biosimilars under joint development is booked in the drug discovery support business.
The Company’s businesses should be viewed as a structure in which drug discovery & development, drug discovery support, and IDD each contribute to corporate value in different ways. The drug discovery & development business can significantly drive corporate value the moment out-licensing terms become visible. The drug discovery support business maintains a stable revenue of around 600 million yen. IDD expands medium-term business opportunities through joint research, clinical development support, biosimilars, and external deployment of DoppeLib. If these three progress simultaneously, the Company will move closer to becoming a company that deploys its antibody drug discovery platform across multiple revenue models, rather than a biotech venture dependent only on one-off clinical events.
3. Earnings analysis
Sales declined in 2025 due to a reaction-driven decrease in upfront income, while drug discovery support exceeded plan. Loss narrowing continued in Q1 FY12/2026
The combination of the reactionary decrease in upfront income and expense containment can explain the earnings results for FY12/2025. Net sales decreased to 593 million yen from 781 million yen in the previous fiscal year. However, the upfront payment under the PFKR license agreement, booked in the previous fiscal year, was absent in the current fiscal year, resulting in a decline in sales. Meanwhile, net sales in the drug discovery support business were 593 million yen, exceeding the Company’s plan of 500 million yen by 93 million yen. Revenue recognition from biosimilars was the upside factor, and the Company’s underlying earnings did not deteriorate.
On the profit-and-loss side, the operating loss narrowed to 979 million yen from 1.030 billion yen in the previous fiscal year. R&D expenses decreased to 776 million yen from 936 million yen in the previous fiscal year, reflecting a decline in booked costs, such as manufacturing expenses for clinical trial drugs. For companies whose sales are easily affected by upfront payments, what should be monitored is not only the ups and downs of sales but also whether expenses and cash consumption are being controlled. In this respect, FY12/2025 was a fiscal year in which defensive management functioned to a certain extent due to the upside in drug discovery support and the restraint of R&D expenses.
By segment, external sales in the drug discovery & development business were 0 million yen, and in the drug discovery support business, 593 million yen. In terms of profit, the drug discovery support business secured a segment profit of 356 million yen, while the drug discovery & development business recorded a segment loss of 777 million yen. This directly reflects the Company’s business structure in which the drug discovery support business earns profit, and the drug discovery & development business invests. Revenue recognition in drug discovery support consisted of 190 million yen in goods or services transferred at a point in time and 403 million yen in goods or services transferred over time, with a mixture of delivery-type and recurring-type businesses. The fact that recurring-type sales have a certain scale is a factor for evaluating the stability of drug discovery support. In the most recent 4Q update, the structure in which drug discovery support earns substantially all sales and drug discovery & development is at a front-loaded investment stage toward out-licensing was also shown.
On the other hand, a sense of tension regarding cash management remains. Cash and cash equivalents at the end of FY12/2025 were 1.205 billion yen, a decrease of 858 million yen from the end of the previous fiscal year. Operating cash flow was negative 936 million yen, and the structure in which funds continue to decline even while losses narrow has not changed. As a drug discovery venture, it is natural for R&D investment to precede revenue, but as long as cash consumption continues, the equity market is likely to be conscious of either out-licensing or financing. The issuance of the 23rd series of stock acquisition rights in November 2025 also needs to be viewed in this context.
In Q1 FY12/2026, net sales were 147 million yen, the operating loss was 232 million yen, and the net loss was 233 million yen. Compared with the same period of the previous year, net sales increased from 138 million yen to 147 million yen, and the operating loss narrowed from 264 million yen to 232 million yen. Net sales were entirely attributable to the drug discovery support business, with no sales booked in the drug discovery & development business. Cost of sales and SG&A expenses decreased from 403 million yen to 379 million yen, and R&D expenses decreased from 203 million yen to 174 million yen. Due to a decrease in clinical development-related expenses, the loss narrowed year-on-year.
On the balance sheet, cash and deposits at the end of Q1 FY12/2026 were 1.141 billion yen, down from 1.205 billion yen at the end of FY12/2025. Total assets were 1.670 billion yen, and net assets were 1.311 billion yen, up from the end of the previous fiscal year. This appears to include the impact of capital reinforcement through the exercise of stock acquisition rights, as well as other factors. Financially, a decrease in cash and deposits and an increase in net assets are occurring simultaneously, and the structure in which negative operating cash flow is covered by capital financing continues. This has both positive and negative aspects for the evaluation of the share price. It is positive in securing the funds necessary to continue R&D, but dilution and supply-demand pressure cap the upside in the share price.
The Company’s disclosure for FY12/2026 consists only of net sales of 600 million yen for the drug discovery support business, and company-wide net sales and profit forecasts, including the drug discovery & development business, have not been announced. The Company takes the position that it is currently difficult to reasonably estimate business forecasts for the drug discovery & development business. The 600 million yen in drug discovery support sales is essentially a plan to maintain the 2025 level of 593 million yen and add slightly to it. What is important is not simply whether the Company reaches 600 million yen, but whether biosimilar-related revenue, which was the upside factor in 2025, is reproduced in 2026, how much recurring-type sales accumulate, and at what timing during the year projects booked at a point in time occur.
The conditions under which the market will next change its evaluation on the earnings side are, first, that restraint on R&D expenses continues and is not one-off; second, that upside in drug discovery support or a higher probability of achieving the 600 million yen plan becomes apparent; and third, that disclosures appear in the drug discovery & development business from which earnings terms and timing of recognition can be read. At present, the results are a good start in terms of narrowing losses, but they have not yet reached the level of earnings visibility that would push the share price above the current level.
4. Progress in pipelines and IDD
CBA-1205 focuses on maximizing product value, and CBA-1535 focuses on out-licensing potential based on monotherapy data
CBA-1205 is the core of the Company’s in-house development pipeline. It is an ADCC-enhanced antibody that targets DLK1 and is being developed as a cancer therapeutic antibody that recognizes and attacks the protein DLK1, which is specific to hepatocellular carcinoma and other cancers. DLK1 regulates the proliferation and differentiation of immature cells, such as stem and progenitor cells, and is expressed in some refractory cancers, including hepatocellular carcinoma. By targeting this DLK1, CBA-1205 pursues new therapeutic possibilities in cancer areas with high unmet medical needs.
In clinical development, in the first part, the Company administered the drug stepwise, starting at low doses in patients with solid tumors, and sought the maximum dose that could be administered safely. The Company states that high safety has been confirmed at doses up to 30 mg/kg, and that an SD evaluation, accompanied by tumor shrinkage in a melanoma patient, has continued for more than 4 years. In the latter part, the Company confirms the optimal dose identified in clinical trials for patients with hepatocellular carcinoma and evaluates safety and early pharmacodynamic signals. Confirmation of a PR case in a hepatocellular carcinoma patient with confirmed DLK1 expression is important data for the Company.
In Q1 FY12/2026, enrollment of patients with hepatocellular carcinoma and melanoma was completed, and evaluation of continuing-dosing cases and data analysis are underway. The pediatric cancer part is also being promoted, and a high DLK1 expression rate has been confirmed at present. Furthermore, the Company has received a notice of allowance for a European patent regarding the combination of CBA-1205 and lenvatinib. For investors, the evaluation axis for CBA-1205 must shift from confirmation of monotherapy safety to indication expansion, combination potential, and improved out-licensing terms. The Company positions CBA-1205 as a “program aimed at maximizing product value and consideration upon out-licensing,” and a structure is evident that aims to improve the economic terms upon out-licensing by combining hepatocellular carcinoma, melanoma, and pediatric solid tumors.
CBA-1535 is a Tribody®-type T cell engager that targets 5T4 × CD3 × 5T4 and is a clinical pipeline representative of the Company’s technological base. 5T4 is a cancer antigen expressed in multiple solid tumors, and CD3 is a protein on T cells. CBA-1535 exerts cytotoxic activity by bringing cancer cells and T cells into proximity and inducing T cell proliferation and activation. The assumed target indications are malignant mesothelioma, small-cell lung cancer, non-small-cell lung cancer, triple-negative breast cancer, and other cancers.
The Phase 1 clinical study of CBA-1535 is designed to evaluate safety and tolerability as monotherapy in patients with solid tumors in the first part, and to evaluate the combination with cancer immunotherapy drugs in the latter part. The Company states that, at present, responses are beginning to be seen in parameters indicating T cell activation, that only minor adverse reactions have been observed, and that there are no safety data indicating development concerns. Furthermore, with a view to the possibility of out-licensing based solely on data from the monotherapy component, the Company plans to extend the monotherapy component and expand the data.
The investment focus for CBA-1535 is whether, amid intensifying competition in the T cell engager field for solid tumors, the Company can increase the probability of successful development of this drug through early licensing to a company with strong development funding capabilities. Whereas CBA-1205 is a program aimed at maximizing product value and consideration upon out-licensing, CBA-1535 is positioned as a program aimed at out-licensing based on monotherapy data. Therefore, the KPIs for CBA-1535 are progress in dose escalation, safety, tolerability, biomarkers indicating T cell activation, and early pharmacodynamic signals. In particular, whether safety and signals are confirmed in high-dose evaluation after protocol revision will affect the reality of out-licensing negotiations.
PFKR is a pipeline targeting CX3CR1 for autoimmune neurological diseases and other conditions and was out-licensed in November 2024 to Asahi Kasei Pharma, now Asahi Kasei Therapeutics. This is important as an achievement demonstrating that the Company’s antibody drug discovery capabilities have been externally validated. The upfront payment for PFKR itself contributed to sales in FY12/2024, and FY12/2025 saw a sales decline due to the resulting reaction. For investors, it is important that the Company has experience in actually concluding an out-licensing agreement. If out-licensing following PFKR is also realized for CBA-1205 and CBA-1535, the reproducibility of the Company’s business model will increase.
The IDD business is the third point in the formation of the Company’s corporate value. The Company positions IDD as a “drug discovery platform provision business” and as a business that leverages its technological and antibody drug discovery capabilities to promote biologics drug discovery by pharmaceutical companies and drug discovery startups. In Q1 FY12/2026, the Company indicated clinical development consulting for drug discovery conducted by biotech ventures, science support for startups through collaboration with Axcelead Drug Discovery Partners, and an increase in science support consultations before and after the establishment of biotech ventures. In addition, the Company positions high-throughput screening technology for bispecific antibodies using DoppeLib as an important technology for the future IDD business and intends to pursue new business development.
Biosimilars are also an important area for IDD. Revenue related to biosimilars under joint development is booked in the drug discovery support business, and discussions are progressing with potential new partners for biosimilar development. Biosimilars are an area where the Company can leverage its antibody drug discovery technologies, cell line construction, and CMC development functions. Although they do not have the same one-shot nature as the drug discovery & development business, if revenue reproducibility becomes evident, they will help narrow the Company’s losses and stabilize corporate value.
5. Shareholder distribution and share price supply-demand
The size of the free float has both upside potential and selling strength on rebounds
According to FactSet Ownership data, as of May 2026, the Company’s total shareholder holdings were 11.84%, and the float was 88.35%. The number of shares outstanding was 74,107,500, and the major shareholders were centered on individuals. Mr. Yasuhiro Ogawa held 2.26%, Mr. Kenji Watanabe held 1.82%, Mr. Kunihiro Ohta held 1.30%, Mr. Fumishige Ehira held 1.29%, and Mr. Kan Goshono held 0.93%. Growth Capital held 8.51%, Next Growth held 0.40%, and Simplex Asset Management held 0.19%. The holding ratios of the major shareholders are low overall, and the Company is not a stock whose supply and demand are strongly fixed by stable shareholders.
There are two meanings to this shareholder distribution. First, if positive news emerges, the share price is likely to react lightly. In stocks with a large free float and a high participation ratio of individual investors, short-term funds tend to flow in response to clinical progress, out-licensing, alliances, financing, and biosimilar-related news. In particular, in the Company’s case, there are multiple highly event-sensitive topics, including CBA-1205, CBA-1535, PFKR, and IDD. If the quality of the news is high, the share price may move in line with trading volume.
Second, in phases where events do not continue, or financing is perceived, selling on rebounds tends to emerge. In November 2025, the Company issued the 23rd series of stock acquisition rights with Growth Capital as the scheduled allottee. The exercise price is designed to be adjusted, and it has been indicated that the scheduled allottee will repeatedly recover funds by selling the shares acquired through exercise. This is a structure in which additional share supply is more likely to be perceived when the share price rises. In fact, in the most recent 4Q update, financing and progress in the exercise of rights were summarized as tending toward a ceiling for supply and demand.
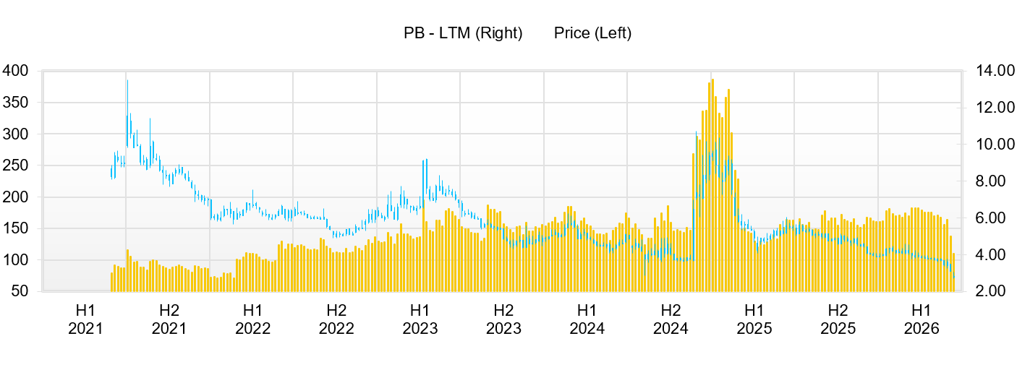
The share price rose in the second half of 2024 on expectations of the PFKR license agreement and biosimilar- and IDD-related matters, reaching a high price range in early 2025. Thereafter, the share price corrected due to a combination of the 2025 sales decline resulting from the reactionary decrease in PFKR upfront income, continued negative operating cash flow, financing and dilution concerns, and uncertainty about the timing of earnings in the drug discovery & development business. Since November 2025, with the issuance of the 23rd series of stock acquisition rights, financing and the progress of rights exercise have become central supply-and-demand issues. In the most recent 4Q update, the share price was summarized as moving within a range, with 105 yen as the lower bound and the low 120 yen level as the ceiling.
This time, the further decline in the share price after the previous update is important for the investment conclusion. If the share price declined despite no major deterioration in fundamentals, then at least the valuation risk has declined. Therefore, rather than simply maintaining the previous “neutral to slightly bullish” stance, it is reasonable to reflect the change in the share price level and tilt the stance toward “slightly bullish.” On the other hand, the fact that the background to the share price decline includes supply and demand dynamics should not be denied. While the share supply associated with the exercise and sale of the 23rd series of stock acquisition rights remains, selling on rebounds tends to emerge in the short term, even if positive news appears.
This share price trend is not a simple structure in which the share price is sluggish despite strong earnings. In FY12/2025, the drug discovery support business exceeded the plan, R&D expenses were also restrained, and the operating loss narrowed. However, sales in the drug discovery & development business were zero, and company-wide sales declined due to the reactionary decrease in PFKR upfront income. In addition, the cash balance decreased, and operating cash flow was negative. Therefore, we believe the market priced in the timing of drug discovery earnings, cash consumption, and dilution risk while evaluating the upside in drug discovery support. This was not a phase in which the share price declined because earnings progress was poor, but rather one in which pressure on supply and demand came to the fore. After all, the earnings picture the share price had expected had not yet materialized.
Going forward, the points to confirm on the supply-demand side are: (1) progress in the exercise of the 23rd series of stock acquisition rights; (2) changes in the number of shares held by Growth Capital and others; (3) changes in major individual shareholders; (4) new inflows by institutional investors; and (5) increases and decreases in trading volume. Even if the business-side news is positive, unless supply-demand digestion progresses, the upside of the share price tends to be limited. On the other hand, if disclosures appear from which out-licensing and earnings terms can be read, and supply from the exercise of rights is digested at the same time, the size of the free float will instead work as lightness on the upside. At this stage, when evaluating the improvement in risk-reward relative to the share price decline, it is necessary to consider both the quality of the news and the digestion of supply.
6. Valuation
The current share price incorporates expectations to a reasonable extent, but investment appeal has improved due to the decline
When looking at the Company’s valuation, the usual PER alone is insufficient. FY12/2025 was loss-making, and sales in the drug discovery & development business are affected by upfront payments and milestones. Meanwhile, FactSet-based market indicators show an actual PBR of 5.13x and a forecast dividend of 0 yen. Assuming a forecast EPS of 4.3 yen, the share price is calculated backward at approximately 96 yen. This indicates that the current share price is being valued not as a company continuing to generate losses, but with future profitability incorporated to a certain extent.
When the market-expected EPS growth rate is calculated backward from the relationship between PBR and ROE, it is roughly 6%, assuming a cost of capital of 10%. If the cost of capital is varied from 8% to 12%, the incorporated growth rate is roughly in the 3% to 8% range. The five-year CAGR from net sales of 481 million yen in FY12/2020 to net sales of 593 million yen in FY12/2025 is slightly above 4%, and on the surface, the market’s growth expectations are not significantly divorced from the past sales growth rate. However, EPS has been negative for the past five years, and EPS CAGR cannot be compared in the usual sense. What is important is not the growth rate itself, but whether the Company can transition from negative EPS to the forecast EPS of 4.3 yen. The current share price incorporates, in addition to sales growth, a return to profitability through out-licensing, milestones, and the buildup of drug discovery support and IDD.
In estimating fair value, we used the PBR, DCF, and ROIC methods. Under the PBR method, after considering actual BPS, out-licensing expectations as a biotech venture, the risk of continued losses, and supply-demand factors, we applied a PBR of 4.0x to 6.5x, resulting in a fair value range of roughly 65-115 yen, with a median of around 90 yen. The PBR of 5.13x already incorporates a degree of expectations for profitability and drug discovery events, and caution is warranted when attaching a large premium at a stage where the earnings terms of out-licensing are not yet visible.
Under the DCF method, we used the drug discovery support sales of 600 million yen as the base revenue. We factored in the probability-adjusted value of CBA-1205, CBA-1535, successors to PFKR, and IDD- and biosimilar-related businesses. Short-term free cash flow is negative, and because sensitivity becomes too high in a standard going-concern DCF, we conservatively set the probabilities of out-licensing, milestones, and IDD revenue. The estimated range is roughly 80-140 yen, with a median of around 105 yen. The upside under DCF strongly depends on the materialization of out-licensing terms, upfront payments, milestones, and royalties for CBA-1205 or CBA-1535.
Under the ROIC method, based on the premise that current ROIC is negative, we incorporated segment profit in the drug discovery support business, restraint of R&D expenses, step changes in profit and loss from upfront out-licensing payments, and continuous monetization of IDD. At present, ROIC is below WACC, and from an economic profit-creation perspective, this has not yet been achieved. However, if upfront out-licensing payments and gross profit from drug discovery support and IDD accumulate, the negative ROIC margin could narrow, shifting from near zero to a low positive level. The range under the ROIC method is 70-125 yen, with a median of around 95 yen.
Combining the three methods, the fair value range is roughly 65-140 yen, and the median is around 95-100 yen. The share price of 109 yen at the time of the previous update was slightly above this median, and, taking into account supply-demand risk and the need to wait for earnings visibility, “neutral to slightly bullish” was appropriate. On the other hand, now that the share price has declined, if there has been no major deterioration in fundamentals, the expected return has improved. Therefore, although we cannot say that the stock is significantly undervalued at this point, the risk-reward profile has improved compared with the previous report, providing a basis to tilt the investment conclusion toward “slightly bullish.”
Based on this evaluation, the investment view can be summarized as follows. The current share price is not at a level that assigns no value to the Company’s drug discovery platform or IDD business opportunities, but it is also not at a level that fully incorporates out-licensing revenue. The market is looking at profitability expectations, as represented by a forecast EPS of 4.3 yen, while also pricing in cash consumption and dilution risk. Accordingly, for the share price to move significantly upward, the Company needs disclosures that allow investors to read “when, how much, and under which profit-and-loss line item,” rather than mere “progress.” However, the decline in the share price has increased the expected return for investors awaiting that confirmation. This is the most important reason for revising the investment conclusion in a bullish direction this time.
7. Growth strategy and risks
Progress in earnings visualization is an upside factor, while cash consumption and supply-demand dynamics are downside factors
The Company’s growth strategy lies in realizing a “sustainable growth model based on a three-layer portfolio.” In the drug discovery & development business, centered on CBA-1205 and CBA-1535, the Company aims to generate significant earnings and increase corporate value through upfront payments, milestones, and royalties resulting from the execution of out-licensing agreements. In the drug discovery support business, the Company earns revenue in a short period through high-value-added contract research services that provide antibody generation, antibody engineering, and protein preparation. In IDD, the Company uses its antibody drug discovery technologies to advance biologics discovery by pharmaceutical companies and drug discovery startups. It expands its scope to include exploratory research, clinical development, and biosimilar development.
The KPIs that investors should confirm differ by business. In the drug discovery & development business, key items include the evaluation of ongoing dosing cases for CBA-1205, data analysis, DLK1 expression rate, additional response cases, long-term SD, combination patents, and progress in out-licensing negotiations. For CBA-1535, the focus is on dose escalation, safety, tolerability, T cell activation parameters, early pharmacodynamic signals, and out-licensing potential based on monotherapy data. In the drug discovery support business, key metrics include quarterly sales, progress toward the 600 million yen plan, the balance between recurring sales and sales booked at a point in time, continuation of transactions with major pharmaceutical companies, and acquisition of new projects. In IDD, items to confirm include projects in collaboration with Axcelead DDP, formation of projects from startup support consultations, external use of DoppeLib, progress in discussions with biosimilar partners, and booking of related revenue.
The first upside factor is data analysis for CBA-1205. After completion of enrollment for hepatocellular carcinoma and melanoma, if additional data for out-licensing negotiations emerge from the evaluation of continuing dosing cases and data analysis, the scenario for maximizing the Company’s product value and consideration upon out-licensing will become more realistic by one notch. If a high DLK1 expression rate is further confirmed in the pediatric cancer cohort and the indication-expansion view strengthens, the evaluation of CBA-1205 will increase. The second is that, for CBA-1535, safety and T cell activation signals become visible, and out-licensing potential based on monotherapy data increases. The third is that a pathway to recurring monetization becomes visible in IDD, particularly biosimilar-related businesses. The fourth is that drug discovery support sales exceed 600 million yen, and segment profit continues to accumulate steadily.
Downside factors are delays in clinical development, safety issues, weak pharmacodynamic signals, prolonged out-licensing negotiations, sluggish growth in drug discovery support sales, biosimilar-related revenue becoming one-off, continued cash consumption, and supply-demand pressure associated with the exercise of stock acquisition rights. In particular, in the Company’s case, although cash and deposits remain in the 1.1 billion yen range, operating cash flow is negative, and sales in the drug discovery & development business are affected by out-licensing events. Therefore, while financing is a necessary means of continuing R&D, in the equity market, it is perceived as a source of dilution and selling on rebounds.
Monitoring items to confirm from the next results onward are, first, progress in drug discovery support sales. Q1 sales of 147 million yen represent a generally smooth start relative to the full-year plan of 600 million yen, and it is important whether the Company can maintain the same level from Q2 onward. Second is R&D expenses. In Q1, they decreased year-on-year to 174 million yen, but expenses may increase again as clinical progress continues, so we want to see whether expense restraint is structural or temporary. Third is the cash balance. Cash and deposits of 1.141 billion yen still indicate a certain level of capacity. However, as long as negative operating cash flow continues, the pace of cash consumption will affect the share price evaluation. Fourth is data disclosure for CBA-1205 and CBA-1535. Fifth is revenue recognition related to IDD and biosimilars. Sixth is progress in the exercise of stock acquisition rights and share supply-demand.
The Company’s growth strategy is presented consistently in the Company’s explanations. The issue is when it will appear in the P&L and cash flow. The drug discovery & development business aims for a single-year P&L contribution through out-licensing, but the timing is difficult to predict. Drug discovery support is stable, but at its current scale, it cannot fully absorb company-wide losses. IDD leads to expansion of business opportunities, but the speed of project formation and monetization needs to be confirmed. Therefore, future investment decisions will be determined not by the direction of the business but by the speed of earnings visibility and the progress of supply-demand digestion.
8. Conclusion for stock investment
Expected return has improved due to the decline in the share price. Disclosures showing earnings terms are the key to an upward revision
The final investment conclusion for the Company’s shares is to strengthen the stance by one notch from “neutral to slightly bullish” at the previous 4Q update to “slightly bullish.” The reason is that, while no major deterioration in fundamentals has been confirmed, the share price has declined and the risk-reward has improved. The three-layer portfolio, combining the drug discovery & development business, the drug discovery support business, and IDD, is a rational strategy that leverages the Company’s antibody drug discovery platform across multiple earnings opportunities. The Company’s framework of “source of growth,” “securing stable revenue,” and “expanding business opportunities” is easy for investors to understand in terms of the Company’s corporate value formation. CBA-1205 is accumulating data in hepatocellular carcinoma, melanoma, and pediatric cancer indications as part of a program aimed at maximizing product value and consideration upon out-licensing. CBA-1535 aims for early licensing in the T cell engager field, with an eye to out-licensing potential based on monotherapy data. Drug discovery support forms stable revenue of around 600 million yen, and IDD and biosimilars expand medium-term business opportunities.
On the other hand, the share price evaluation is still at a stage before rising by another notch. In FY12/2025, drug discovery support exceeded the Company’s plan, and the operating loss narrowed. However, company-wide sales declined due to a reaction-driven decrease in PFKR upfront income, and operating cash flow was negative. In Q1 FY12/2026 as well, sales growth and narrowing of losses were confirmed, but there were no sales in the drug discovery & development business, and cash and deposits decreased. Furthermore, due to the issuance and exercise of the 23rd series of stock acquisition rights, additional supply is likely to be perceived during phases of share price increases. Accordingly, at present, while evaluating the direction of the business, this is not yet the stage where the share price range rises based on the story alone.
However, the decline in the share price after the previous update cannot be ignored. The investment conclusion is determined not only by the quality of the business but also by its relationship to the share price level. If the share price has declined despite no major change in fundamentals and no new fatal risk being confirmed, the expected return improves. Therefore, for this investment conclusion, it is natural to raise the stance not to the same “neutral to slightly bullish” as before, but to “slightly bullish.” This does not mean unconditionally chasing the upside in the short term, but rather a judgment to raise the evaluation while confirming visualization of earnings and supply-demand digestion, based on the improved risk-reward resulting from the share price decline.
The conditions for the share price to move into an upper range can be summarized as follows. First, for CBA-1205 or CBA-1535, data directly linked to out-licensing and visibility into economic terms emerge. Second, in IDD or biosimilar-related businesses, the possibility of recurring monetization, rather than one-off revenue, becomes visible. Third, the probability of achieving 600 million yen in drug discovery support sales increases, and segment profit steadily narrows company-wide losses. Fourth, the pace of decline in the cash balance slows, and the market’s caution toward cash consumption and dilution eases. Fifth, the supply-demand dynamics of the stock acquisition rights are digested to some extent, making the share price more likely to respond directly to positive news.
In valuation terms, an actual PBR of 5.13x indicates that expectations of profitability are reflected in the share price to some extent. The fair value range based on the three methods of PBR, DCF, and ROIC is roughly 65 yen to 140 yen, with a median of around 95 yen to 100 yen. At the time of the previous update, the share price was slightly above this median; therefore, “neutral to slightly bullish” was appropriate, taking into account supply-demand risk and the need to wait for the visualization of earnings. On the other hand, at present, due to the share price decline, there are periods when the share price is near or below the median, and investment appeal has improved. If disclosures appear that show out-licensing terms or the timing of revenue recognition, an upward revision of the evaluation toward the upper end of the DCF or PBR range is entirely possible.
In practical investment terms, it is appropriate to treat the Company’s shares not as a stable growth stock but as an event-driven stock, for which the evaluation rises while confirming the visualization of earnings. Looking three to four years ahead over the medium to long term, the scenario remains that the Company will narrow its losses and accumulate out-licensing, joint research, and biosimilar-related revenue through the combination of CBA-1205, CBA-1535, successors to PFKR, IDD, and drug discovery support. In aiming for share price returns over one to two years, important triggers will be disclosures on drug discovery from which earnings terms and recognition timing can be seen, achievement of 600 million yen in drug discovery support, concretization of IDD projects, and supply-demand digestion.
In conclusion, the Company is steadily advancing a business model that combines drug discovery & development, drug discovery support, and IDD, with an antibody drug discovery platform at its core. The Company’s mission of “Shedding light on unmet medical needs through drug discovery,” its strategy of a “sustainable growth model based on a three-layer portfolio,” and its strength of “ability to identify promising products × practical capability to complete the process from research to entering clinical trials as quickly and directly as possible” are at the center of the Company’s investment story. However, what the equity market is next seeking is when and how much that story will appear as earnings. If drug discovery catalysts with visible earnings terms emerge and the reflection of drug discovery support and IDD in the numbers is confirmed, the Company’s shares will enter a revaluation phase. On the other hand, until then, a stepwise evaluation that accounts for the relative weight of supply and demand is necessary. The expected return has improved due to the current decline in the share price, and we raise the investment conclusion to “slightly bullish.”
Key financial data
| Unit: million yen | 2021 | 2022 | 2023 | 2024 | 2025 | 2026 CE |
| Sales | 713 | 631 | 682 | 781 | 593 | NA |
| EBIT (Operating Income) | -1,334 | -1,259 | -1,205 | -1,031 | -980 | NA |
| Pretax Income | -1,466 | -1,238 | -1,215 | -1,018 | -980 | NA |
| Net Profit Attributable to Owner of Parent | -1,480 | -1,243 | -1,220 | -1,021 | -983 | NA |
| Cash & Short-Term Investments | 1,791 | 1,727 | 1,326 | 2,063 | 1,205 | |
| Total assets | 2,339 | 2,215 | 1,751 | 2,469 | 1,728 | |
| Total Debt | 183 | 184 | 291 | 282 | 262 | |
| Net Debt | -1,608 | -1,543 | -1,035 | -1,782 | -943 | |
| Total liabilities | 446 | 425 | 594 | 549 | 605 | |
| Total Shareholders’ Equity | 1,893 | 1,791 | 1,158 | 1,920 | 1,122 | |
| Net Operating Cash Flow | -1,131 | -1,191 | -1,069 | -1,001 | -936 | |
| Capital Expenditure | 0 | 0 | 0 | 0 | 40 | |
| Net Investing Cash Flow | -35 | 0 | 0 | 0 | -55 | |
| Net Financing Cash Flow | 271 | 1,127 | 667 | 1,738 | 133 | |
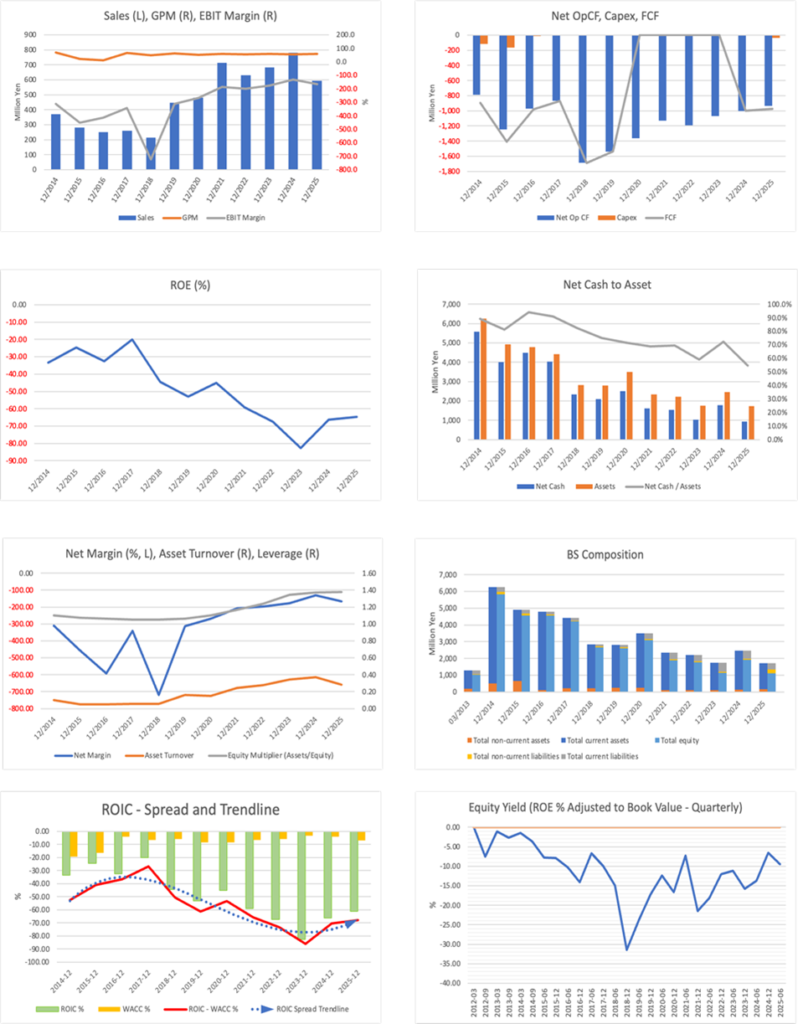
| ROA (%) | -50.73 | -54.57 | -61.51 | -48.37 | -46.84 | |
| ROE (%) | -59.16 | -67.48 | -82.76 | -66.33 | -64.61 | |
| EPS (Yen) | -36.7 | -28.3 | -24.6 | -17.5 | -14.5 | |
| BPS (Yen) | 46.4 | 37.0 | 22.0 | 28.7 | 16.4 | |
| Dividend per Share (Yen) | 0.00 | 0.00 | 0.00 | 0.00 | 0.00 | 0.00 |
| Shares Outstanding (Million shares) | 40.31 | 48.42 | 52.19 | 66.97 | 68.05 |
Source: Omega Investment from company data, rounded to the nearest whole number.
Share price
Key stock price data
Financial data (quarterly basis)
| Unit: million yen | 2024/12 | 2025/12 | 2026/12 | ||||||
| 1Q | 2Q | 3Q | 4Q | 1Q | 2Q | 3Q | 4Q | 1Q | |
| (Income Statement) | |||||||||
| Sales | 130 | 134 | 159 | 358 | 139 | 113 | 118 | 223 | 147 |
| Year-on-year | -23.5% | -29.2% | -3.8% | 126.1% | 7.0% | -15.7% | -25.7% | -37.6% | 6.1% |
| Cost of Goods Sold (COGS) | 73 | 56 | 74 | 145 | 58 | 55 | 53 | 72 | 67 |
| Gross Income | 57 | 78 | 85 | 213 | 81 | 58 | 65 | 151 | 81 |
| Gross Income Margin | 44.0% | 58.0% | 53.4% | 59.5% | 58.1% | 51.5% | 55.3% | 67.8% | 54.7% |
| SG&A Expense | 379 | 337 | 425 | 323 | 345 | 330 | 334 | 326 | 313 |
| EBIT | -322 | -259 | -340 | -110 | -265 | -272 | -269 | -174 | -232 |
| Year-on-year | 42.6% | -40.2% | 38.1% | -63.3% | -17.9% | 5.1% | -21.0% | 58.7% | -12.2% |
| Operating Income Margin | -248.5% | -193.1% | -213.9% | -30.7% | -190.7% | -240.7% | -227.5% | -78.1% | -157.9% |
| EBITDA | -322 | -259 | -340 | -110 | -265 | -272 | -267 | -172 | -230 |
| Pretax Income | -303 | -259 | -351 | -105 | -265 | -273 | -259 | -182 | -232 |
| Consolidated Net Income | -304 | -260 | -352 | -105 | -266 | -274 | -260 | -183 | -233 |
| Minority Interest | 0 | 0 | 0 | 0 | 0 | 0 | 0 | 0 | 0 |
| Net Income ATOP | -304 | -260 | -352 | -105 | -266 | -274 | -260 | -183 | -233 |
| Year-on-year | 33.5% | -40.4% | 38.0% | -65.1% | -12.5% | 5.5% | -26.1% | 73.4% | -12.4% |
| Net Income Margin | -234.5% | -193.9% | -221.2% | -29.4% | -191.8% | -242.5% | -220.3% | -81.7% | -158.4% |
| (Balance Sheet) | |||||||||
| Cash & Short-Term Investments | 1,325 | 1,104 | 1,241 | 2,063 | 1,819 | 1,475 | 1,006 | 1,205 | 1,142 |
| Total assets | 1,754 | 1,557 | 1,694 | 2,469 | 2,205 | 1,963 | 1,549 | 1,728 | 1,670 |
| Total Debt | 314 | 292 | 303 | 282 | 282 | 261 | 79 | 262 | 87 |
| Net Debt | -1,012 | -812 | -938 | -1,782 | -1,537 | -1,214 | -926 | -943 | -1,055 |
| Total liabilities | 506 | 487 | 478 | 549 | 443 | 443 | 299 | 605 | 358 |
| Total Sharehjolders’ Equity | 1,248 | 1,071 | 1,216 | 1,920 | 1,761 | 1,519 | 1,250 | 1,122 | 1,312 |
| (Profitability %) | |||||||||
| ROA | -67.53 | -69.09 | -70.61 | -48.37 | -49.66 | -56.65 | -55.84 | -46.84 | -49.03 |
| ROE | -92.28 | -101.15 | -100.30 | -66.33 | -65.33 | -77.00 | -73.45 | -64.61 | -61.82 |
| (Per-share) Unit: JPY | |||||||||
| EPS | -5.6 | -4.6 | -6.1 | -1.7 | -3.9 | -4.0 | -3.8 | -2.7 | -3.3 |
| BPS | 22.4 | 19.0 | 19.9 | 28.7 | 26.0 | 22.3 | 18.4 | 16.4 | 18.1 |
| Dividend per Share | 0.00 | 0.00 | 0.00 | 0.00 | 0.00 | 0.00 | 0.00 | 0.00 | 0.00 |
| Shares Outstanding (milion shares) | 55.40 | 56.39 | 61.24 | 66.97 | 67.77 | 68.05 | 68.05 | 68.05 | 70.89 |
Source: Omega Investment from company materials
Financial data (full-year basis)
| Unit: million yen | 2016/12 | 2017/12 | 2018/12 | 2019/12 | 2020/12 | 2021/12 | 2022/12 | 2023/12 | 2024/12 | 2025/12 |
| (Income Statement) | ||||||||||
| Sales | 252 | 260 | 213 | 448 | 481 | 713 | 631 | 682 | 781 | 593 |
| Year-on-year | -10.0% | 3.0% | -18.1% | 110.3% | 7.4% | 48.3% | -11.5% | 8.2% | 14.4% | -24.0% |
| Cost of Goods Sold | 228 | 94 | 107 | 167 | 238 | 292 | 283 | 285 | 349 | 238 |
| Gross Income | 25 | 166 | 106 | 281 | 243 | 421 | 348 | 398 | 432 | 356 |
| Gross Income Margin | 9.7% | 64.0% | 49.6% | 62.7% | 50.5% | 59.0% | 55.1% | 58.3% | 55.3% | 59.9% |
| SG&A Expense | 1,067 | 1,054 | 1,645 | 1,683 | 1,526 | 1,755 | 1,606 | 1,603 | 1,463 | 1,335 |
| EBIT (Operating Income) | -1,042 | -888 | -1,539 | -1,402 | -1,284 | -1,334 | -1,259 | -1,205 | -1,031 | -980 |
| Year-on-year | -17.9% | -14.8% | 73.4% | -8.9% | -8.4% | 3.9% | -5.7% | -4.2% | -14.5% | -5.0% |
| Operating Income Margin | -413.3% | -341.6% | -723.1% | -313.2% | -266.9% | -187.2% | -199.5% | -176.6% | -132.0% | -165.1% |
| EBITDA | -929 | -877 | -1,532 | -1,397 | -1,280 | -1,331 | -1,257 | -1,204 | -1,030 | -976 |
| Pretax Income | -1,501 | -880 | -1,531 | -1,401 | -1,291 | -1,466 | -1,238 | -1,215 | -1,018 | -980 |
| Net Income | -1,491 | -883 | -1,534 | -1,404 | -1,294 | -1,480 | -1,243 | -1,220 | -1,021 | -983 |
| Net Income ATOP | -1,491 | -883 | -1,534 | -1,404 | -1,294 | -1,480 | -1,243 | -1,220 | -1,021 | -983 |
| Year-on-year | 16.3% | -40.8% | 73.8% | -8.5% | -7.8% | 14.4% | -16.0% | -1.8% | -16.3% | -3.7% |
| Net Income Margin | -591.2% | -339.6% | -720.5% | -313.6% | -269.1% | -207.6% | -197.0% | -178.8% | -130.7% | -165.6% |
| (Balance Sheet) | ||||||||||
| Cash & Short-Term Investments | 4,553 | 4,027 | 2,329 | 2,106 | 2,686 | 1,791 | 1,727 | 1,326 | 2,063 | 1,205 |
| Total assets | 4,789 | 4,419 | 2,831 | 2,808 | 3,495 | 2,339 | 2,215 | 1,751 | 2,469 | 1,728 |
| Total Debt | 54 | 4 | 0 | 0 | 180 | 183 | 184 | 291 | 282 | 262 |
| Net Debt | -4,499 | -4,023 | -2,329 | -2,106 | -2,506 | -1,608 | -1,543 | -1,035 | -1,782 | -943 |
| Total liabilities | 224 | 202 | 154 | 187 | 385 | 446 | 425 | 594 | 549 | 605 |
| Total Shareholders’ Equity | 4,565 | 4,218 | 2,677 | 2,622 | 3,110 | 1,893 | 1,791 | 1,158 | 1,920 | 1,122 |
| (Cash Flow) | ||||||||||
| Net Operating Cash Flow | -970 | -867 | -1,689 | -1,537 | -1,360 | -1,131 | -1,191 | -1,069 | -1,001 | -936 |
| Capital Expenditure | 11 | 5 | 0 | 0 | 0 | 0 | 0 | 0 | 0 | 40 |
| Net Investing Cash Flow | 1,989 | -137 | 0 | -26 | -4 | -35 | 0 | 0 | 0 | -55 |
| Net Financing Cash Flow | 1,434 | 479 | -10 | 1,341 | 1,944 | 271 | 1,127 | 667 | 1,738 | 133 |
| (Profitability ) | ||||||||||
| ROA (%) | -30.72 | -19.17 | -42.30 | -49.79 | -41.06 | -50.73 | -54.57 | -61.51 | -48.37 | -46.84 |
| ROE (%) | -32.67 | -20.10 | -44.49 | -52.99 | -45.15 | -59.16 | -67.48 | -82.76 | -66.33 | -64.61 |
| Net Margin (%) | -591.23 | -339.59 | -720.46 | -313.65 | -269.06 | -207.58 | -197.03 | -178.77 | -130.73 | -165.65 |
| Asset Turn | 0.05 | 0.06 | 0.06 | 0.16 | 0.15 | 0.24 | 0.28 | 0.34 | 0.37 | 0.28 |
| Assets/Equity | 1.06 | 1.05 | 1.05 | 1.06 | 1.10 | 1.17 | 1.24 | 1.35 | 1.37 | 1.38 |
| (Per-share) Unit: JPY | ||||||||||
| EPS | -65.9 | -33.5 | -57.3 | -44.6 | -36.1 | -36.7 | -28.3 | -24.6 | -17.5 | -14.5 |
| BPS | 179.3 | 157.5 | 99.9 | 78.8 | 78.7 | 46.4 | 37.0 | 22.0 | 28.7 | 16.4 |
| Dividend per Share | 0.00 | 0.00 | 0.00 | 0.00 | 0.00 | 0.00 | 0.00 | 0.00 | 0.00 | 0.00 |
| Shares Outstanding (million shares) | 25.31 | 26.78 | 26.78 | 33.28 | 39.51 | 40.31 | 48.42 | 52.19 | 66.97 | 68.05 |
Source: Omega Investment from company materials