2026-10-23
Home
Japanese

Omega Investment Co., Ltd.
Prestige International (Investment report – 1Q update
| Share price (8/14) | ¥718 | Dividend Yield (27/3 CE) | 3.9 % |
| 52weeks high/low | ¥607/762 | ROE(26/3 act) | 12.5 % |
| Avg Vol (3 month) | 532.8 thou shrs | Operating margin (26/3 act) | 12.5 % |
| Market Cap | ¥91.31 bn | Beta (5Y Monthly) | 0.21 |
| Enterprise Value | ¥65.39 bn | Shares Outstanding | 127.176 mn shrs |
| PER (27/3 CE) | 15.1 X | Listed market | TSE Prime |
| PBR (26/3 act) | 1.9 X |
| Click here for the PDF version of this page |
| PDF version |
Margin improvement becomes a reality. The long-stagnant share price enters a revaluation phase
Investment conclusion
Maintaining a positive view, supported by margin improvement and stronger shareholder returns
We maintain our positive view on the Company’s shares. In Q1, sales increased 8.7% YoY, while operating profit rose 17.4%, and both the gross margin and operating margin improved by 0.9 percentage points. Amid rising labor and outsourcing costs, contract price increase, new operations, and efficiency improvements through digital utilization absorbed the cost increases. The three conditions cited in the previous report for share-price revaluation—improvement in the operating margin, double-digit growth in the Financial Guarantee Business, and a recovery in the Automotive Business margin—were all confirmed at the same time.
On July 28, the Company also announced a share repurchase with a maximum total acquisition amount of 1.0 billion yen and a maximum of 1.6 million shares to be acquired. Following the share repurchases since 2025, dividend increases, and the reintroduction of the shareholder benefit program, this represents further capital returns and makes clear that management continues capital allocation with shareholder value in mind.
The share price has risen from 651 yen at the time of the previous report to 732 yen, requiring an update to the previous wording that cited the share-price decline as an investment rationale. However, a forward PER of 15.5x, an actual PBR of 1.90x, and a forward dividend yield of 3.8% are not excessive levels in light of ROE of 12.2%, a high net cash position, and the long-term ROIC spread. Fair values based on the PBR, DCF, and ROIC methods range from 795 yen to 900 yen, with a median of 835 yen. Rather than chasing the short-term rise in the share price, we view this as a phase in which the share-price assessment can rise gradually as margin improvement and stronger shareholder returns continue.
◇ Q1 results highlights
Q1 was favorable, with the rate of profit growth exceeding the rate of sales growth. Sales were 18.173 billion yen, operating profit was 2.271 billion yen, ordinary profit was 2.352 billion yen, and quarterly net profit attributable to owners of parent was 1.173 billion yen. Progress against the full-year plan was 23.9% for sales and 23.7% for operating profit, which is standard based on the figures alone. However, profit tends to be relatively smaller in Q1, and we would emphasize the YoY improvement in margins.
Cost of sales increased 7.4% YoY, below the 8.7% increase in sales. Gross profit increased 13.3%, and the gross margin improved from 20.7% to 21.6%. SG&A expenses increased only 8.2%, and the operating margin rose from 11.6% to 12.5%. The core point of these results is that price revisions led not only to higher sales but also to margin improvement.
The Company maintained its full-year forecast. Against its plan for sales of 76.0 billion yen, operating profit of 9.6 billion yen, and an operating margin of 12.6%, the Q1 operating margin has improved to 12.5%. As depreciation expenses associated with the launch of the Akita BPO Katagami Campus may arise from Q2 onward, there is no need at this stage to assume substantial upside. On the other hand, if the effects of price revisions continue, the likelihood of achieving operating profit of 9.6 billion yen is high.
| Unit: million yen | Q1 FY3/2026 | Q1 FY3/2027 | YoY | Full-year progress |
| Sales | 16,723 | 18,173 | 8.7% | 23.9% |
| Operating profit | 1,934 | 2,271 | 17.4% | 23.7% |
| Ordinary profit | 2,012 | 2,352 | 16.9% | 23.7% |
| Net profit attributable to owners of parent | 1,013 | 1,173 | 15.9% | 19.8% |
| Operating margin | 11.6% | 12.5% | Improved by 0.9 percentage points | 12.6% plan |
◇ Analysis by business
| Business | Sales | Sales growth | Operating profit | Profit growth | Role in enterprise value creation |
| Automotive | 7.412 billion yen | 7.0% | 779 million yen | 16.4% | Foundation for sales scale and customer touchpoints |
| Property | 2.605 billion yen | 10.6% | 226 million yen | 53.5% | Margin improvement in domestic assistance services |
| Global | 2.632 billion yen | 7.1% | 384 million yen | 31.0% | Source of growth and geographic diversification of earnings |
| Customer | 1.632 billion yen | -2.3% | 245 million yen | 0.3% | Stable profit after project selection |
| Financial Guarantee | 3.455 billion yen | 19.9% | 772 million yen | 17.1% | High-margin profit growth and capital efficiency |
| IT | 231 million yen | -6.5% | 7 million yen | -78.5% | Investment supporting company-wide productivity improvement |
| Social | 203 million yen | 14.0% | -125 million yen | Loss expanded | Contribution to recruitment and local collaboration |
Automotive Business
The Automotive Business serves as the foundation for sales scale and customer touchpoints. Sales increased 7.0% to 7.412 billion yen, and operating profit rose 16.4% to 779 million yen. The operating margin improved from 9.7% in the same period of the previous fiscal year to 10.5%. An increase in the number of policies at certain direct-line auto insurance companies, expansion of operations for existing clients, and new operations contributed to higher sales. Importantly, contract price increases and new operations absorbed the increase in outsourcing costs associated with higher payment rates to partner companies.
In the previous report, we identified price pass-through and improved dispatch-arrangement efficiency as issues for this business. This time, price pass-through led to a recovery in the margin, partially alleviating the previous concerns. Going forward, we will monitor the number of auto insurance policies, the number of dispatch arrangements, contract price increase rates, payment rates to partner companies, the number of in-house personnel, and dispatch arrangements per person. Expanding the in-house operating structure enhances quality and response capacity while also increasing the fixed-cost burden, making it necessary to assess scale expansion and productivity at the same time.
Financial Guarantee Business
The Financial Guarantee Business plays the role of raising the growth rate of consolidated profit and capital efficiency. Sales increased 19.9% to 3.455 billion yen, and operating profit rose 17.1% to 772 million yen. The operating margin was 22.4%, and the business generated approximately 34% of consolidated operating profit. In addition to an increase in the number of rent debt guarantee contracts, the number of medical expense guarantee and eldercare expense guarantee contracts increased. At the same time, Carol System Inc., which became a consolidated subsidiary in the previous fiscal year, also contributed to sales.
Because sales growth exceeded operating profit growth, it is necessary to confirm the impact of guarantee costs, consolidation of the subsidiary, and strengthening of the sales structure on the margin. Key indicators are the number of rent debt guarantee contracts, renewal rate, number of medical institutions adopting medical expense guarantees, number of eldercare expense guarantee contracts, guarantee fulfillment rate, and bad-debt-related expenses.
Property Business and Global Business
The Property Business posted sales of 2.605 billion yen, up 10.6%, and operating profit of 226 million yen, up 53.5%. In addition to an increase in the number of rental housing units covered by on-site dispatch services, an agreement was reached on contract prices in the Park Assist business, improving the margin. Following the Automotive Business, this can be evaluated as another case in which price revisions led to improved profitability.
The Global Business posted sales of 2.632 billion yen, up 7.1%, and operating profit of 384 million yen, up 31.0%. New client acquisition for healthcare programs, an increase in the number of members for credit cards issued in the United States for Japanese expatriates, and yen depreciation contributed. Progress against the full-year operating profit plan was 28.5%, making this business a candidate for upside. However, it is necessary to evaluate business growth separately from foreign exchange effects.
◇ Customer Business, IT Business, and Social Business
The Customer Business posted sales of 1.632 billion yen, down 2.3%, and operating profit of 245 million yen, up 0.3%. The review of low-margin projects has run its course, and the operating margin was maintained at 15.0%. Rather than pursuing a high growth rate, the business is better suited to securing stable profit without compromising project profitability.
The IT Business recorded lower sales and lower profits due to upfront investment in engineers. The enterprise value of the IT Business should be measured not only by external sales but also by labor savings and improved processing capacity across contact centers as a whole. Disclosure of response time, after-call work time, automation rate, and the number of cases handled per person, among other indicators, would be desirable.
The Social Business increased sponsor income, while its operating loss expanded to 125 million yen due to costs to strengthen personnel and team capabilities in the sports business. Although it contributes to recruitment, corporate brand, and relationships with local communities, from the perspective of shareholder value, the Company needs to clarify the annual amount of losses and the timing of improvement.
◇ Factors that could cause results to deviate from the Company plan
The Company plan incorporates an increase in the number of auto insurance policies and new operations in the Automotive Business, contract price increases, growth in financial guarantee contracts, membership growth in the Global Business, operation of the Akita BPO Katagami Campus, higher labor and outsourcing costs, and digital investment including AI.
Upside factors are the full-year contribution of contract price increases, improved dispatch-arrangement efficiency in the Automotive Business, the effects of price revisions in the Property Business, financial guarantee contracts exceeding plan, and membership growth in the Global Business. If the improvement in the gross margin continues, operating profit may exceed the Company plan even if sales are in line with plan. A decline in the number of shares in circulation due to share repurchases will also lift earnings per share.
Downside factors are renewed increases in labor and outsourcing costs, delays in raising the utilization rate of the Akita BPO Katagami Campus, increased guarantee fulfillment expenses in the Financial Guarantee Business, yen appreciation, IT investment expenses, and expansion of losses in the Social Business. Cash and deposits increased to 29.995 billion yen, while short-term borrowings were 7.7 billion yen. Net cash is approximately 22.3 billion yen, indicating high financial stability, although we will continue to monitor capital allocation, including investment in operating bases, share repurchases, and dividends.
◇ Share-price trend and background to revaluation
Over approximately the past five years, the share price rose to around 900 yen from 2020 through 2021, after which it generally traded in the 600-yen to 700-yen range from 2022 onward. Sales and operating profit increased, but the operating margin declined from 14.6% in FY3/2022 to 12.5% in both FY3/2025 and FY3/2026. We believe concerns over the quality of profit growth, rising labor costs, DX investment, and cash use restrained the share-price assessment.
Over the past three months, the share price has recovered and outperformed TOPIX. The full-year results announcement in May included a dividend increase and the reintroduction of the shareholder benefit program, and the dividend yield supported the share price. In addition, expectations for margin improvement from contract price increases increased, and the Q1 results and share repurchase announcement on July 28 turned those expectations into figures. Clear actions by the Company are behind the movement that has begun in the long-stagnant share price.
Compared with the July 28 closing price of 686 yen, the following day’s closing price of 732 yen was 6.7% higher. The main reason for the strong share-price reaction was not only the 17.4% increase in operating profit. Both the gross margin and operating margin improved by 0.9 percentage points, and profit growth was confirmed across multiple businesses, including Automotive, Property, Global, and Financial Guarantee. This was accompanied by a share repurchase and a commemorative shareholder benefit, resulting in results that allowed investors to evaluate profit growth and capital returns at the same time.
◇ EPS growth rate priced in by the market
Based on a share price of 732 yen and forward EPS of 47.5 yen, the forward PER is 15.4x. Based on actual BPS of 387.7 yen, the actual PBR is 1.89x, while the forward dividend yield based on a forecast dividend of 28 yen is 3.8% and the forecast dividend payout ratio is 58.9%.
Reverse-calculating from a dividend discount model using a cost of equity of 7.5%, the long-term expected EPS growth rate priced into the current share price is approximately 3.9%. With a cost of equity ranging from 7.0% to 8.0%, the implied rate ranges from 3.4% to 4.5%.
Actual EPS CAGR from FY3/2021 to FY3/2026 is in the 15% range, although the starting point includes the impact of the spread of COVID-19. The more normalized EPS CAGR from FY3/2022 to FY3/2026 is approximately 8.4%. The growth rate in the high-3% range priced in by the market is substantially below the normalized historical rate. The current share price does not require the continuation of the past growth rate and adequately prices in rising labor costs, capital expenditure, and slower growth in the Financial Guarantee Business. If margin improvement continues, this would provide a basis for a further rise in the share-price assessment.
◇ Fair value
| Method | Key assumptions | Fair value | Difference from current share price |
| PBR method | Forward ROE 12.2%, cost of equity 7.5%, long-term growth rate 3.0% | 795 yen | 8.2% |
| DCF method | Normalized FCF 3.2 billion yen, five-year growth rate 5.0%, WACC 6.5%, terminal growth rate 2.0% | 835 yen | 13.6% |
| ROIC method | Reflects ROIC in the 12% range, the spread between ROIC and WACC, and growth in invested capital | 900 yen | 22.4% |
| Median | Median of the three methods | 835 yen | 13.6% |
The fair-value range under the three methods is 795 yen to 900 yen, with a median of 835 yen. Relative to the current share price of 732 yen, the upside is 8.2% at the low end, 13.6% at the median, and 22.4% at the high end. The rise in the share price means the stock is not as undervalued as it was previously, but all three methods indicate values above the current share price. Including the forward dividend yield of 3.8%, we can maintain our positive view.
The PBR method assumes forward ROE of 12.2%, a cost of equity of 7.5%, and a long-term growth rate of 3.0%. The DCF method assumes normalized free cash flow of 3.2 billion yen, a growth rate of 5.0% over the next five years, WACC of 6.5%, a terminal growth rate of 2.0%, and net cash of approximately 22.3 billion yen. The ROIC method reflects ROIC in the 12% range, the spread between ROIC and WACC, and growth in invested capital.
◇ Capital efficiency, cash flow, and shareholder distribution
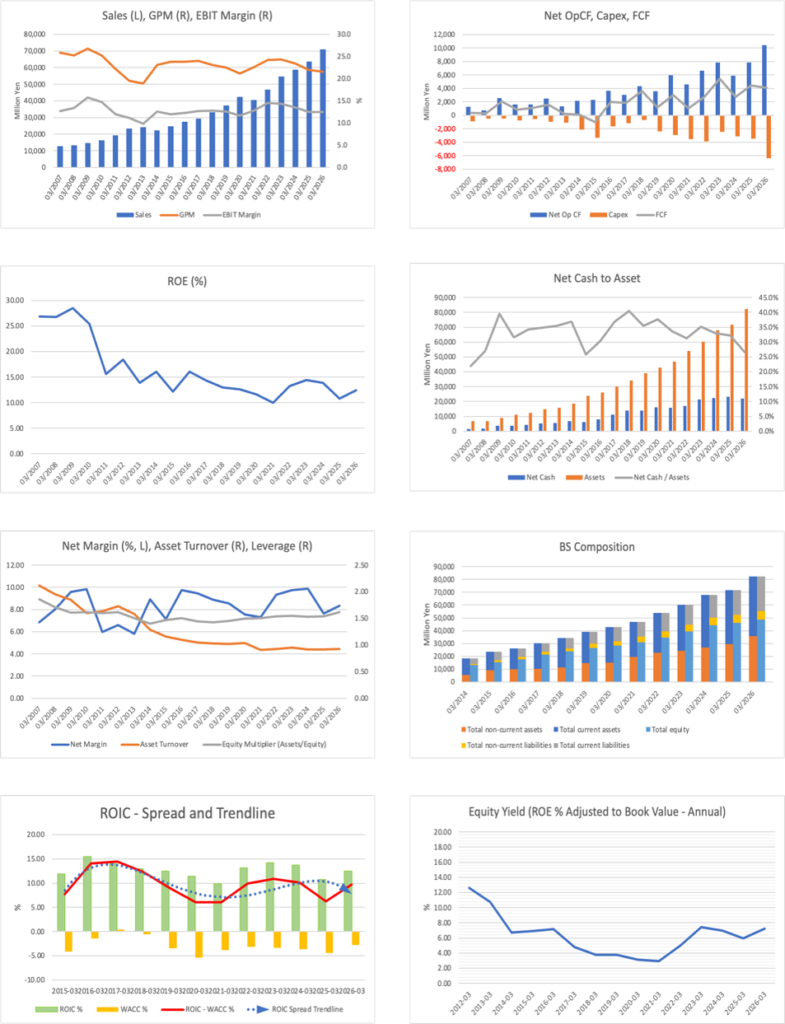
The long-term data shown on page 6 indicate that sales and operating cash flow have increased consistently, while the gross margin and total asset turnover have declined over the long term. This is because the asset burden from personnel, operating bases, advances, and other items has increased. Further enhancement of enterprise value will require not only sales expansion but also improved productivity of assets and personnel through price revisions and digital utilization.
ROE has declined from the high-20% range in the past to the low-teens currently, although this also reflects the accumulation of shareholders’ equity and lower financial leverage. ROIC has continued to exceed WACC, and the ROIC spread has remained high. For capital expenditure such as the Akita BPO Katagami Campus, it will be important to determine whether ROIC can be maintained after operations begin.
In the shareholder distribution, Shinichi Tamagami holds 30.03%. While this tends to align the interests of management and shareholders, it also limits the number of shares in circulation. Fidelity holds 6.32%, VARECS Partners Limited 4.14%, Jupiter Asset Management 3.74%, and Amova Asset Management 3.03%. A certain proportion of the shares being held by long-term domestic and overseas investors is a strength, but concentration among major shareholders and share repurchases may reduce liquidity.
The Company is expected to undertake initiatives to broaden its investor base not only through share repurchases but also by quantifying its capital allocation policy and disclosing KPIs by business. Balancing the presence of stable shareholders with market liquidity will be important for future share-price formation.
◇ Items to confirm in subsequent financial results
- Whether the consolidated operating margin remains at 12.5% or higher and the effects of price revisions continue from Q2 onward.
- The number of contracted auto insurance policies, number of dispatch arrangements, outsourcing cost ratio, number of in-house personnel, and dispatch arrangements per person in the Automotive Business.
- The number of rent debt guarantee contracts, number of medical expense guarantee and eldercare expense guarantee contracts, guarantee fulfillment rate, and bad debt expenses in the Financial Guarantee Business.
- The number of employees hired, number of operating seats, utilization rate, transferred operations, new operations, and sales per person at the Akita BPO Katagami Campus.
- The number of healthcare program members, number of U.S. card members, and profit contribution from foreign exchange in the Global Business.
- Improvements in response time, after-call work time, automation rate, and the number of cases handled per person through IT investment.
- The annual loss plan, sponsor income, amount of cost increases, and timing of profitability improvement in the Social Business.
- The number and acquisition price per share of shares repurchased, policy on cancellation after acquisition, dividend payout ratio, and total payout ratio.
◇ Conclusion
Q1 results showed the realization of several conditions that we sought to confirm in the previous report. Contract price increases led to improvements in the gross margin and operating margin, and profitability in the Automotive Business recovered. The Financial Guarantee Business maintained high growth, while profit growth broadened to the Property Business and Global Business. In addition, a share repurchase was announced, increasing the continuity of capital returns.
Although the share price rose over a short period, we do not consider the forward PER of 15.5x and actual PBR of 1.89x to be excessively high relative to ROE of 12.2%, a forward dividend yield of 3.8%, and the Company’s long-term cash-generating capability. The median fair value of 835 yen under the three methods is 13.6% above the current share price. If the margin improvement is not limited to one quarter and the Akita BPO Katagami Campus and digital investment lead to productivity improvement, the share-price assessment will rise further. We maintain our positive view.
Company profile
◇ A stable earnings company spanning mobility, housing, overseas medical care, and guarantees, centered on 24-hour operations-based BPO
Prestige International Inc. is a TSE Prime-listed company with recurring earnings and cash-generating capabilities, centered on operations-based BPO that solves problems and is less susceptible to economic fluctuations. The Company was established on October 30, 1986, and has 5,649 consolidated employees. Its business includes BPO, as well as Automotive Business, Property Business, Global Business, Customer Business, Financial Guarantee Business, IT Business, and Social Business. The essence of its business model lies not in simply outsourcing call center operations, but in integrating contact centers, field dispatch arrangements, partner company networks, and IT business systems to operate client companies’ workflows continuously.
The Company’s strengths include talent integration, operational quality, business standardization, use of IT Business, and field networks that support 24/7/365 response. Because changing outsourcing providers involves transfer costs and the risk of quality deterioration, customer relationships tend to continue. If price revisions and the acquisition of higher-value-added projects progress, the structure can lead not only to higher sales but also to higher margins.
Key financial data
| Unit: million yen | 2022 | 2023 | 2024 | 2025 | 2026 | 2027 CE |
| Sales | 46,744 | 54,563 | 58,739 | 63,720 | 70,911 | 76,000 |
| EBIT (Operating Income) | 6,783 | 7,814 | 7,922 | 7,961 | 8,870 | |
| Pretax Income | 7,118 | 8,375 | 9,093 | 8,405 | 9,812 | |
| Net Profit Attributable to Owner of Parent | 4,357 | 5,319 | 5,791 | 4,870 | 5,920 | 5,920 |
| Cash & Short-Term Investments | 18,238 | 21,671 | 22,790 | 23,408 | 28,073 | |
| Total assets | 54,029 | 60,273 | 67,836 | 71,591 | 82,244 | |
| Total Debt | 1,373 | 469 | 381 | 321 | 6,166 | |
| Net Debt | -16,865 | -21,202 | -22,409 | -23,086 | -21,907 | |
| Total liabilities | 17,463 | 18,455 | 20,612 | 21,949 | 29,758 | |
| Total Shareholders’ Equity | 34,517 | 39,329 | 44,300 | 46,292 | 48,637 | |
| Net Operating Cash Flow | 6,610 | 7,888 | 5,884 | 7,841 | 10,467 | |
| Capital Expenditure | 3,905 | 2,458 | 3,140 | 3,444 | 6,362 | |
| Net Investing Cash Flow | -4,346 | -2,539 | -2,614 | -3,870 | -6,913 | |
| Net Financing Cash Flow | -764 | -2,250 | -2,377 | -3,197 | 776 | |
| Free Cash Flow | 2,706 | 5,430 | 2,744 | 4,397 | 4,105 | |
| ROA (%) | 8.65 | 9.31 | 9.04 | 6.99 | 7.70 | |
| ROE (%) | 13.29 | 14.40 | 13.85 | 10.75 | 12.47 | |
| EPS (Yen) | 34.0 | 41.6 | 45.3 | 38.3 | 47.0 | 47.5 |
| BPS (Yen) | 270.5 | 307.3 | 347.8 | 365.1 | 389.9 | |
| Dividend per Share (Yen) | 8.50 | 11.00 | 12.00 | 24.00 | 26.00 | 28.00 |
| Shares Outstanding (Million shares) | 128.19 | 128.45 | 128.68 | 128.68 | 127.18 |
Source: Calculated by Omega Investment based on FactSet’s standard criteria, rounded to the nearest whole number.
Share price

Key stock price data
Financial data (quarterly basis)
| Unit: million yen | 2025/3 | 2026/3 | 2027/3 | ||||||
| 1Q | 2Q | 3Q | 4Q | 1Q | 2Q | 3Q | 4Q | 1Q | |
| (Income Statement) | |||||||||
| Sales | 15,049 | 15,721 | 16,831 | 16,119 | 16,724 | 17,677 | 18,221 | 18,290 | 18,173 |
| Year-on-year | 8.1% | 5.9% | 12.3% | 7.5% | 11.1% | 12.4% | 8.3% | 13.5% | 8.7% |
| Cost of Goods Sold (COGS) | 11,836 | 12,277 | 12,988 | 12,581 | 13,257 | 13,798 | 14,135 | 14,405 | 14,244 |
| Gross Income | 3,213 | 3,444 | 3,843 | 3,538 | 3,467 | 3,879 | 4,086 | 3,885 | 3,929 |
| Gross Income Margin | 21.4% | 21.9% | 22.8% | 21.9% | 20.7% | 21.9% | 22.4% | 21.2% | 21.6% |
| SG&A Expense | 1,483 | 1,444 | 1,573 | 1,571 | 1,532 | 1,558 | 1,662 | 1,696 | 1,657 |
| EBIT (Operating Income) | 1,730 | 2,000 | 2,270 | 1,967 | 1,935 | 2,321 | 2,424 | 2,189 | 2,271 |
| Year-on-year | -8.5% | 1.6% | 13.7% | -4.8% | 11.9% | 16.1% | 6.8% | 11.3% | 17.4% |
| Operating Income Margin | 11.5% | 12.7% | 13.5% | 12.2% | 11.6% | 13.1% | 13.3% | 12.0% | 12.5% |
| EBITDA | 2,244 | 2,572 | 2,883 | 2,595 | 2,530 | 2,936 | 3,102 | 2,892 | 2,927 |
| Pretax Income | 1,663 | 2,283 | 2,454 | 2,006 | 2,015 | 2,669 | 2,735 | 2,394 | 2,357 |
| Consolidated Net Income | 917 | 1,617 | 1,591 | 1,390 | 1,192 | 1,860 | 1,713 | 1,944 | 1,384 |
| Minority Interest | 132 | 171 | 157 | 185 | 179 | 212 | 183 | 216 | 210 |
| Net Income ATOP | 786 | 1,446 | 1,434 | 1,205 | 1,013 | 1,649 | 1,530 | 1,728 | 1,174 |
| Year-on-year | -26.9% | 12.7% | -4.2% | -37.8% | 28.9% | 14.0% | 6.7% | 43.5% | 15.9% |
| Net Income Margin | 5.2% | 9.2% | 8.5% | 7.5% | 6.1% | 9.3% | 8.4% | 9.4% | 6.5% |
| (Balance Sheet) | |||||||||
| Cash & Short-Term Investments | 22,551 | 22,220 | 21,961 | 23,408 | 24,715 | 26,941 | 28,222 | 28,073 | 29,995 |
| Total assets | 69,365 | 69,254 | 70,794 | 71,591 | 75,493 | 77,896 | 82,027 | 82,244 | 84,300 |
| Total Debt | 250 | 188 | 188 | 321 | 4,686 | 4,561 | 8,868 | 6,166 | 8,564 |
| Net Debt | -22,301 | -22,033 | -21,774 | -23,086 | -20,030 | -22,379 | -19,354 | -21,907 | -21,431 |
| Total liabilities | 21,349 | 20,756 | 21,659 | 21,949 | 26,685 | 27,154 | 31,207 | 29,758 | 31,518 |
| Total Shareholders’ Equity | 45,057 | 45,372 | 45,972 | 46,292 | 45,433 | 47,146 | 47,197 | 48,637 | 48,766 |
| (Profitability %) | |||||||||
| ROA | 8.34 | 8.43 | 8.27 | 6.99 | 7.04 | 7.20 | 7.06 | 7.70 | 7.61 |
| ROE | 12.87 | 12.95 | 12.73 | 10.75 | 11.27 | 11.46 | 11.58 | 12.47 | 12.91 |
| (Per-share) Unit: JPY | |||||||||
| EPS | 6.2 | 11.3 | 11.3 | 9.5 | 8.0 | 13.0 | 12.2 | 13.9 | 9.4 |
| BPS | 353.7 | 355.8 | 362.0 | 365.1 | 358.9 | 373.7 | 376.4 | 389.9 | 391.0 |
| Dividend per Share | 0.00 | 12.00 | 0.00 | 12.00 | 0.00 | 13.00 | 0.00 | 13.00 | 0.00 |
| Shares Outstanding(million shares) | 128.68 | 128.68 | 128.68 | 128.68 | 127.18 | 127.18 | 127.18 | 127.18 | 127.18 |
Source: Calculated by Omega Investment based on FactSet’s standard criteria, rounded to the nearest whole number.
Financial data (full-year basis)
| Unit: million yen | 2017 | 2018 | 2019 | 2020 | 2021 | 2022 | 2023 | 2024 | 2025 | 2026 |
| (Income Statement) | ||||||||||
| Sales | 29,478 | 33,119 | 37,196 | 42,378 | 40,618 | 46,744 | 54,563 | 58,739 | 63,720 | 70,911 |
| Year-on-year | 7.9% | 12.4% | 12.3% | 13.9% | -4.2% | 15.1% | 16.7% | 7.7% | 8.5% | 11.3% |
| Cost of Goods Sold | 22,389 | 25,477 | 28,837 | 33,392 | 31,422 | 35,441 | 41,264 | 44,981 | 49,682 | 55,594 |
| Gross Income | 7,089 | 7,642 | 8,359 | 8,985 | 9,195 | 11,303 | 13,299 | 13,757 | 14,038 | 15,317 |
| Gross Income Margin | 24.0% | 23.1% | 22.5% | 21.2% | 22.6% | 24.2% | 24.4% | 23.4% | 22.0% | 21.6% |
| SG&A Expense | 3,321 | 3,412 | 3,672 | 4,052 | 3,962 | 4,461 | 5,471 | 5,836 | 6,076 | 6,447 |
| EBIT (Operating Income) | 3,755 | 4,226 | 4,678 | 4,934 | 5,185 | 6,783 | 7,814 | 7,922 | 7,961 | 8,870 |
| Year-on-year | 12.2% | 12.5% | 10.7% | 5.5% | 5.1% | 30.8% | 15.2% | 1.4% | 0.3% | 11.6% |
| Operating Income Margin | 12.7% | 12.8% | 12.6% | 11.6% | 12.8% | 14.5% | 14.3% | 13.5% | 12.5% | 12.5% |
| EBITDA | 4,724 | 5,194 | 5,674 | 6,041 | 6,340 | 8,307 | 9,627 | 9,926 | 10,274 | 11,460 |
| Pretax Income | 4,154 | 4,594 | 4,839 | 5,345 | 5,343 | 7,118 | 8,375 | 9,093 | 8,405 | 9,812 |
| Consolidated Net Income | 2,883 | 3,146 | 3,416 | 3,497 | 3,305 | 4,707 | 5,775 | 6,379 | 5,515 | 6,709 |
| Minority Interest | 94 | 209 | 231 | 304 | 337 | 350 | 457 | 587 | 645 | 789 |
| Net Income ATOP | 2,789 | 2,937 | 3,185 | 3,193 | 2,969 | 4,357 | 5,319 | 5,791 | 4,870 | 5,920 |
| Year-on-year | 4.5% | 5.3% | 8.5% | 0.2% | -7.0% | 46.8% | 22.1% | 8.9% | -15.9% | 21.6% |
| Net Income Margin | 9.5% | 8.9% | 8.6% | 7.5% | 7.3% | 9.3% | 9.7% | 9.9% | 7.6% | 8.3% |
| (Balance Sheet) | ||||||||||
| Cash & Short-Term Investments | 11,751 | 14,184 | 15,015 | 17,089 | 16,310 | 18,238 | 21,671 | 22,790 | 23,408 | 28,073 |
| Total assets | 30,186 | 34,131 | 39,024 | 42,892 | 46,756 | 54,029 | 60,273 | 67,836 | 71,591 | 82,244 |
| Total Debt | 605 | 358 | 1,160 | 916 | 567 | 1,373 | 469 | 381 | 321 | 6,166 |
| Net Debt | -11,146 | -13,827 | -13,856 | -16,173 | -15,744 | -16,865 | -21,202 | -22,409 | -23,086 | -21,907 |
| Total liabilities | 8,100 | 9,052 | 11,284 | 12,990 | 13,867 | 17,463 | 18,455 | 20,612 | 21,949 | 29,758 |
| Total Shareholders’ Equity | 21,240 | 23,945 | 26,430 | 28,363 | 31,072 | 34,517 | 39,329 | 44,300 | 46,292 | 48,637 |
| (Cash Flow) | ||||||||||
| Net Operating Cash Flow | 3,032 | 4,324 | 3,571 | 5,934 | 4,631 | 6,610 | 7,888 | 5,884 | 7,841 | 10,467 |
| Capital Expenditure | 1,159 | 702 | 2,423 | 2,927 | 3,568 | 3,905 | 2,458 | 3,140 | 3,444 | 6,362 |
| Net Investing Cash Flow | -852 | -1,817 | -2,744 | -2,797 | -4,137 | -4,346 | -2,539 | -2,614 | -3,870 | -6,913 |
| Net Financing Cash Flow | 1,042 | -166 | -79 | -1,267 | -1,357 | -764 | -2,250 | -2,377 | -3,197 | 776 |
| Free Cash Flow | 1,873 | 3,621 | 1,148 | 3,007 | 1,063 | 2,706 | 5,430 | 2,744 | 4,397 | 4,105 |
| (Profitability ) | ||||||||||
| ROA (%) | 9.93 | 9.13 | 8.71 | 7.80 | 6.62 | 8.65 | 9.31 | 9.04 | 6.99 | 7.70 |
| ROE (%) | 14.31 | 13.00 | 12.65 | 11.66 | 9.99 | 13.29 | 14.40 | 13.85 | 10.75 | 12.47 |
| Net Margin (%) | 9.46 | 8.87 | 8.56 | 7.54 | 7.31 | 9.32 | 9.75 | 9.86 | 7.64 | 8.35 |
| Asset Turn | 1.05 | 1.03 | 1.02 | 1.03 | 0.91 | 0.93 | 0.95 | 0.92 | 0.91 | 0.92 |
| Assets/Equity | 1.44 | 1.42 | 1.45 | 1.50 | 1.51 | 1.54 | 1.55 | 1.53 | 1.54 | 1.62 |
| (Per-share) Unit: JPY | ||||||||||
| EPS | 22.0 | 23.0 | 24.9 | 25.0 | 23.2 | 34.0 | 41.6 | 45.3 | 38.3 | 47.0 |
| BPS | 167.0 | 187.5 | 206.6 | 221.5 | 242.5 | 270.5 | 307.3 | 347.8 | 365.1 | 389.9 |
| Dividend per Share | 4.50 | 6.00 | 6.50 | 7.00 | 7.00 | 8.50 | 11.00 | 12.00 | 24.00 | 26.00 |
| Shares Outstanding(million shares) | 126.75 | 127.66 | 127.88 | 128.02 | 128.06 | 128.19 | 128.45 | 128.68 | 128.68 | 127.18 |
Source: Calculated by Omega Investment based on FactSet’s standard criteria, rounded to the nearest whole number.