2026-10-16
Home
Japanese

Omega Investment Co., Ltd.
SUMIDA CORPORATION (Company note – 2Q update)

| Share price (8/24) | ¥1,227 | Dividend Yield (12/26 CE) | 4.3 % |
| 52weeks high/low | ¥1,626/1,028 | ROE(12/25) | 6.0 % |
| Avg Vol (3 month) | 311.0 thou shrs | Operating margin (12/25) | 5.1 % |
| Market Cap | ¥40.67 bn | Beta (5Y Monthly) | 1.02 |
| Enterprise Value | ¥102.01 bn | Shares Outstanding | 33.148 mn shrs |
| PER (12/26 CE) | 11.12 X | Listed market | TSE Prime section |
| PBR (12/25 act) | 0.64 X |
| Click here for the PDF version of this page |
| PDF version |
Revenue remains on an upward trend, but the Company recorded product compensation provisions for certain products. It aims to make up ground in the second half.
◇Highlights of the results for the second quarter (first half) of FY12/2026: earnings deteriorated due to product compensation provisions
The results for the second quarter (first half) of FY12/2026 that SUMIDA CORPORATION (the “Company”) announced on July 31, 2026, showed double-digit YoY growth in revenue. However, a quality issue occurred in certain products for automotive-related applications, and the Company took financial measures, including recording product compensation provisions of approximately 1.0 billion yen for amounts expected to arise in the future, resulting in a substantial decline in profit.
Revenue for the first half was 79.86 billion yen (up 12.2% YoY), operating profit was 1.91 billion yen (down 43.2% YoY), and interim profit before income taxes was 0.57 billion yen (down 73.7% YoY). Interim profit attributable to owners of the parent was 0.24 billion yen (down 85.6% YoY).
The key points of these results are as follows.
First, the quality issue appears to be limited to specific products, and from a financial perspective, the Company swiftly recorded provisions, including expected future amounts, related to inventory disposal and sorting. In light of this matter, the Company is fundamentally and comprehensively reviewing its quality assurance system and proceeding with improvements. Therefore, the risk that the foundation of the Company’s business, namely contract manufacturing of custom products, will be shaken can be regarded as low.
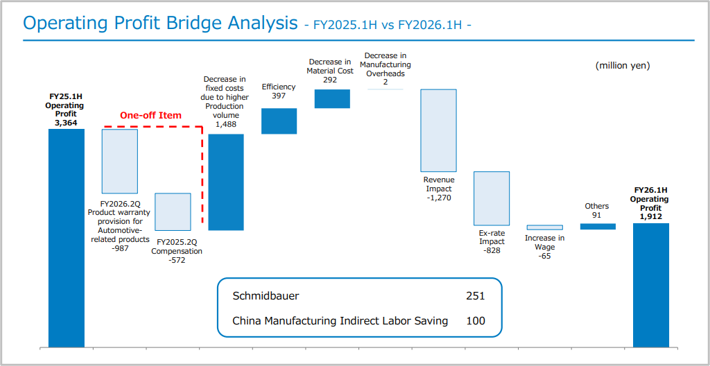
Second, underlying operating profit was solid. As shown in the following chart, first-half operating profit of 1.91 billion yen increased by approximately 0.1 billion yen YoY on an underlying basis, excluding temporary factors. Improved capacity utilization driven by revenue growth and cost reductions steadily materialized, offsetting the delayed launch of mass production for acquired projects and the impact of a stronger Chinese yuan and weaker U.S. dollar. The performance of Schmidbauer, which the Company acquired in the previous fiscal year, is also solid.
Source: Company materials
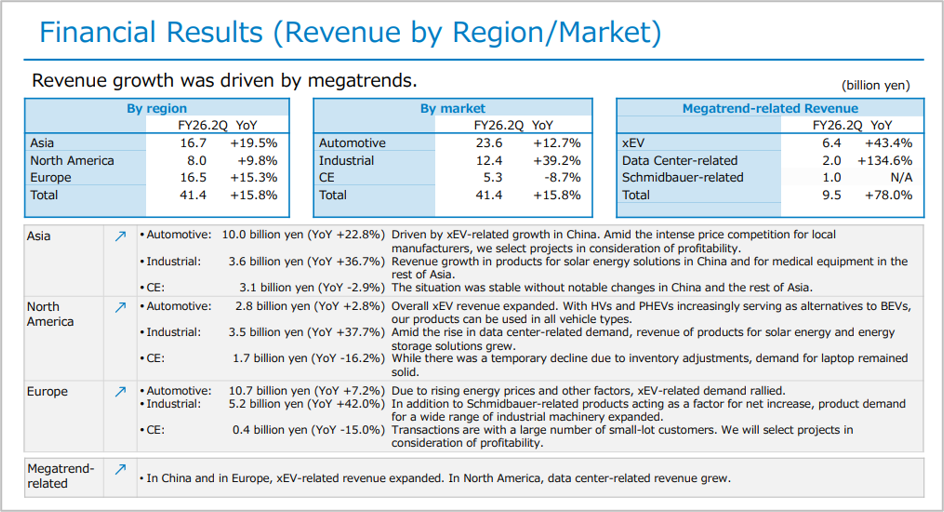
Third, megatrends are driving the Company’s revenue growth, namely growth in xEV-related areas in China and Europe and growth in data center-related areas in North America.
Inventory trends have remained stable. Inventory turnover days were 88 days in the most recent quarter and have been almost flat for three quarters. On the other hand, CCC was 93 days, a decrease (improvement) compared with the immediately preceding quarter.
Source: Company materials
◇FY12/2026 earnings forecast: unchanged. The Company aims to make up ground through the swift launch of mass production for acquired projects, price revisions, and cost control
The full-year earnings forecast remains unchanged. The forecasts are revenue of 156.00 billion yen (up 6.0% YoY), operating profit of 7.50 billion yen (up 0.8% YoY), profit before income taxes of 4.85 billion yen (up 0.4% YoY), and profit attributable to owners of the parent of 3.65 billion yen (up 0.9% YoY). Basic earnings per share remain unchanged at 110.40 yen, and the annual dividend per share is 53 yen.
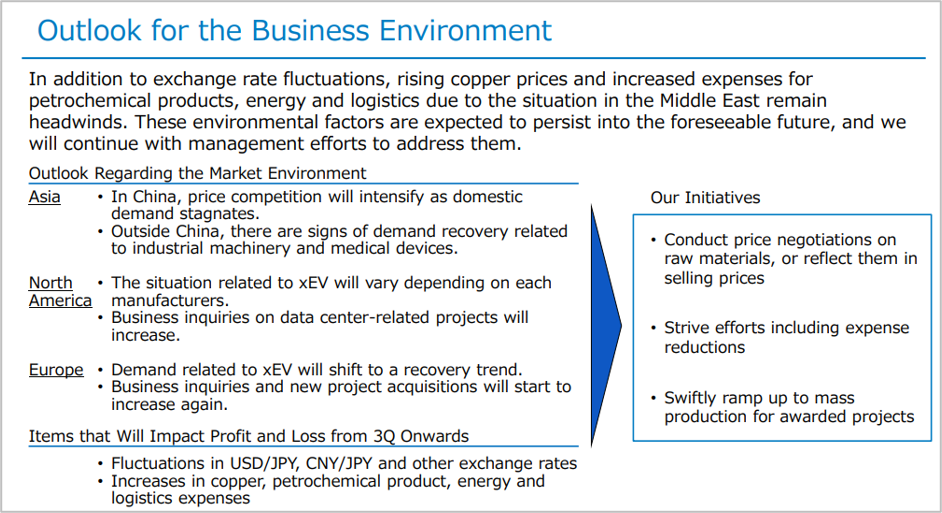
The hurdle for this full-year plan is not low. Although the tailwinds from megatrends confirmed in the first half are expected to continue in the second half, factors such as foreign exchange, copper prices, and other cost increases are expected. For this reason, the Company aims to make up ground by swiftly launching mass production for acquired projects and improving its sales mix, proceeding with raw material price negotiations and reflecting them in selling prices, and continuing management efforts such as cost control.
Source: Company materials
◇Topics: joint development of next-generation power conversion systems with Germany’s Infineon
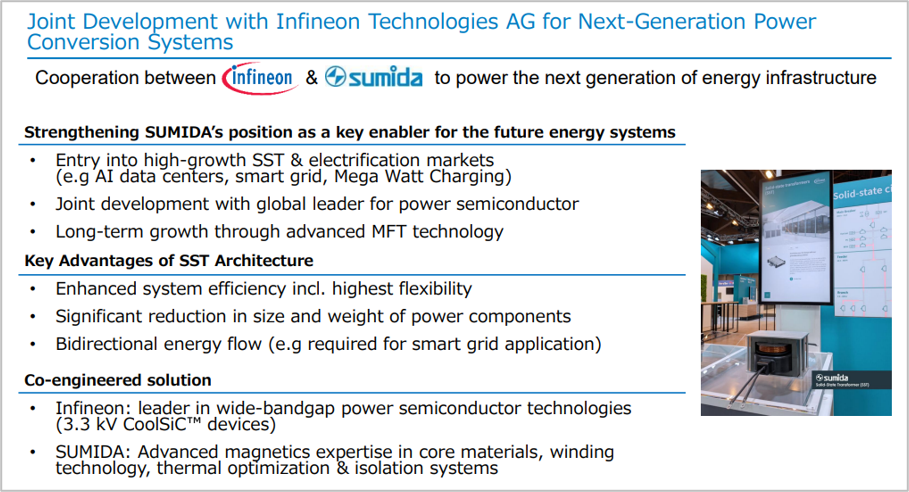
On July 31, 2026, the Company announced the joint development of next-generation power conversion systems with Germany’s Infineon. By combining Infineon’s power semiconductor technology with the Company’s expertise in high-performance magnetic components, the two companies will jointly develop medium-frequency transformers (MFTs), core components of Solid-State Transformer (SST) systems expected to become next-generation power conversion technology. Compared with conventional transformers, this technology is expected to provide smaller size and lighter weight, reduced power loss, enhanced bidirectional power transmission capabilities (realizing efficient smart grids), and high flexibility, thereby responding to requirements such as AI data centers, ultra-fast charging infrastructure, and the modernization of power transmission and distribution grids. Future progress will attract attention.
Source: Company materials
◇Stock price trends and points to watch going forward
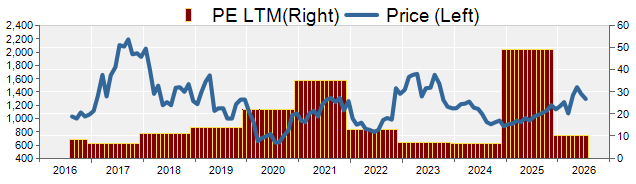
The Company’s share price has followed a gradual long-term upward trend and hit a recent high of 1,626 yen on June 5, 2026. However, it subsequently turned downward, falling to 1,121 yen immediately after the announcement of these results, and has recently recovered to the 1,200-yen range. The long-term upward trend has been maintained. Given a PER based on the Company’s forecast of 12x, a PBR of 0.69x, and a forecast dividend yield of 4.0%, downside risk for the share price is limited, and the current share price appears to be in a phase of waiting for an improvement in earnings and ROE.
Based on the above, the points to watch going forward are as follows.
- Fundamental resolution of the quality issue: the quality issue this time is conclusively resolved as an individual case and does not hinder the acquisition of strategic projects going forward.
- A recovery toward achieving the FY12/2026 full-year forecast: the swift launch of mass production for acquired projects and efforts to improve the sales mix, raw material price negotiations and their reflection in selling prices, and continued management efforts such as cost control will progress as the Company intends, leading to progress in the earnings recovery.
- Continuous accumulation of acquired projects: newly acquired projects, which are a leading indicator of the Company’s medium-term earnings, should steadily accumulate in line with the Mid-Term Business Plan. Specifically, the status of project wins in xEV-related, solar power generation-related, and AI data center-related areas will attract attention. We would also like to see synergy effects with Schmidbauer.
- Whether FY12/2027 earnings will begin to accelerate: growth should accelerate toward the targets of the “Mid-Term Business Plan 2026-2028,” namely revenue of 190.0 billion yen, operating profit of 13.5 billion yen, and ROE of 8.4% or higher. We would like to see this become a catalyst for the share price to move toward a PBR of 1x, adding momentum to its upward trend.
Attention must also be paid to fluctuations in exchange rates and in the prices of key raw materials, such as copper.
Company profile
Since its founding in 1950, the Company has been a global leader in designing and manufacturing coil-related components and modules for more than 75 years. Leveraging strengths such as advanced technical design capabilities, proprietary manufacturing know-how, broad application versatility, and a global production structure, the Company engages in contract manufacturing of custom-made coils for major customers worldwide under a Made in Market model. Its business is appropriately diversified across both geography and market segments.
In recent years, the Company has grown earnings in “green energy-related” fields, but as business uncertainty has increased, it experienced a temporary pause in earnings. However, it has moved quickly to improve its cost structure and has also made progress in capturing external growth through the acquisition of Schmidbauer, placing earnings on a recovery track.
In 2026, the Company announced that it would promote the Niche-Top Strategy over the long term and, for the time being, announced the Mid-Term Business Plan 2026-2028. Based on its favorable cost structure, the Company aims to translate a broad range of megatrends into projects, including green energy-related fields, power grids, means of transportation, data centers, healthcare, robotics, and other fields, and to lay the groundwork for product development aimed at becoming a niche-top player. Its commitment to improving capital efficiency is also clear.
The share price has maintained its long-term upward trend, and if ROE in the 8% range becomes visible, PBR exceeding 1x can be expected first.
Key financial data
| Unit: million yen | 2021 | 2022 | 2023 | 2024 | 2025 | 2026 CE |
| Sales | 104,920 | 138,600 | 147,672 | 143,978 | 147,194 | 156,000 |
| EBIT (Operating Income) | 5,669 | 7,983 | 8,829 | 5,633 | 8,084 | |
| Pretax Income | 3,898 | 6,534 | 5,856 | 1,295 | 4,830 | 4,850 |
| Net Profit Attributable to Owner of Parent | 2,629 | 5,099 | 5,064 | 590 | 3,618 | 3,650 |
| Cash & Short-Term Investments | 4,237 | 2,944 | 3,107 | 4,286 | 6,129 | |
| Total assets | 117,725 | 134,846 | 142,786 | 147,766 | 163,656 | |
| Total Debt | 54,763 | 58,546 | 57,198 | 57,975 | 64,023 | |
| Net Debt | 50,526 | 55,602 | 54,091 | 53,689 | 57,894 | |
| Total liabilities | 77,622 | 85,966 | 85,471 | 86,849 | 98,298 | |
| Total Shareholders’ Equity | 38,338 | 46,829 | 55,056 | 58,648 | 62,008 | |
| Net Operating Cash Flow | 600 | 10,566 | 18,343 | 14,928 | 16,457 | |
| Capital Expenditure | 6,737 | 9,174 | 10,914 | 9,005 | 7,347 | |
| Net Investing Cash Flow | -6,712 | -8,174 | -10,702 | -8,834 | -12,886 | |
| Net Financing Cash Flow | 4,751 | -4,130 | -7,782 | -5,268 | -1,958 | |
| Free Cash Flow | -5,212 | 2,362 | 8,539 | 7,068 | 10,224 | |
| ROA (%) | 2.44 | 4.04 | 3.65 | 0.41 | 2.32 | |
| ROE (%) | 7.37 | 11.98 | 9.94 | 1.04 | 6.00 | |
| EPS (Yen) | 96.7 | 187.5 | 167.4 | 17.9 | 109.4 | 110.4 |
| BPS (Yen) | 1,409.8 | 1,722.1 | 1,687.4 | 1,774.6 | 1,875.5 | |
| Dividend per Share (Yen) | 28.00 | 47.00 | 51.00 | 53.00 | 53.00 | 53.00 |
| Shares Outstanding (Million shares) | 27.44 | 27.44 | 32.88 | 33.10 | 33.11 |
Source: Calculated by Omega Investment based on FactSet’s standard criteria, rounded to the nearest whole number.
Share price
Financial data (quarterly basis)
| Unit: million yen | 2024/12 | 2025/12 | 2026/12 | ||||||
| 2Q | 3Q | 4Q | 1Q | 2Q | 3Q | 4Q | 1Q | 2Q | |
| (Income Statement) | |||||||||
| Sales | 36,752 | 36,470 | 34,442 | 35,390 | 35,780 | 36,906 | 39,118 | 38,428 | 41,430 |
| Year-on-year | -2.4% | -3.3% | -6.3% | -2.5% | -2.6% | 1.2% | 13.6% | 8.6% | 15.8% |
| Cost of Goods Sold (COGS) | 32,263 | 31,656 | 30,037 | 31,007 | 30,524 | 31,618 | 33,121 | 33,501 | 36,218 |
| Gross Income | 4,489 | 4,814 | 4,405 | 4,383 | 5,256 | 5,288 | 5,997 | 4,927 | 5,212 |
| Gross Income Margin | 12.2% | 13.2% | 12.8% | 12.4% | 14.7% | 14.3% | 15.3% | 12.8% | 12.6% |
| SG&A Expense | 3,353 | 3,091 | 2,713 | 3,151 | 3,059 | 3,154 | 3,476 | 3,472 | 3,728 |
| EBIT (Operating Income) | 1,136 | 1,723 | 1,692 | 1,232 | 2,197 | 2,134 | 2,521 | 1,455 | 1,484 |
| Year-on-year | -56.2% | -40.1% | 47.3% | 14.0% | 93.4% | 23.9% | 49.0% | 18.1% | -32.5% |
| Operating Income Margin | 3.1% | 4.7% | 4.9% | 3.5% | 6.1% | 5.8% | 6.4% | 3.8% | 3.6% |
| EBITDA | 3,956 | 4,552 | 4,439 | 3,809 | 5,618 | 4,662 | 5,876 | 4,328 | 4,405 |
| Pretax Income | 268 | 951 | -389 | 802 | 1,372 | 1,455 | 1,201 | 900 | -329 |
| Consolidated Net Income | 114 | 710 | -703 | 580 | 1,053 | 965 | 984 | 743 | -478 |
| Minority Interest | -23 | -46 | -52 | -5 | -29 | -45 | 44 | 16 | 9 |
| Net Income ATOP | 137 | 756 | -652 | 585 | 1,082 | 1,010 | 941 | 726 | -486 |
| Year-on-year | -93.3% | -30.2% | -192.9% | 68.1% | 689.8% | 33.6% | -244.3% | 24.1% | -144.9% |
| Net Income Margin | 0.4% | 2.1% | -1.9% | 1.7% | 3.0% | 2.7% | 2.4% | 1.9% | -1.2% |
| (Balance Sheet) | |||||||||
| Cash & Short-Term Investments | 5,156 | 4,750 | 4,286 | 6,087 | 5,429 | 12,256 | 6,129 | 6,527 | 6,027 |
| Total assets | 159,600 | 143,335 | 147,766 | 144,110 | 142,062 | 151,308 | 163,656 | 164,914 | 169,005 |
| Total Debt | 65,509 | 58,303 | 57,975 | 58,367 | 57,039 | 62,193 | 64,023 | 67,548 | 66,991 |
| Net Debt | 60,353 | 53,553 | 53,689 | 52,280 | 51,610 | 49,937 | 57,894 | 61,021 | 60,964 |
| Total liabilities | 95,474 | 85,403 | 86,849 | 85,709 | 83,098 | 90,181 | 98,298 | 100,941 | 104,162 |
| Total Shareholders’ Equity | 61,653 | 55,751 | 58,648 | 56,205 | 56,801 | 58,947 | 62,008 | 62,757 | 63,606 |
| (Profitability %) | |||||||||
| ROA | 1.46 | 1.33 | 0.41 | 0.56 | 1.17 | 1.38 | 2.32 | 2.43 | 1.41 |
| ROE | 3.74 | 3.32 | 1.04 | 1.45 | 2.99 | 3.53 | 6.00 | 6.32 | 3.64 |
| (Per-share) Unit: JPY | |||||||||
| EPS | 4.2 | 22.9 | -19.7 | 17.7 | 32.7 | 30.6 | 28.5 | 21.9 | -14.7 |
| BPS | 1,867.5 | 1,687.0 | 1,774.6 | 1,700.6 | 1,718.1 | 1,783.0 | 1,875.5 | 1,896.0 | 1,921.6 |
| Dividend per Share | 26.00 | 0.00 | 27.00 | 0.00 | 26.00 | 0.00 | 27.00 | 0.00 | 26.00 |
| Shares Outstanding (million shares) | 33.04 | 33.10 | 33.10 | 33.10 | 33.11 | 33.11 | 33.11 | 33.15 | 33.15 |
Source: Calculated by Omega Investment based on FactSet’s standard criteria, rounded to the nearest whole number.
Financial data (full-year basis)
| Unit: million yen | 2016 | 2017 | 2018 | 2019 | 2020 | 2021 | 2022 | 2023 | 2024 | 2025 |
| (Income Statement) | ||||||||||
| Sales | 81,052 | 90,153 | 97,538 | 94,283 | 84,417 | 104,920 | 138,600 | 147,672 | 143,978 | 147,194 |
| Year-on-year | -6.0% | 11.2% | 8.2% | -3.3% | -10.5% | 24.3% | 32.1% | 6.5% | -2.5% | 2.2% |
| Cost of Goods Sold | 66,191 | 75,019 | 82,192 | 81,414 | 73,319 | 89,563 | 119,298 | 126,561 | 125,970 | 126,270 |
| Gross Income | 14,861 | 15,134 | 15,346 | 12,869 | 11,098 | 15,357 | 19,302 | 21,111 | 18,008 | 20,924 |
| Gross Income Margin | 18.3% | 16.8% | 15.7% | 13.6% | 13.1% | 14.6% | 13.9% | 14.3% | 12.5% | 14.2% |
| SG&A Expense | 8,507 | 8,837 | 9,694 | 9,330 | 8,798 | 9,688 | 11,319 | 12,282 | 12,375 | 12,840 |
| EBIT (Operating Income) | 6,354 | 6,297 | 5,652 | 3,539 | 2,300 | 5,669 | 7,983 | 8,829 | 5,633 | 8,084 |
| Year-on-year | 50.0% | -0.9% | -10.2% | -37.4% | -35.0% | 146.5% | 40.8% | 10.6% | -36.2% | 43.5% |
| Operating Income Margin | 7.8% | 7.0% | 5.8% | 3.8% | 2.7% | 5.4% | 5.8% | 6.0% | 3.9% | 5.5% |
| EBITDA | 9,251 | 9,574 | 9,660 | 8,848 | 8,247 | 12,337 | 16,103 | 18,190 | 16,655 | 19,965 |
| Pretax Income | 5,469 | 5,697 | 4,061 | 2,184 | 1,470 | 3,898 | 6,534 | 5,856 | 1,295 | 4,830 |
| Consolidated Net Income | 3,844 | 4,628 | 2,531 | 1,596 | 839 | 2,695 | 5,168 | 5,102 | 434 | 3,582 |
| Minority Interest | 178 | 123 | 110 | 13 | 11 | 66 | 68 | 37 | -156 | -35 |
| Net Income ATOP | 3,666 | 4,504 | 2,420 | 1,582 | 828 | 2,629 | 5,099 | 5,064 | 590 | 3,618 |
| Year-on-year | 80.4% | 22.9% | -46.3% | -34.6% | -47.7% | 217.5% | 94.0% | -0.7% | -88.3% | 513.2% |
| Net Income Margin | 4.5% | 5.0% | 2.5% | 1.7% | 1.0% | 2.5% | 3.7% | 3.4% | 0.4% | 2.5% |
| (Balance Sheet) | ||||||||||
| Cash & Short-Term Investments | 3,546 | 5,375 | 4,098 | 3,286 | 5,237 | 4,237 | 2,944 | 3,107 | 4,286 | 6,129 |
| Total assets | 69,007 | 84,366 | 94,277 | 96,561 | 98,063 | 117,725 | 134,846 | 142,786 | 147,766 | 163,656 |
| Total Debt | 30,611 | 35,836 | 40,206 | 43,646 | 44,586 | 54,763 | 58,546 | 57,198 | 57,975 | 64,023 |
| Net Debt | 27,065 | 30,461 | 36,108 | 40,360 | 39,349 | 50,526 | 55,602 | 54,091 | 53,689 | 57,894 |
| Total liabilities | 46,982 | 54,242 | 58,835 | 61,963 | 63,503 | 77,622 | 85,966 | 85,471 | 86,849 | 98,298 |
| Total Shareholders’ Equity | 20,629 | 28,570 | 33,829 | 33,013 | 32,990 | 38,338 | 46,829 | 55,056 | 58,648 | 62,008 |
| (Cash Flow) | ||||||||||
| Net Operating Cash Flow | 8,291 | 3,658 | 4,672 | 8,732 | 9,107 | 600 | 10,566 | 18,343 | 14,928 | 16,457 |
| Capital Expenditure | 5,024 | 9,511 | 9,610 | 8,302 | 6,765 | 6,737 | 9,174 | 10,914 | 9,005 | 7,347 |
| Net Investing Cash Flow | -4,961 | -9,254 | -15,153 | -8,133 | -6,669 | -6,712 | -8,174 | -10,702 | -8,834 | -12,886 |
| Net Financing Cash Flow | -3,016 | 7,389 | 9,477 | -1,261 | -447 | 4,751 | -4,130 | -7,782 | -5,268 | -1,958 |
| Free Cash Flow | 3,941 | -5,173 | -3,769 | 1,379 | 3,118 | -5,212 | 2,362 | 8,539 | 7,068 | 10,224 |
| (Profitability ) | ||||||||||
| ROA (%) | 5.36 | 5.87 | 2.71 | 1.66 | 0.85 | 2.44 | 4.04 | 3.65 | 0.41 | 2.32 |
| ROE (%) | 19.27 | 18.31 | 7.76 | 4.74 | 2.51 | 7.37 | 11.98 | 9.94 | 1.04 | 6.00 |
| Net Margin (%) | 4.52 | 5.00 | 2.48 | 1.68 | 0.98 | 2.51 | 3.68 | 3.43 | 0.41 | 2.46 |
| Asset Turn | 1.18 | 1.18 | 1.09 | 0.99 | 0.87 | 0.97 | 1.10 | 1.06 | 0.99 | 0.95 |
| Assets/Equity | 3.60 | 3.12 | 2.86 | 2.86 | 2.95 | 3.03 | 2.97 | 2.72 | 2.56 | 2.58 |
| (Per-share) Unit: JPY | ||||||||||
| EPS | 157.9 | 176.4 | 90.2 | 58.3 | 30.5 | 96.7 | 187.5 | 167.4 | 17.9 | 109.4 |
| BPS | 888.8 | 1,069.6 | 1,250.0 | 1,216.1 | 1,213.7 | 1,409.8 | 1,722.1 | 1,687.4 | 1,774.6 | 1,875.5 |
| Dividend per Share | 34.00 | 45.00 | 27.00 | 24.00 | 9.00 | 28.00 | 47.00 | 51.00 | 53.00 | 53.00 |
| Shares Outstanding (million shares) | 23.94 | 27.44 | 27.44 | 27.44 | 27.44 | 27.44 | 27.44 | 32.88 | 33.10 | 33.11 |
Source: Calculated by Omega Investment based on FactSet’s standard criteria, rounded to the nearest whole number.