2026-10-23
Home
Japanese

Omega Investment Co., Ltd.
TOKYO ELECTRON DEVICE (Investment report – 1Q update)
| Share price (8/7) | ¥4,400 | Dividend Yield (27/3 CE) | 2.9 % |
| 52weeks high/low | ¥2,645/4,730 | ROE(26/3 act) | 15.6 % |
| Avg Vol (3 month) | 219.3 thou shrs | Operating income margin (26/3 act) | 5.0 % |
| Market Cap | ¥137.88 bn | Beta (5Y Monthly) | 0.69 |
| Enterprise Value | ¥140.49 bn | Shares Outstanding | 31.336 mn shrs |
| PER (27/3 CE) | 13.8 X | Listed market | TSE Prime section |
| PBR (26/3 act) | 2.4 X |
| Click here for the PDF version of this page |
| PDF version |
EC Business profitability improves markedly. Earnings recovery accompanied by order growth.
Investment conclusion
The first quarter results were sufficient to warrant raising our previous investment conclusion. A recovery in demand, improved profit margins, and an increase in orders in the EC Business were confirmed simultaneously, and the earnings recovery moved from the expectation stage to the actual results. At a share price of 3,750yen, the forecast PER is 11.8x, the actual PBR is 2.09x, and the forecast dividend yield is 3.4%. In light of the Company’s earnings power after recovery, the current stock valuation is by no means excessive. We adopt a bullish investment conclusion.
In the previous report, we indicated that equity holdings should be increased after confirming the end of the market inventory adjustment in the EC Business, an improvement in orders, and a reversal in the gross profit margin and operating profit margin. A substantial portion of those confirmation conditions has now been met. The previous cautious stance was directionally appropriate, but we were somewhat too cautious about the timing of the recovery and the pace at which profits would recover.
At the same time, the sharp increase in orders includes advance orders in anticipation of product price increases, yen depreciation, and longer lead times. In addition, the increase in working capital caused operating cash flow and net interest-bearing debt to deteriorate. Therefore, this bullish conclusion is not based on simply annualizing quarterly earnings. Our central view is that EC Business profitability will continue to improve and that orders will convert into sales.
1. Key points of the first-quarter results
In the first quarter of FY3/2027, net sales increased 33.6% YoY to 60.32 billion yen, operating income increased 179.5% to 4.07 billion yen, ordinary income increased 127.8% to 3.91 billion yen, and quarterly net income attributable to owners of parent increased 117.7% to 2.65 billion yen. The operating income margin rose from 3.2% to 6.7%.
Gross profit increased 44.2% YoY, while SG&A expenses rose only 4.8%. The effect of higher sales and an improved sales mix translated efficiently into profit. Ordinary income was below operating income because the Company recorded a foreign exchange gain in the same period of the previous year. In contrast, it recorded a foreign exchange loss in the current period, and interest expense also increased.
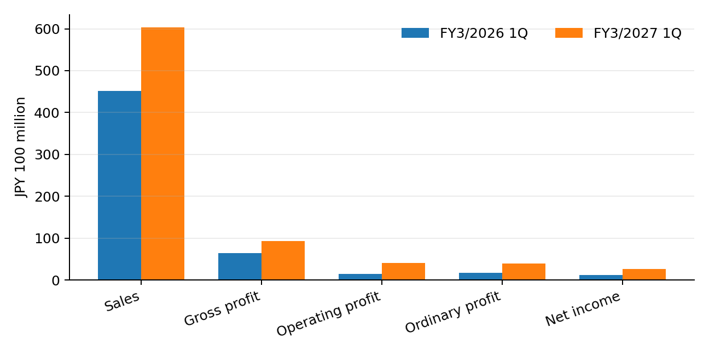
(Figure 1 : First-quarter performance comparison Unit: 100 million yen)
| Item | Same period previous year | Current quarter | Year on year | Full-year progress |
| Net sales | 45.14 bn yen | 60.32 bn yen | Up 33.6% | 25.1% |
| Gross profit | 6.45 bn yen | 9.31 bn yen | Up 44.2% | — |
| Operating income | 1.46 bn yen | 4.07 bn yen | Up 179.5% | — |
| Ordinary income | 1.72 bn yen | 3.91 bn yen | Up 127.8% | 28.7% |
| Net income | 1.22 bn yen | 2.65 bn yen | Up 117.7% | 28.2% |
| Gross profit margin | 14.3% | 15.4% | Up 1.1 pt | — |
| Operating income margin | 3.2% | 6.7% | Up 3.5 pt | — |
2. Analysis by business
The CN Business provides earnings stability
Net sales in the CN Business increased 14.0% to 9.97 billion yen, and segment profit increased 3.1% to 1.53 billion yen. Sales of network-related products, security-related products, and maintenance and monitoring services increased, while sales of storage-related products to telecommunications carriers declined. Maintenance and monitoring services accounted for 44% of sales, and this highly recurring revenue contributes to the stability of the business portfolio.
The issue is that the segment profit margin declined from 17.0% to 15.4%. Profit growth was small relative to sales growth, making it necessary to examine the product mix and project profitability. Nonetheless, the Company’s full-year sales plan calls for a 0.4% year-on-year decline, and the plan remains cautious in light of the first-quarter sales increase.
The EC Business drove total Company earnings higher
Net sales in the EC Business increased 38.4% to 50.35 billion yen, and segment profit rose sharply to 2.37 billion yen from 0.23 billion yen in the same period of the previous year. The margin recovered from 0.6% to 4.7%. Sales for industrial equipment, automotive applications, and computers and peripherals all increased, and growth in sales of relatively high-margin products also lifted earnings.
The PB Business grew, but its share of total sales declined
Net sales in the PB Business increased 10.1% to 2.56 billion yen. TED Nagasaki performed strongly, primarily in semiconductor manufacturing-related applications, and the parent company also showed signs of recovery. On the other hand, the ratio to total Company sales declined from 5.2% to 4.2%. The current earnings recovery was driven more by the sales recovery and improved product mix in the EC Business than by structural expansion of the PB Business. The PB Business remains some distance from the 10% sales composition ratio targeted under VISION2030.
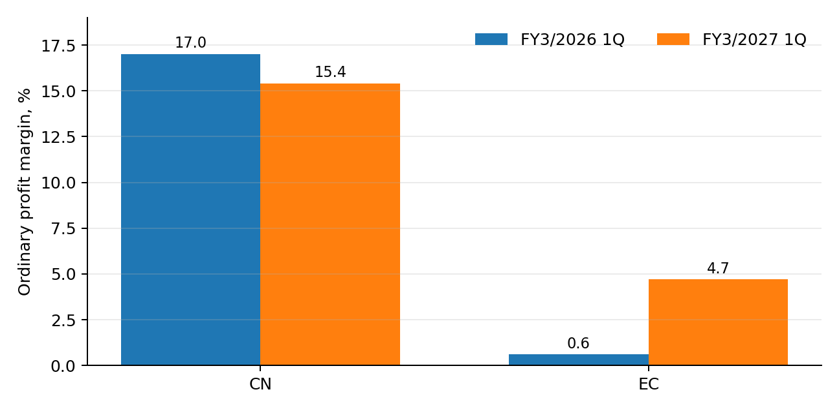
(Figure 2 Comparison of segment profit margins by business)
3. Orders are strong, but monetary value and actual demand should be assessed separately
First-quarter orders increased 25.2% from 79.71 billion yen in the previous quarter to 99.78 billion yen. The breakdown was 78.69 billion yen for the EC Business and 21.08 billion yen for the CN Business. Total Company orders were approximately 2.1x the 46.56 billion yen recorded in the same period of the previous year, and the order-to-sales ratio was 1.65x based on net sales of 60.32 billion yen.
Order growth supports the sustainability of the earnings recovery. However, the Company explains that longer product lead times, advance orders in anticipation of price increases, and higher semiconductor product prices contributed to the increase. Investors should not examine order value alone. The time required to convert the order backlog into sales, cancellations, volume excluding the effect of price increases, and changes in customer inventories will be important.
4. Upward revision to the earnings forecast and upside factors
The Company raised its full-year forecast to net sales of 240.0 billion yen, ordinary income of 13.6 billion yen, and net income of 9.4 billion yen. Compared with the previous forecast, the revisions were 6.7% for net sales, 20.4% for ordinary income, and 19.7% for net income. The annual dividend forecast was also raised from 108 yen to 129 yen.
| Item | Previous-year results | Revised forecast | Year on year |
| Net sales | 203.75 bn yen | 240.00 bn yen | Up 17.8% |
| CN Business net sales | 41.20 bn yen | 41.03 bn yen | Down 0.4% |
| EC Business consolidated net sales | 162.54 bn yen | 198.97 bn yen | Up 22.4% |
| PB Business net sales | 11.78 bn yen | 13.34 bn yen | Up 13.2% |
| Ordinary income | 9.75 bn yen | 13.60 bn yen | Up 39.5% |
| Ordinary income margin | 4.8% | 5.7% | Up 0.9 pt |
| Net income | 7.84 bn yen | 9.40 bn yen | Up 19.9% |
Progress toward the revised full-year plan in the first quarter was 25.1% for net sales, 28.7% for ordinary income, and 28.2% for net income. Against the first-quarter ordinary income margin of 6.5%, the margin required for the remaining nine months is approximately 5.4%. The Company is highly likely to achieve its plan.
Additional upside factors are maintenance of an EC Business margin in the upper 4% range, early conversion of the order backlog into sales, avoidance of a YoY decline in CN Business sales, and continued demand for industrial equipment and computers and peripherals. Downside factors are a pullback following advance orders, demand restraint caused by higher semiconductor prices, yen appreciation, an increase in the interest burden, and a slowdown in AI semiconductor investment.
5. Balance sheet and cash flow
At the end of the first quarter, cash and deposits were 5.45 billion yen, and interest-bearing debt was 33.53 billion yen, resulting in net interest-bearing debt of 28.08 billion yen. Net interest-bearing debt increased 6.27 billion yen from the end of the previous fiscal year. The working capital burden increased due to increases in trade receivables, inventories, and prepaid expenses, and operating cash flow was an outflow of 3.96 billion yen.
Prepaid expenses of 33.79 billion yen and advances received of 39.37 billion yen have a corresponding relationship, and prepaid expenses alone should not be assessed in the same manner as a normal inventory burden. However, the increase in trade receivables coincided with a decline in trade payables, and the earnings recovery did not directly translate into an increase in cash. This again confirms the trading-company-type capital structure in which working capital tends to increase during a recovery phase.
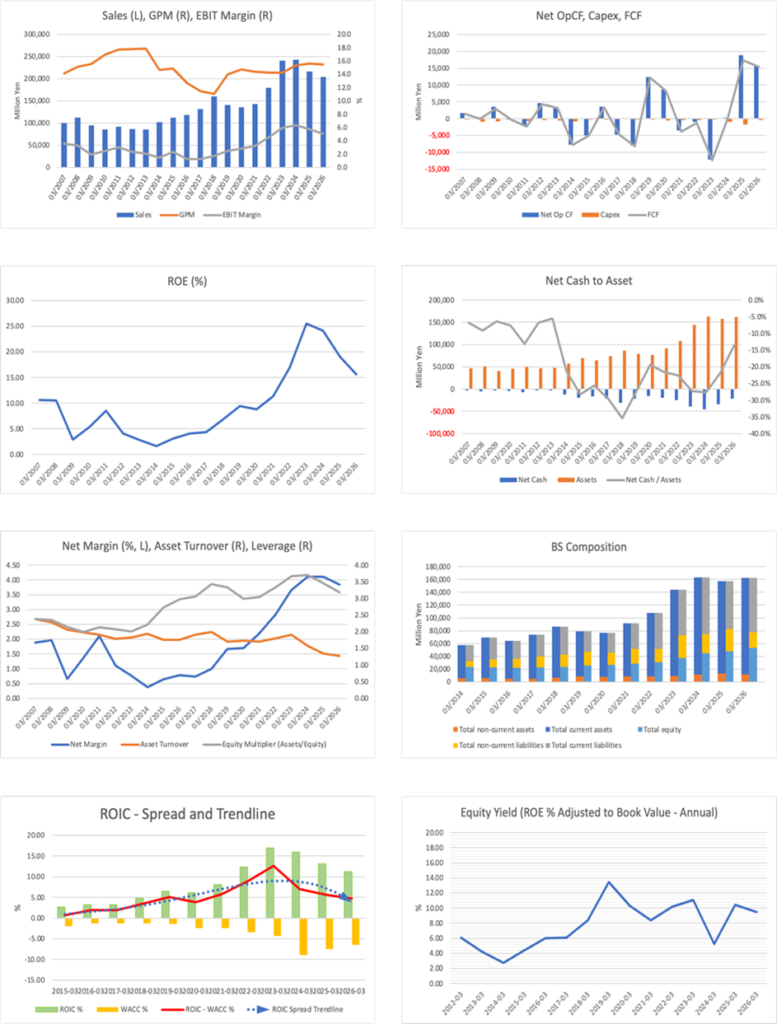
The supplied charts show that operating cash flow and free cash flow improved in FY3/2025 and FY3/2026. However, part of the improvement resulted from reductions in inventories and receivables. In the current fiscal year, working capital has begun to increase again as earnings have recovered, and the key question going forward is whether higher profits can offset the working capital burden and improve operating cash flow.
6. ROE, ROIC, and corporate value creation
Forecast full-year ROE is 17.9%, below the VISION2030 target of at least 20%. ROE is improving following the current upward revision to earnings. However, because working capital and interest-bearing debt are increasing simultaneously, the rise in ROE must be assessed separately in terms of margin improvement and financial leverage.
ROIC has declined since peaking in FY3/2023, but remains above WACC. The improvement in first-quarter earnings marks a starting point for a reversal in ROIC, while increases in trade receivables, inventories, and prepaid expenses raise invested capital. Investors should monitor not only the operating income margin, but also inventory turnover, trade receivables turnover, and the difference between advances received and prepaid expenses.
7. EPS growth priced into the market
Based on a share price of 3,750 yen, forecast EPS of 318.3 yen, and actual BPS of 1,793.9 yen, the forecast PER is 11.8x and the actual PBR is 2.09x. Based on the forecast dividend of 129 yen, the payout ratio is 40.5%, and the forecast dividend yield is 3.4%.
Assuming a required return on equity of 9.5%, back-calculation from a dividend-discount-based justified PER indicates that the market is pricing in a long-term EPS growth rate of approximately 5.9%. Using the same required return and back-calculating from PBR and ROE produces a growth rate of approximately 4.5%. We view the midpoint, in the 5% range, as the market’s expected growth rate.
The five-year historical CAGR from EPS of 170.2 yen in FY3/2022 to 265.9 yen in FY3/2026 was 9.3%. Including the forecast EPS of 318.3 yen for FY3/2027, the CAGR is 11.0%. The stock price reflects a recovery, but does not assume that growth exceeding the historical record will continue over a prolonged period.
8. Fair value based on PBR, DCF, and ROIC
The assumptions for the three methods do not extend post-recovery earnings indefinitely and explicitly incorporate the cost of capital and the working capital burden. Details of the calculations are omitted, and the principal assumptions and results are shown below.
| Valuation method | Principal assumptions | Fair value range | Central value |
| PBR method | Sustainable ROE of 14.5%–16.5%, cost of equity of 8.5%–9.5%, perpetual growth rate of2.0%–3.5% |
3,250yen–4,450yen | 3,800yen |
| DCF method | Normalized FCFF of 7.5–9.5 bn yen, WACC of 8.0%–9.0%, perpetual growth rate of 1.0%–2.0% |
2,400yen–5,560yen | 3,700yen |
| ROIC method | Invested capital of approx. 90.0 bn yen, ROIC of 10.0%–13.0%, WACC of 8.0%–9.0%, with excess returns declining gradually |
2,200yen–3,850yen | 3,000yen |
The median of the central values under the three methods is 3,700 yen, and we judge the overall range to be 3,000 yen–4,450 yen. The share price of 3,750 yen is almost in line with the central value. The current investment conclusion is based not on the stock being substantially undervalued at present, but on the possibility of further upward revisions to earnings forecasts and greater stability in the stock valuation as profit margins recover.
9. Benefits and drawbacks of the ownership structure
According to FactSet, the total holding ratio of identifiable shareholders is 58.26%. Tokyo Electron holds 33.82%, and stable shareholders are substantial when the employee stock ownership plan, the officer compensation BIP trust, and employee trusts are included. This contributes to the continuity of long-term strategy, credibility with business partners, and supply-demand stability when the stock price declines.
On the other hand, the effective free float is limited, and even small purchases and sales by domestic and overseas institutional investors can move the stock price. Over the past six months, American Century Investment Management increased its holding by approximately 254,000 shares, while Vanguard Capital Management and Global X Japan also increased their holdings. New funds may have begun to enter as earnings recover, but institutional ownership remains limited.
10. Stock price trend and sensitivity to the SOX Index
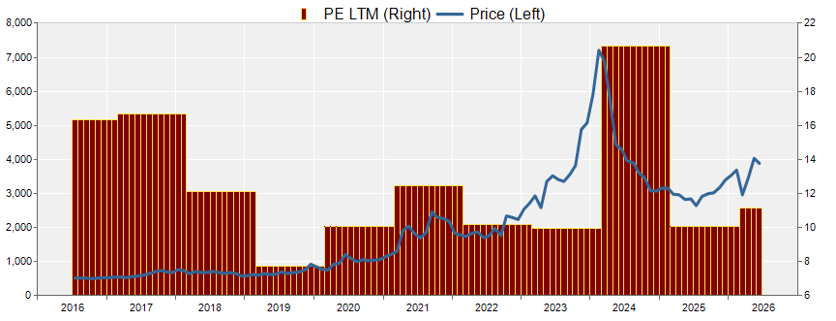
The stock price rose sharply from 2021 through 2023, supported by the semiconductor shortage, expansion of commercial rights, higher profit margins, and an increase in ROE into the 20% range. In 2024, despite high earnings, the stock price declined due to inventory adjustments, a slowdown in the EC Business, and concerns about peak earnings. From 2025 onward, the stock price recovered in anticipation of the end of inventory adjustments and an earnings recovery. It has corrected from the year-to-date high of 4,495 yen reached on May 25, 2026.
At the end of July, a sell-off in AI semiconductor stocks coincided with high volatility in the U.S. equity market. The SOX Index was reported to have fallen 13.6% over the five trading days through July 29, and the TOKYO ELECTRON DEVICE share price was also affected by market factors that cannot be explained by the financial results alone.
Sensitivity to the SOX Index should be measured using weekly returns to avoid the difference in trading hours between the Tokyo and U.S. markets. This report does not present a numerical estimate because a complete reconciliation of the publicly available data series could not be performed. The Company is not itself an AI semiconductor manufacturer and has exposure to industrial equipment, automotive applications, IT infrastructure, and maintenance services. Accordingly, its correlation with the SOX Index is likely lower than that of semiconductor-focused companies. At the same time, its relatively small market capitalization and limited liquidity amplify share price movements during sharp declines.
11. Items to confirm in the next financial results
- Whether the EC Business margin can remain in the upper 4% range
- Whether higher orders are converting into sales
- Whether there has been any pullback following advance orders prompted by longer lead times, or any cancellations
- Whether sales volume excluding the effect of price increases is growing
- Whether the decline in the CN Business margin is temporary
- Whether the PB Business sales composition ratio is returning toward the direction set out in VISION2030
- Whether operating cash flow improves and net interest-bearing debt begins to decline
- Whether the spread between ROIC and WACC widens again
- Whether an additional revision to the full-year ordinary income forecast of 13.6 billion yen will be necessary
12. Equity investment conclusion
We adopt a bullish investment conclusion. In the first quarter, the recovery in EC Business demand, improvement in profit margins, and increase in orders that were the conditions for raising the investment conclusion in the previous report were all confirmed. The roles within the business portfolio also became clearer: the CN Business provides earnings stability, while the EC Business drives growth in total Company earnings.
The share price of 3,750 yen is close to the central value of fair value under the three methods and is not at a level at which a substantial increase can be asserted based on current figures alone. Nevertheless, the long-term EPS growth rate priced into the market is in the 5% range, below the five-year historical CAGR of 9.3%. The Company’s plan remains cautious, particularly for the CN Business, and further earnings upside is possible if the EC Business maintains its profit margin.
The points requiring attention are the quality of the sharp increase in orders, the working capital burden, and stock price volatility associated with the sell-off in AI semiconductor stocks. Rather than weakening the investment conclusion for these reasons, we will review the conversion of orders into sales and cash generation each quarter. As long as the recovery in business earnings remains intact, there is no need to change the investment conclusion frequently solely because of overall market fluctuations.
Company profile
◇ A Tokyo Electron-affiliated hybrid company that combines semiconductor and IT technology trading company functions with manufacturer functions
TOKYO ELECTRON DEVICE LIMITED is a hybrid company that deeply engages with customers’ technical issues by combining specialized trading company functions in semiconductors and electronic devices with IT infrastructure, security, design and development, and private brand products. The Company was established in March 1986 and has 1,408 consolidated employees (March 31, 2026). Against the backdrop of the credibility of a group company with Tokyo Electron Limited as a core shareholder, it has a broad customer base, including industrial equipment manufacturers, automotive-related companies, telecommunications carriers, data centers & cloud business operators, and system integrators.
The business model is characterized not by mere purchase and resale, but by combining technical support, design support, product selection, maintenance, monitoring, and post-introduction operations. In the semiconductor and electronic device area, the Company handles processors, analog ICs, logic ICs, boards, software, electronic components, and other products. It is involved from the product development stage for customers. In the computer systems area, it provides networks, storage, security, cloud infrastructure, and maintenance and monitoring services, responding to the advancement of corporate IT infrastructure. In addition, in the private brand business, it provides wafer inspection system and design and manufacturing services, creating distinctive value unique to the Company. Its combination of trading company commercial rights, customer contact through engineers, and manufacturer functions is the source of the Company’s medium- to long-term competitiveness.
Key financial data
| Unit: million yen | 2022 | 2023 | 2024 | 2025 | 2026 | 2027 CE |
| Sales | 179,907 | 240,350 | 242,888 | 216,379 | 203,748 | 240,000 |
| EBIT (Operating Income) | 8,133 | 14,228 | 15,429 | 12,459 | 10,254 | |
| Pretax Income | 7,910 | 12,469 | 13,887 | 11,408 | 10,883 | |
| Net Profit Attributable to Owner of Parent | 5,085 | 8,778 | 9,986 | 8,874 | 7,842 | 9,400 |
| Cash & Short-Term Investments | 5,134 | 6,538 | 6,867 | 8,384 | 7,622 | |
| Total assets | 108,045 | 143,751 | 163,349 | 157,600 | 162,211 | |
| Total Debt | 29,479 | 45,652 | 52,101 | 42,633 | 29,433 | |
| Net Debt | 24,345 | 39,114 | 45,234 | 34,249 | 21,811 | |
| Total liabilities | 76,025 | 104,753 | 117,158 | 108,595 | 108,453 | |
| Total Shareholders’ Equity | 30,953 | 37,849 | 45,042 | 47,861 | 52,831 | |
| Net Operating Cash Flow | -891 | -12,185 | 301 | 18,915 | 15,684 | |
| Capital Expenditure | 380 | 270 | 903 | 1,762 | 381 | |
| Net Investing Cash Flow | -155 | -199 | -2,695 | -2,068 | 1,200 | |
| Net Financing Cash Flow | 606 | 13,746 | 2,529 | -15,251 | -17,848 | |
| Free Cash Flow | -1,240 | -12,361 | -3 | 17,363 | 15,412 | |
| ROA (%) | 5.10 | 6.97 | 6.50 | 5.53 | 4.90 | |
| ROE (%) | 16.97 | 25.52 | 24.10 | 19.11 | 15.58 | |
| EPS (Yen) | 170.2 | 294.8 | 333.4 | 295.7 | 265.9 | 318.3 |
| BPS (Yen) | 1,042.4 | 1,268.2 | 1,501.1 | 1,624.1 | 1,794.0 | |
| Dividend per Share (Yen) | 68.33 | 118.33 | 135.00 | 119.00 | 107.00 | 129.00 |
| Shares Outstanding (Million shares) | 31.34 | 31.34 | 31.34 | 31.34 | 31.34 |
Source: Calculated by Omega Investment based on FactSet’s standard criteria, rounded to the nearest whole number. The number of shares outstanding reflects post-split adjusted figures.
Share price
Key stock price data
Financial data (quarterly basis)
| Unit: million yen | 2025/3 | 2026/3 | 2027/3 | ||||||
| 1Q | 2Q | 3Q | 4Q | 1Q | 2Q | 3Q | 4Q | 1Q | |
| (Income Statement) | |||||||||
| Sales | 56,607 | 55,105 | 50,384 | 54,283 | 45,136 | 51,108 | 50,472 | 57,032 | 60,322 |
| Year-on-year | -4.1% | -9.2% | -16.1% | -14.0% | -20.3% | -7.3% | 0.2% | 5.1% | 33.6% |
| Cost of Goods Sold (COGS) | 47,411 | 47,877 | 42,132 | 45,226 | 38,681 | 43,717 | 42,392 | 47,416 | 51,015 |
| Gross Income | 9,196 | 7,228 | 8,252 | 9,057 | 6,455 | 7,391 | 8,080 | 9,616 | 9,307 |
| Gross Income Margin | 16.2% | 13.1% | 16.4% | 16.7% | 14.3% | 14.5% | 16.0% | 16.9% | 15.4% |
| SG&A Expense | 4,942 | 5,189 | 5,686 | 5,457 | 4,999 | 5,284 | 5,336 | 5,669 | 5,240 |
| EBIT (Operating Income) | 4,254 | 2,039 | 2,566 | 3,600 | 1,456 | 2,107 | 2,744 | 3,947 | 4,067 |
| Year-on-year | 17.2% | -42.2% | -30.8% | -21.2% | -65.8% | 3.3% | 6.9% | 9.6% | 179.3% |
| Operating Income Margin | 7.5% | 3.7% | 5.1% | 6.6% | 3.2% | 4.1% | 5.4% | 6.9% | 6.7% |
| EBITDA | 4,495 | 2,271 | 2,845 | 3,909 | 1,720 | 2,374 | 3,017 | 4,220 | 4,319 |
| Pretax Income | 3,614 | 2,532 | 1,786 | 3,476 | 1,715 | 1,950 | 3,427 | 3,791 | 3,908 |
| Consolidated Net Income | 2,506 | 1,812 | 1,279 | 3,307 | 1,240 | 1,368 | 2,451 | 2,825 | 2,667 |
| Minority Interest | 12 | 1 | 10 | 6 | 22 | 6 | 0 | 13 | 16 |
| Net Income ATOP | 2,494 | 1,811 | 1,269 | 3,300 | 1,217 | 1,363 | 2,450 | 2,812 | 2,651 |
| Year-on-year | 14.1% | -23.4% | -49.6% | 13.2% | -51.2% | -24.7% | 93.1% | -14.8% | 117.8% |
| Net Income Margin | 4.4% | 3.3% | 2.5% | 6.1% | 2.7% | 2.7% | 4.9% | 4.9% | 4.4% |
| (Balance Sheet) | |||||||||
| Cash & Short-Term Investments | 7,061 | 9,653 | 9,743 | 8,384 | 7,013 | 8,695 | 5,641 | 7,622 | 5,445 |
| Total assets | 161,802 | 164,278 | 163,485 | 157,600 | 144,121 | 154,925 | 158,331 | 162,929 | 163,594 |
| Total Debt | 48,719 | 52,161 | 50,244 | 42,633 | 32,498 | 38,305 | 34,825 | 29,637 | 33,530 |
| Net Debt | 41,658 | 42,508 | 40,501 | 34,249 | 25,485 | 29,610 | 29,184 | 22,015 | 28,085 |
| Total liabilities | 114,997 | 116,407 | 115,601 | 108,595 | 96,023 | 106,517 | 108,240 | 109,171 | 109,231 |
| Total Shareholders’ Equity | 45,678 | 46,743 | 46,747 | 47,861 | 46,939 | 47,244 | 49,177 | 52,831 | 53,432 |
| (Profitability %) | |||||||||
| ROA | 6.79 | 6.27 | 5.32 | 5.53 | 4.97 | 4.48 | 5.18 | 4.89 | 6.03 |
| ROE | 24.49 | 22.13 | 19.17 | 19.11 | 16.41 | 15.21 | 17.37 | 15.58 | 18.48 |
| (Per-share) Unit: JPY | |||||||||
| EPS | 83.1 | 60.1 | 42.1 | 110.4 | 41.2 | 46.0 | 83.3 | 95.5 | 90.0 |
| BPS | 1,520.4 | 1,552.5 | 1,550.5 | 1,624.1 | 1,583.3 | 1,608.2 | 1,671.8 | 1,794.0 | 1,812.2 |
| Dividend per Share | 0.00 | 52.00 | 0.00 | 67.00 | 0.00 | 35.00 | 0.00 | 72.00 | 0.00 |
| Shares Outstanding (million shares) | 31.34 | 31.34 | 31.34 | 31.34 | 31.34 | 31.34 | 31.34 | 31.34 | 31.34 |
Source: Calculated by Omega Investment based on FactSet’s standard criteria, rounded to the nearest whole number. The number of shares outstanding reflects post-split adjusted figures.
Financial data (full-year basis)
| Unit: million yen | 2017 | 2018 | 2019 | 2020 | 2021 | 2022 | 2023 | 2024 | 2025 | 2026 |
| (Income Statement) | ||||||||||
| Sales | 131,855 | 159,841 | 141,000 | 135,394 | 143,268 | 179,907 | 240,350 | 242,888 | 216,379 | 203,748 |
| Year-on-year | 11.9% | 21.2% | -11.8% | -4.0% | 5.8% | 25.6% | 33.6% | 1.1% | -10.9% | -5.8% |
| Cost of Goods Sold | 116,709 | 142,160 | 121,295 | 115,491 | 122,666 | 154,268 | 206,106 | 205,720 | 182,646 | 172,206 |
| Gross Income | 15,146 | 17,681 | 19,705 | 19,903 | 20,602 | 25,639 | 34,244 | 37,168 | 33,733 | 31,542 |
| Gross Income Margin | 11.5% | 11.1% | 14.0% | 14.7% | 14.4% | 14.3% | 14.2% | 15.3% | 15.6% | 15.5% |
| SG&A Expense | 13,481 | 14,924 | 16,179 | 16,091 | 15,981 | 17,506 | 20,016 | 21,739 | 21,274 | 21,288 |
| EBIT (Operating Income) | 1,665 | 2,757 | 3,526 | 3,812 | 4,621 | 8,133 | 14,228 | 15,429 | 12,459 | 10,254 |
| Year-on-year | 11.7% | 65.6% | 27.9% | 8.1% | 21.2% | 76.0% | 74.9% | 8.4% | -19.2% | -17.7% |
| Operating Income Margin | 1.3% | 1.7% | 2.5% | 2.8% | 3.2% | 4.5% | 5.9% | 6.4% | 5.8% | 5.0% |
| EBITDA | 2,254 | 3,317 | 4,035 | 4,451 | 5,234 | 8,864 | 14,787 | 16,192 | 13,520 | 11,331 |
| Pretax Income | 1,435 | 2,485 | 3,257 | 3,227 | 4,589 | 7,910 | 12,469 | 13,887 | 11,408 | 10,883 |
| Consolidated Net Income | 972 | 1,655 | 2,403 | 2,370 | 3,217 | 5,489 | 8,879 | 10,081 | 8,904 | 7,884 |
| Minority Interest | 0 | 56 | 61 | 81 | 74 | 404 | 100 | 94 | 29 | 41 |
| Net Income ATOP | 972 | 1,598 | 2,341 | 2,288 | 3,143 | 5,085 | 8,778 | 9,986 | 8,874 | 7,842 |
| Year-on-year | 5.1% | 64.4% | 46.5% | -2.3% | 37.4% | 61.8% | 72.6% | 13.8% | -11.1% | -11.6% |
| Net Income Margin | 0.7% | 1.0% | 1.7% | 1.7% | 2.2% | 2.8% | 3.7% | 4.1% | 4.1% | 3.8% |
| (Balance Sheet) | ||||||||||
| Cash & Short-Term Investments | 2,433 | 3,606 | 3,794 | 4,492 | 5,680 | 5,134 | 6,538 | 6,867 | 8,384 | 7,622 |
| Total assets | 73,708 | 86,708 | 78,927 | 77,013 | 91,453 | 108,045 | 143,751 | 163,349 | 157,600 | 162,211 |
| Total Debt | 24,243 | 34,266 | 25,443 | 19,400 | 25,396 | 29,479 | 45,652 | 52,101 | 42,633 | 29,433 |
| Net Debt | 21,810 | 30,660 | 21,649 | 14,908 | 19,716 | 24,345 | 39,114 | 45,234 | 34,249 | 21,811 |
| Total liabilities | 50,780 | 62,306 | 52,516 | 49,870 | 61,799 | 76,025 | 104,753 | 117,158 | 108,595 | 108,453 |
| Total Shareholders’ Equity | 22,926 | 23,838 | 25,806 | 26,476 | 28,965 | 30,953 | 37,849 | 45,042 | 47,861 | 52,831 |
| (Cash Flow) | ||||||||||
| Net Operating Cash Flow | -4,685 | -7,993 | 12,335 | 8,651 | -3,463 | -891 | -12,185 | 301 | 18,915 | 15,684 |
| Capital Expenditure | 166 | 256 | 262 | 544 | 427 | 380 | 270 | 903 | 1,762 | 381 |
| Net Investing Cash Flow | -262 | -896 | -1,708 | -549 | -469 | -155 | -199 | -2,695 | -2,068 | 1,200 |
| Net Financing Cash Flow | 4,739 | 9,869 | -10,504 | -7,479 | 5,079 | 606 | 13,746 | 2,529 | -15,251 | -17,848 |
| Free Cash Flow | -4,818 | -8,133 | 12,111 | 8,163 | -3,811 | -1,240 | -12,361 | -3 | 17,363 | 15,412 |
| (Profitability ) | ||||||||||
| ROA (%) | 1.41 | 1.99 | 2.83 | 2.94 | 3.73 | 5.10 | 6.97 | 6.50 | 5.53 | 4.90 |
| ROE (%) | 4.31 | 6.84 | 9.44 | 8.76 | 11.34 | 16.97 | 25.52 | 24.10 | 19.11 | 15.58 |
| Net Margin (%) | 0.74 | 1.00 | 1.66 | 1.69 | 2.19 | 2.83 | 3.65 | 4.11 | 4.10 | 3.85 |
| Asset Turn | 1.91 | 1.99 | 1.70 | 1.74 | 1.70 | 1.80 | 1.91 | 1.58 | 1.35 | 1.27 |
| Assets/Equity | 3.06 | 3.43 | 3.34 | 2.98 | 3.04 | 3.33 | 3.66 | 3.70 | 3.45 | 3.18 |
| (Per-share) Unit: JPY | ||||||||||
| EPS | 32.2 | 52.7 | 76.9 | 74.8 | 104.1 | 170.2 | 294.8 | 333.4 | 295.7 | 265.9 |
| BPS | 758.6 | 785.0 | 845.4 | 880.4 | 957.1 | 1,042.4 | 1,268.2 | 1,501.1 | 1,624.1 | 1,794.0 |
| Dividend per Share | 20.00 | 22.00 | 31.00 | 30.00 | 41.67 | 68.33 | 118.33 | 135.00 | 119.00 | 107.00 |
| Shares Outstanding (million shares) | 31.34 | 31.34 | 31.34 | 31.34 | 31.34 | 31.34 | 31.34 | 31.34 | 31.34 | 31.34 |
Source: Calculated by Omega Investment based on FactSet’s standard criteria, rounded to the nearest whole number. The number of shares outstanding reflects post-split adjusted figures.