2026-10-23
Home
Japanese

Omega Investment Co., Ltd.
Sansei Landic (2Q Earnings review)
| Share price (8/11) | 871 yen | M Cap | 15.0 bn yen |
| PER (e) | 6.4 X | Dvd yld(e) | 4.3 X |
| OP progress | 70 % | Equity ratio | 34.4 % |
| Click here for the PDF version of this page |
| PDF version |
A substantial upward revision lifts earnings. In addition to improved sales capabilities, expanded purchases are building a stronger base for growth from 2027 onward.
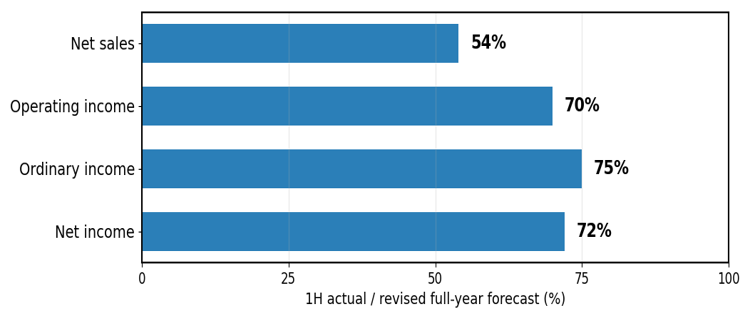
Meanwhile, the Company has already achieved approximately 70% of its full-year operating income forecast in the first half, making the validity of the assumptions for the second half the next potential share-price catalyst.
Investment View
1. Earnings Results and Assessment
For 1H, net sales were 16.59 billion yen (YoY +14.3%), operating income was 2.57 billion yen (+14.9%), and net income was 1.58 billion yen (+12.3%). Operating income reached 114.4% and net income 113.1% of the Company’s plan, clearly exceeding forecasts, driven by increased sales of leasehold land and old unutilized properties.
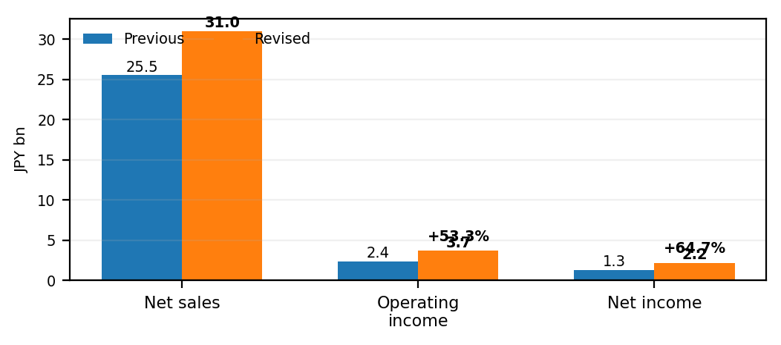
The Company revised its full-year forecast upward to net sales of 31.0 billion yen, operating income of 3.68 billion yen, and net income of 2.19 billion yen. The revisions are substantial, with operating income raised by 53.3% and net income by 64.7%, and we view this as an upward shift in the earnings level rather than simply strong first-half performance.
2. Impact on Investment View
The EPS forecast increased from 81.76 yen to 134.62 yen. Based on the reference share price of 871 yen, the forecast PER is approximately 6.4x, while the forecast dividend yield based on the annual dividend of 37.5 yen is approximately 4.3%. Given the magnitude of the earnings forecast revision, the share-price valuation remains low, leaving room for a valuation re-rating.
First-half purchases of 11.6 billion yen and 312 lots were at record-high levels. The Company has secured 32.7 billion yen in real estate for sale and raised its full-year purchase plan to 22.0 billion yen. We positively evaluate the fact that the inventory available for sale from 2027 onward is becoming more substantial.
3. Near-term Share-price Outlook and Points to Note
Following the upward earnings revision and dividend increase, we expect the shares to remain firm in the near term. However, against first-half operating income of 2.57 billion yen, the full-year forecast is 3.68 billion yen, implying operating income of only approximately 1.11 billion yen in the second half. The most important point to confirm is whether this reflects a conservative plan, incorporates changes in the project mix, or reflects a decline in the gross profit margin.
Attention should also be paid to the funding burden associated with inventory expansion. Interest-bearing debt increased to 26.0 billion yen, while the equity ratio improved to 34.4%, and operating cash flow remained positive at 1.798 billion yen in the first half.
4. Key Points at the August 21 Earnings Briefing
- The conservatism of the assumption of approximately 1.1 billion yen in second-half operating income and the outlook for the gross profit margin
- Sales plans for leasehold land and old unutilized properties, and the profit margins and turnover periods of large-scale projects
- The 22.0 billion yen purchase plan and the timing of its contribution to earnings in 2027
- Shareholder return policy following the dividend increase, and appropriate levels of inventory and interest-bearing debt
Further update: Following the August 21 earnings briefing, we will reassess the investment view, earnings outlook, and fair share price based on additional explanations from management and report again.
Earnings forecast revision
1H Progress
Fair value
| Lower end | Median | Upper end |
| 800yen | 900yen | 1,000yen |
Comprehensively assessed based on EPS of 134.62 yen, using PER of 6-7x, a dividend yield of 4-5%, and PBR of 0.9-1.1x as benchmarks. At present, we use 900 yen as the midpoint.
Financial data (Quarterly basis)
| Unit: million yen | 2024/12 | 2025/12 | 2026/12 | |||||||
| 1Q | 2Q | 3Q | 4Q | 1Q | 2Q | 3Q | 4Q | 1Q | 2Q | |
| [Income Statement] | ||||||||||
| Net Sales | 7,207 | 5,785 | 8,358 | 4,270 | 8,848 | 5,664 | 5,202 | 3,634 | 9,607 | 6,983 |
| YoY | 11.1% | 5.3% | 11.7% | 12.3% | 22.8% | -2.1% | -37.8% | -14.9% | 8.6% | 23.3% |
| Gross Profit | 1,686 | 1,558 | 1,910 | 1,149 | 3,006 | 1,602 | 1,518 | 868 | 3,342 | 1,928 |
| Gross Profit Margin | 23.4% | 26.9% | 22.9% | 26.9% | 34.0% | 28.3% | 29.2% | 23.9% | 34.8% | 27.6% |
| EBIT (Operating Income) | 571 | 455 | 785 | 72 | 1,806 | 434 | 410 | -403 | 2,041 | 532 |
| YoY | -49.0% | -15.5% | 16.2% | -140.5% | 216.6% | -4.6% | -47.7% | -662.5% | 13.0% | 22.6% |
| EBIT Margin | 7.9% | 7.9% | 9.4% | 1.7% | 20.4% | 7.7% | 7.9% | -11.1% | 21.2% | 7.6% |
| Net Income Attributable to Owners of Parent |
328 | 245 | 485 | -7 | 1,175 | 236 | 213 | -329 | 1,317 | 267 |
| YoY | -52.0% | -4.0% | 25.2% | -94.9% | 258.2% | -4.0% | -56.1% | 4432.4% | 12.1% | 13.1% |
| Net Income Margin | 4.6% | 4.2% | 5.8% | -0.2% | 13.3% | 4.2% | 4.1% | -9.1% | 13.7% | 3.8% |
| [Balance Sheet] | ||||||||||
| Cash & Deposits | 4,479 | 4,988 | 4,728 | 5,013 | 5,788 | 5,730 | 5,319 | 4,717 | 6,960 | 6,650 |
| Total Assets | 30,487 | 30,561 | 29,940 | 33,107 | 31,353 | 32,250 | 35,709 | 40,680 | 44,466 | 43,412 |
| Interest-bearing Debt | 16,787 | 16,211 | 15,595 | 18,506 | 15,747 | 16,379 | 20,002 | 25,145 | 27,752 | 26,000 |
| Net Debt | 12,308 | 11,223 | 10,867 | 13,493 | 9,959 | 10,649 | 14,683 | 20,428 | 20,792 | 19,350 |
| Shareholders’ Equity | 12,133 | 12,398 | 12,768 | 12,759 | 13,641 | 13,779 | 13,877 | 13,551 | 14,645 | 14,943 |
Source: Calculated by Omega Investment based on FactSet’s standard criteria, rounded to the nearest whole number.