2026-06-26
Home
Japanese

Omega Investment Co., Ltd.
TAKARA & COMPANY (Investment report – 2Q update)
| Share price (1/7) | ¥4,690 | Dividend Yield (26/5 CE) | 2.6 % |
| 52weeks high/low | ¥2,711/4,795 | ROE(25/5 act) | 14.1 % |
| Avg Vol (3 month) | 24.0 thou shrs | Operating margin (25/5 act) | 13.6 % |
| Market Cap | ¥61.69 bn | Beta (5Y Monthly) | 0.5 |
| Enterprise Value | ¥41.37 bn | Shares Outstanding | 13.153 mn shrs |
| PER (26/5 CE) | 19.5 X | Listed market | TSE Prime section |
| PBR (25/5 act) | 2.0 X |
| Click here for the PDF version of this page |
| PDF version |
A phase of layering the next growth drivers on stable earnings. Further share price appreciation depends on quantifiable growth.
Conclusion
Maintain an overweight stance in the medium term; in the short term, respond flexibly while assessing the certainty of shareholder returns and waiting for quantitative disclosures.
TAKARA & COMPANY LTD. (the “Company”)’s investment action is, in the medium term, to maintain an overweight stance by gradually raising the portfolio weighting in stages, and, in the short term, to respond to pullbacks while waiting for progress in shareholder returns and capital policy, as well as quantitative disclosure of new services. First-half results were net sales of 16.075 billion yen (YoY +8.1%), operating income of 2.301 billion yen (YoY +9.6%), ordinary income of 2.388 billion yen (YoY +7.8%), and interim net income attributable to owners of the parent of 1.534 billion yen (YoY +5.0%), representing higher sales and higher profits and within the forecast range based on the previous report’s assumption of a solid start.
The three previously cited short-term share price catalysts, “clarification of capital policy,” “KPI disclosure for AI translation,” and “quantification of cross-sell,” have not yet been realized. First, the Company has made no changes to its full-year earnings forecast, and it cannot be said that strong first-half performance has immediately led to capital policy guidelines or additional disclosures. Regarding capital policy, although cash outflows of 254 million yen for share buybacks are reflected in cash flows from financing activities, they have not reached the scale or clarity required to change market views, as we previously assumed. On the other hand, an interim dividend of 60 yen per share was approved, increasing the likelihood of more substantial shareholder returns.
As organized in the previous report, the source of the Company’s strength lies in its ability to bundle system and language services on the foundation of deep know-how in disclosure operations and to embed itself in customers’ operations. Cash also increased to 19.931 billion yen at the interim period-end, and the structure with options for investment and shareholder returns, backed by net cash of 19.869 billion yen, is maintained. In addition, the fact that the Company jointly developed with Hitachi, Ltd. an end-to-end disclosure service for financial and non-financial information, “WizLabo Synapse,” and stated that it is scheduled to start being provided in March 2026, is a factor that supports the previous hypothesis of technology innovation as a core driver and a seed for demand stimulation.
The Company is in a transitional period in which it adds value through technology and AI, supported by its existing high-profit businesses. Since the valuation has been raised relative to the previous report—forecast PER of 19.74x and actual PBR of 1.95x against an ROE of 14.06%—clarification of the capital policy and KPI disclosure for AI translation and related services again becomes a necessary condition for realizing short-term share price upside. Therefore, it would be rational to maintain a medium-term holding stance while taking risks at phases when quantitative disclosures progress.
◇ 2Q FY2026/5 results highlights: secure higher sales and higher profits; the profit rebound in Interpreting & Translation adds thickness to the earnings structure
The Company’s 2Q FY2026/5 (interim period) exceeded the prior-year period in both sales and profit, and both axes (Disclosure / Interpreting & Translation) recorded higher sales. In particular, Interpreting & Translation showed a substantial increase in profits, and the most significant gain was that the overall earnings structure became more complex. A structure is also becoming evident, whereby rising personnel expenses and goodwill amortization constrain upside to profit margins. In 2H, management will be tested on its ability to convert higher sales into profit reliably.
Consolidated performance achieved profit growth, with net sales of 16.075 billion yen (YoY +8.1%), operating income of 2.301 billion yen (YoY +9.6%), ordinary income of 2.388 billion yen (YoY +7.8%), and interim net income attributable to owners of the parent of 1.534 billion yen (YoY +5.0%). Gross profit increased to 6.839 billion yen (increase of 621 million yen). In comparison, SG&A expenses increased to 4.537 billion yen (an increase of 419 million yen), and the Company offset the cost increase through growth in gross profit, resulting in higher profits. In the breakdown of SG&A expenses, increases in salaries and allowances and amortization of goodwill stand out (intense fixed-cost color), and care is required to ensure that these factors do not become a source of profit margin volatility in periods when sales seasonality intensifies.
By segment, the Disclosure-related business was steady, with net sales of 11.775 billion yen (YoY +6.5%) and segment profit of 1.895 billion yen (YoY +6.1%). The factors for higher sales were, in addition to increased sales of convocation notices for general meetings of shareholders and integrated reports, the incremental contribution from the consolidation of J Trust Co., Ltd. as a consolidated subsidiary. By product category as well, the main areas generally recorded higher sales: Financial Instruments and Exchange Act-related (5.054 billion yen, YoY +7.9%), Companies Act-related (2.448 billion yen, YoY +12.7%), IR-related (3.387 billion yen, YoY +0.6%), and Others (885 million yen, YoY +6.0%).
For the Interpreting & Translation business, net sales were 4.3 billion yen (YoY +12.7%) and segment profit was 297 million yen (YoY +286.4%), indicating a clear profit rebound. For interpreting, the number of client companies, the number of new client companies, and the number of large projects increased through follow-ups on past projects. The expansion of the AI interpreting lineup also contributed, and sales for the interpreting business as a whole are said to be the highest ever. For translation, although demand shrinkage at universities and similar institutions continues, the Company exceeded the prior-year period by accumulating orders for the AI translation platform “SIMULwiz” and securing large projects. On the profit side, outsourcing costs increased, but sales growth exceeded this increase, and SG&A restraint through operational efficiency also contributed to a substantial increase in profits.
In non-operating items, although the Company recorded dividends received of 69.14 million yen and interest received of 9.27 million yen, it also incurred foreign exchange losses and losses on the operations of investment partnerships, and the contribution to profit and loss is considered limited. Extraordinary gains and losses are in an almost offsetting relationship, with a gain on the sale of investment securities of 23.19 million yen and a loss on retirement of fixed assets of 23.93 million yen; the share price valuation axis for the current period is, in any case, higher sales in the core business and cost control.
The profit rebound in Interpreting & Translation is positive, but increases in salaries and allowances and amortization of goodwill remain as fixed costs. In 2H, KPI disclosures of sales and gross profit for SIMULwiz/AI interpreting, and the disclosed improvement in unit prices, will become the next valuation axis for the share price.
◇ Segment analysis: disclosure support for listed companies is the pillar of earnings; growth and profit improvement stand out in Interpreting & Translation
The Company has a two-pillar structure: the “Disclosure-related business” and the “Interpreting & Translation business,” with the former forming the earnings foundation and the latter driving growth and improving profitability. The sales composition ratio in 2Q FY2026/5 is approximately 73% (Disclosure) and 27% (Interpreting & Translation).
- Disclosure-related business: For listed companies, it supports disclosure operations, with a primary focus on the preparation and issuance of statutory and voluntary disclosures. In 1H, sales were steady at 11.775 billion yen (YoY +6.5%) and segment profit was 1.895 billion yen (YoY +6.1%). In addition to increases in convocation notices for general meetings of shareholders and in integrated reports, the contribution from consolidation increased the results. Due to seasonality, sales are biased by quarter because customers with March fiscal year-ends are concentrated in that quarter.
- Interpreting & Translation business: It provides interpreting services for international conferences and events and translation services for various documents. It includes interpreting (e.g., meetings and events) and translation, and is expanding the menu of AI applications, such as AI interpreting services and AI translation platforms. In 1H, sales were 4.3 billion yen (YoY +12.7%) and segment profit was 297 million yen (YoY +286.4%). In addition to higher sales, profit growth was substantial. Interpreting was supported by increased client engagements and large-scale projects, as well as the expansion of AI interpreting and translation. Translation was supported by accumulated orders for “SIMULwiz” and large projects, although headwinds from demand decline remain.
◇ FY2026/5 earnings forecast: the Company’s plan is unchanged. 1H progress is steady, but “the demand environment in 2H” and “monetization of new areas” are the focus.
For the full-year FY2026/5, based on the Company’s plan (net sales of 33.0 billion yen, operating income of 4.4 billion yen, and net income attributable to owners of the parent of 3.1 billion yen), we view the certainty of achievement as high. At the same time, what the equity market will next seek is quantification of the extent to which new areas, such as non-financial and AI, contribute to profits.
1H results were net sales of 16.075 billion yen, operating income of 2.301 billion yen, and net income of 1.534 billion yen, and progress against the full-year plan is approximately 49% for sales, approximately 52% for operating income, and approximately 49% for net income, which is a generally steady level even taking seasonality into account.
Positive factors are two points: (1) demand for disclosure support is firm due to regulatory responses and integrated reports, and (2) profit improvement progressed in Interpreting & Translation. A negative factor is that demand shrinkage continues in specific translation industries, and if the project mix deteriorates toward 2H, profit growth could decelerate. The Company seeks to absorb this through the accumulation of orders for the AI translation platform, the expansion of AI interpreting, and operational efficiency gains. Whether the design to overcome demand changes through substitution into AI-utilization services succeeds will determine the outcome.
The framework for capital policy and investment, as set out in the Medium-Term Management Plan, allocates 10.0 billion yen to growth investment and 3.8 billion yen or more to shareholder returns; it states that the dividend payout ratio will be approximately 50% and that it will also consider share buybacks. During the implementation phase, both the stability of shareholder returns and the execution of investment will be questioned; therefore, for the forecast PER of 19.74x and PBR of 1.95x to rise further, disclosure of KPIs for monetizing growth investments is necessary.
There should be no significant issues in achieving the full-year Company plan. The factor that will lift share price valuation is an explanation of how many billion yen in sales and profits AI and non-financial responses generate; if this is provided, it will become easier to consider additional purchases.
◇ Share price trend and points to watch going forward: the share price has risen gradually over three months; it reacts to catalysts, but the decisive factors are KPI disclosure and clarification of capital policy
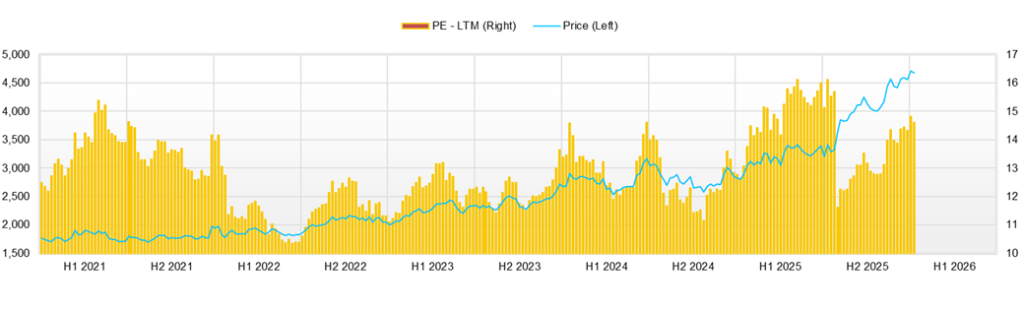
Over the past three months, the Company’s share price has been on an upward trend and has responded straightforwardly to catalysts, while the primary driver of upside is limited to the profit KPIs of new services and a deeper step into capital policy. From early September (closing price of 4,055 yen on September 1, 2025) to late December (closing price of 4,555 yen on December 26), it rose by about +12.3%, and the range was roughly 3,960 yen (closing price on September 4) to 4,700 yen (high on November 26, 2025). Recently, it reached a year-to-date high of 4,740 yen on 12/29, during which upside attempts continued.
Valuation is at a level that has priced in stable growth and high profitability in the area around disclosure, with a forecast PER of 19.74x and an actual PBR of 1.95x. Volatility is low, as indicated by a beta of 0.58.
In catalyst reactions, buying tends to enter on positive news, whereas earnings announcements tend to induce tentative profit-taking. After the Company disclosed cooperation with Hitachi, Ltd. on December 8, the share price rose stepwise from the closing price of 4,415 yen on December 5 to the closing price of 4,460 yen on the 8th (about +1.0%) to 4,495 yen on the 9th (about +0.8%) to 4,570 yen on the 10th (about +1.7%). In addition, on December 9, an increase in MIRI Capital Management’s ownership ratio was viewed as a catalyst and is seen to have supported the share price, providing favorable supply-and-demand tailwinds. After the disclosure of interim results and the interim dividend on December 25, selling was dominant for the moment, with 4,585 yen at the close on the 24th to 4,485 yen at the close on the 25th (about -2.18%), and then it returned to 4,555 yen on the following 26th (about +1.56%); it tends to become “priced in” on the event day.
Two conditions increase the risk of developing overweight. First, for new services including Hitachi, Ltd. and AI translation/interpreting, periodic disclosure of KPIs that allow measurement of profit contribution, such as number of orders, recurring subscription fees (or ARPU (average revenue per user)), and gross margin, should be provided. Second, as a capital policy backed by net cash, the policy and scale of share buybacks should become clear. As investment timing, phases in which any of the following can be confirmed can become a trigger to switch the approach from buying on weakness to chasing the upside: (1) first KPI disclosure in the next earnings release, (2) a large order showing project formation of demand for non-financial disclosure including SSBJ (Sustainability Standards Board of Japan) responses, or (3) additional capital policy such as share buybacks.
From a technical perspective, after trending up from the closing price of 3,960 yen on September 4, it adjusted to the low 4,000 yen level by late October (4,025 yen on October 30). Nevertheless, it broke through the 4,600-yen level in the second half of November and, in December, moved within the core range of 4,400 to 4,650 yen. The recent downside level is around 4,450 yen (low of 4,445 yen on December 25, around the closing price of 4,485 yen), and the upside milestone is the 4,700 yen level (high of 4,700 yen on November 26, year-to-date high of 4,740 yen on December 29); to break out of the range, comparable catalysts such as the above KPIs and capital policy are necessary.
The share price reacts to catalysts, but profit-taking selling also tends to emerge on earnings. A pullback around 4,450 yen is attractive, but for it to settle in the 4,700 yen level, KPI disclosure and a deeper step into capital policy are indispensable.
Company profile
◇ Evolving into a “disclosure × language” platformer that holds the disclosure infrastructure
TAKARA & COMPANY LTD. originated from Takara Printing Co., Ltd., which was founded in 1952; in December 2019, it became a holding company and adopted its current trade name. Consolidated employees number 1,245, and the Group has 21 companies. Its core businesses are two axes: (1) the “Disclosure-related business,” which provides one-stop support for the preparation of statutory disclosures (securities reports, financial results summaries, convocation notices, etc.) and voluntary disclosures (IR, ESG, etc.) for listed companies, providing integrated services from system provision through checking, consulting, and production/printing; and (2) the “Interpreting & Translation business,” which handles interpreting for meetings and events and translation of various documents.
In the Disclosure-related business, for mandatory disclosures submitted to the Financial Services Agency’s “EDINET” and the Tokyo Stock Exchange’s “TDnet,” as well as voluntary disclosures, it is designed to support the entire series, in addition to preparation support, including research division checking, consulting, translation, production and printing, software provision, and video distribution. Customers are assumed to comprise approximately 3,900 listed companies and approximately 1,000 companies planning to list, and the system captures needs for regulatory responses and more sophisticated disclosures. The Interpreting & Translation business, in addition to interpreting and translation, develops related services within the Group, including conference equipment, staffing, and training schools.
Key financial data
| Unit: million yen | 2021 | 2022 | 2023 | 2024 | 2025 | 2026 CE |
| Sales | 24,777 | 25,318 | 27,568 | 29,278 | 29,679 | 33,000 |
| EBIT (operating profit) | 2,707 | 3,561 | 3,812 | 4,232 | 4,049 | 4,400 |
| Pretax Income | 2,933 | 3,630 | 4,010 | 4,454 | 6,018 | |
| Net Profit Attributable to Owner of Parent | 1,640 | 2,250 | 2,596 | 3,014 | 4,076 | 3,100 |
| Cash & Short-Term Investments | 9,745 | 10,296 | 13,139 | 14,641 | 19,146 | |
| Total assets | 30,972 | 30,924 | 33,444 | 36,195 | 40,058 | |
| Total Debt | 702 | 441 | 367 | 107 | 209 | |
| Net Debt | -9,042 | -9,856 | -12,773 | -14,534 | -18,937 | |
| Total liabilities | 8,504 | 7,560 | 8,361 | 8,194 | 9,331 | |
| Total Shareholders’ Equity | 21,920 | 23,069 | 24,763 | 27,645 | 30,335 | |
| Net Operating Cash Flow | 2,569 | 2,802 | 4,794 | 3,412 | 4,391 | |
| Capital Expenditure | 1,183 | 945 | 824 | 1,052 | 957 | |
| Net Investing Cash Flow | -1,395 | -957 | -763 | -889 | 1,248 | |
| Net Financing Cash Flow | 1,193 | -1,234 | -1,192 | -1,371 | -1,127 | |
| Free Cash Flow | 2,486 | 2,734 | 4,608 | 2,860 | 4,083 | |
| ROA (%) | 5.71 | 7.27 | 8.06 | 8.66 | 10.69 | |
| ROE (%) | 8.63 | 10.00 | 10.85 | 11.50 | 14.06 | |
| EPS (Yen) | 130.0 | 171.3 | 197.7 | 231.8 | 314.0 | 240.1 |
| BPS (Yen) | 1,672.2 | 1,754.8 | 1,895.9 | 2,130.2 | 2,337.1 | |
| Dividend per Share (Yen) | 54.00 | 58.00 | 70.00 | 80.00 | 120.00 | 120.00 |
| Shares Outstanding (Million shares) | 13.15 | 13.15 | 13.15 | 13.15 | 13.15 |
Source: Omega Investment from company data, rounded to the nearest whole number.
Share price
Key stock price data
Financial data (quarterly basis)
| Unit: million yen | 2024/5 | 2025/5 | 2026/5 | ||||||
| 2Q | 3Q | 4Q | 1Q | 2Q | 3Q | 4Q | 1Q | 2Q | |
| (Income Statement) | |||||||||
| Sales | 6,585 | 5,857 | 8,418 | 8,370 | 6,507 | 6,163 | 8,639 | 9,086 | 6,990 |
| Year-on-year | 10.1% | 9.3% | 6.4% | -0.6% | -1.2% | 5.2% | 2.6% | 8.6% | 7.4% |
| Cost of Goods Sold (COGS) | 4,092 | 3,773 | 4,933 | 4,785 | 4,117 | 3,842 | 4,809 | 5,222 | 4,342 |
| Gross Income | 2,493 | 2,084 | 3,485 | 3,586 | 2,389 | 2,321 | 3,829 | 3,865 | 2,648 |
| Gross Income Margin | 37.9% | 35.6% | 41.4% | 42.8% | 36.7% | 37.7% | 44.3% | 42.5% | 37.9% |
| SG&A Expense | 1,778 | 1,710 | 1,989 | 1,856 | 1,894 | 1,908 | 2,177 | 2,072 | 2,019 |
| EBIT (Operating Income) | 671 | 310 | 1,418 | 1,652 | 448 | 370 | 1,579 | 1,712 | 589 |
| Year-on-year | 67.2% | -6.6% | 11.2% | -9.9% | -33.2% | 19.4% | 11.4% | 3.7% | 31.4% |
| Operating Income Margin | 10.2% | 5.3% | 16.8% | 19.7% | 6.9% | 6.0% | 18.3% | 18.8% | 8.4% |
| EBITDA | 988 | 622 | 1,737 | 1,953 | 765 | 694 | 1,914 | 2,072 | 954 |
| Pretax Income | 672 | 466 | 1,437 | 1,708 | 508 | 410 | 3,393 | 1,789 | 598 |
| Consolidated Net Income | 408 | 289 | 1,061 | 1,153 | 322 | 247 | 2,387 | 1,194 | 350 |
| Minority Interest | 10 | 6 | 11 | 7 | 8 | 8 | 12 | 0 | 9 |
| Net Income ATOP | 398 | 283 | 1,050 | 1,146 | 314 | 239 | 2,376 | 1,194 | 340 |
| Year-on-year | 72.8% | 24.9% | 20.6% | -10.7% | -21.1% | -15.4% | 126.2% | 4.1% | 8.3% |
| Net Income Margin | 6.0% | 4.8% | 12.5% | 13.7% | 4.8% | 3.9% | 27.5% | 13.1% | 4.9% |
| (Balance Sheet) | |||||||||
| Cash & Short-Term Investments | 14,274 | 14,057 | 14,641 | 16,248 | 16,534 | 15,910 | 19,146 | 19,862 | 20,036 |
| Total assets | 33,121 | 31,703 | 36,195 | 34,614 | 35,209 | 33,879 | 40,058 | 38,452 | 38,850 |
| Total Debt | 172 | 139 | 107 | 100 | 93 | 85 | 209 | 184 | 167 |
| Net Debt | -14,102 | -13,917 | -14,534 | -16,148 | -16,441 | -15,824 | -18,937 | -19,677 | -19,869 |
| Total liabilities | 6,720 | 5,593 | 8,194 | 6,088 | 6,544 | 5,539 | 9,331 | 7,630 | 7,728 |
| Total Shareholders’ Equity | 26,063 | 25,766 | 27,645 | 28,161 | 28,294 | 27,959 | 30,335 | 30,440 | 30,757 |
| (Profitability %) | |||||||||
| ROA | 8.63 | 9.16 | 8.66 | 8.57 | 8.18 | 8.39 | 10.69 | 11.29 | 11.20 |
| ROE | 11.04 | 11.40 | 11.50 | 10.65 | 10.28 | 10.24 | 14.06 | 14.07 | 14.05 |
| (Per-share) Unit: JPY | |||||||||
| EPS | 30.6 | 21.8 | 80.9 | 88.3 | 24.2 | 18.4 | 183.0 | 92.3 | 26.4 |
| BPS | 2,008.3 | 1,985.4 | 2,130.2 | 2,170.0 | 2,179.8 | 2,154.0 | 2,337.1 | 2,358.7 | 2,382.8 |
| Dividend per Share | 40.00 | 0.00 | 40.00 | 0.00 | 45.00 | 0.00 | 75.00 | 0.00 | 60.00 |
| Shares Outstanding (million shares) | 13.15 | 13.15 | 13.15 | 13.15 | 13.15 | 13.15 | 13.15 | 13.15 | 13.15 |
Source: Omega Investment
Financial data (full-year basis)
| Unit: million yen | 2018 | 2019 | 2020 | 2021 | 2022 | 2023 | 2024 | 2025 |
| (Income Statement) | ||||||||
| Sales | 15,792 | 18,258 | 19,117 | 24,777 | 25,318 | 27,568 | 29,278 | 29,679 |
| Year-on-year | 4.2% | 15.6% | 4.7% | 29.6% | 2.2% | 8.9% | 6.2% | 1.4% |
| Cost of Goods Sold | 9,590 | 11,388 | 11,484 | 15,071 | 14,891 | 16,596 | 17,542 | 17,554 |
| Gross Income | 6,202 | 6,870 | 7,633 | 9,706 | 10,427 | 10,972 | 11,736 | 12,125 |
| Gross Income Margin | 39.3% | 37.6% | 39.9% | 39.2% | 41.2% | 39.8% | 40.1% | 40.9% |
| SG&A Expense | 4,541 | 4,946 | 5,247 | 6,878 | 6,641 | 6,923 | 7,253 | 7,818 |
| EBIT (operating profit) | 1,534 | 1,780 | 2,245 | 2,707 | 3,561 | 3,812 | 4,232 | 4,049 |
| Year-on-year | 3.9% | 16.0% | 26.1% | 20.6% | 31.5% | 7.1% | 11.0% | -4.3% |
| Operating profit Margin | 9.7% | 9.7% | 11.7% | 10.9% | 14.1% | 13.8% | 14.5% | 13.6% |
| EBITDA | 2,149 | 2,424 | 2,852 | 3,646 | 4,732 | 5,031 | 5,482 | 5,326 |
| Pretax Income | 1,691 | 1,913 | 2,453 | 2,933 | 3,630 | 4,010 | 4,454 | 6,018 |
| Consolidated Net Income | 1,137 | 1,273 | 1,685 | 1,804 | 2,301 | 2,625 | 3,049 | 4,110 |
| Minority Interest | 26 | 36 | 130 | 164 | 51 | 29 | 35 | 35 |
| Net Income ATOP | 1,111 | 1,237 | 1,555 | 1,640 | 2,250 | 2,596 | 3,014 | 4,076 |
| Year-on-year | 2.7% | 11.3% | 25.8% | 5.4% | 37.2% | 15.4% | 16.1% | 35.2% |
| Net Income Margin | 7.0% | 6.8% | 8.1% | 6.6% | 8.9% | 9.4% | 10.3% | 13.7% |
| (Balance Sheet) | ||||||||
| Cash & Short-Term Investments | 6,751 | 7,845 | 7,365 | 9,745 | 10,296 | 13,139 | 14,641 | 19,146 |
| Total assets | 20,033 | 22,442 | 26,450 | 30,972 | 30,924 | 33,444 | 36,195 | 40,058 |
| Total Debt | 102 | 749 | 2,808 | 702 | 441 | 367 | 107 | 209 |
| Net Debt | -6,650 | -7,096 | -4,557 | -9,042 | -9,856 | -12,773 | -14,534 | -18,937 |
| Total liabilities | 5,488 | 7,082 | 9,867 | 8,504 | 7,560 | 8,361 | 8,194 | 9,331 |
| Total Shareholders’ Equity | 14,248 | 15,000 | 16,083 | 21,920 | 23,069 | 24,763 | 27,645 | 30,335 |
| (Cash Flow) | ||||||||
| Net Operating Cash Flow | 1,577 | 1,829 | 3,111 | 2,569 | 2,802 | 4,794 | 3,412 | 4,391 |
| Capital Expenditure | 601 | 528 | 1,146 | 1,183 | 945 | 824 | 1,052 | 957 |
| Net Investing Cash Flow | -940 | -806 | -5,229 | -1,395 | -957 | -763 | -889 | 1,248 |
| Net Financing Cash Flow | -481 | -30 | 1,477 | 1,193 | -1,234 | -1,192 | -1,371 | -1,127 |
| Free Cash Flow | 1,468 | 1,753 | 2,689 | 2,486 | 2,734 | 4,608 | 2,860 | 4,083 |
| (Profitability ) | ||||||||
| ROA (%) | 5.75 | 5.82 | 6.36 | 5.71 | 7.27 | 8.06 | 8.66 | 10.69 |
| ROE (%) | 8.00 | 8.46 | 10.01 | 8.63 | 10.00 | 10.85 | 11.50 | 14.06 |
| Net Margin (%) | 7.03 | 6.77 | 8.14 | 6.62 | 8.89 | 9.42 | 10.30 | 13.73 |
| Asset Turn | 0.82 | 0.86 | 0.78 | 0.86 | 0.82 | 0.86 | 0.84 | 0.78 |
| Assets/Equity | 1.39 | 1.45 | 1.57 | 1.51 | 1.38 | 1.35 | 1.33 | 1.32 |
| (Per-share) Unit: JPY | ||||||||
| EPS | 99.4 | 110.6 | 139.0 | 130.0 | 171.3 | 197.7 | 231.8 | 314.0 |
| BPS | 1,274.7 | 1,342.0 | 1,409.7 | 1,672.2 | 1,754.8 | 1,895.9 | 2,130.2 | 2,337.1 |
| Dividend per Share | 50.00 | 50.00 | 54.00 | 54.00 | 58.00 | 70.00 | 80.00 | 120.00 |
| Shares Outstanding (million shares) | 12.94 | 12.94 | 12.94 | 13.15 | 13.15 | 13.15 | 13.15 | 13.15 |
Source: Omega Investment