2026-06-05
Home
Japanese

Omega Investment Co., Ltd.
TOKYO ELECTRON DEVICE (Investment report – Basic)
| Share price (2/19) | ¥3,765 | Dividend Yield (26/3 CE) | 2.6 % |
| 52weeks high/low | ¥2,326/3,860 | ROE(25/3 act) | 19.1 % |
| Avg Vol (3 month) | 144.5 thou shrs | Operating margin (25/3 act) | 5.8 % |
| Market Cap | ¥117.98 bn | Beta (5Y Monthly) | 1.32 |
| Enterprise Value | ¥139.02 bn | Shares Outstanding | 31.336 mn shrs |
| PER (26/3 CE) | 15.4 X | Listed market | TSE Prime section |
| PBR (25/3 act) | 2.3 X |
| Click here for the PDF version of this page |
| PDF version |
A high-quality company that builds growth through business cycles. Consider increasing holdings at the trough of the cycle.
Investment conclusion
An excellent cyclical growth company. Gradually increase equity holdings while assessing the quality of profit momentum.
TOKYO ELECTRON DEVICE LIMITED (hereinafter, the “Company”), while being affected by the semiconductor cycle, is a cyclical growth company (with waves, but growing over the long term) that builds up profit margins through higher value-added in the product mix and the capture of commercial rights, and is an excellent company overall. We believe an investment stance of gradually building a position during phases when the stock valuation is modest, while assessing the likelihood of a sustained recovery in business performance, is sensible.
The breakout above the ROE range since FY3/2021 is impressive. While financial leverage also contributed, the core was shifting the sales mix from electronic product sales to projects and areas where it is easier to capture value added, such as technical support, thereby improving the net profit margin. In recent years, profit momentum has slowed due to the prolonged inventory adjustment on the customer side, and the stock price has also remained in an adjustment phase; however, if the market inventory adjustment enters its final stage and demand recovers going forward, profits will recover against the backdrop of maintaining and expanding commercial rights. A bottoming of ROE and a reversal of the ROIC–WACC spread will come into view. The EPS CAGR for the past four years is high at +29.8%, whereas the market’s expected EPS growth rate implied by the current forecast PER of 15.2x is estimated to be in the mid-teens percentage on a medium-term basis. In other words, the stock price has been strong, but in the equity market, a cautious view of the Company still prevails. The background likely includes concerns about the likelihood of a sustained recovery in business performance, maturation, competition, and fluctuations in customer investment.
The sources of the Company’s earning power lie in (1) a position that makes it easy to bundle design support, technical support, etc., in addition to trading company functions, (2) the reproducibility of orders through the accumulation of commercial rights, and (3) the credibility and stability of business operations brought about by a stable shareholder structure in which Tokyo Electron, a major shareholder, holds about one-third. These enable the Company to reliably translate projects into orders in a cycle upturn and strengthen the momentum of margin recovery.
In considering additional purchases of shares, we want to confirm at least indications that the market inventory adjustment in major customer areas is ending, that orders are improving, that leading indicators of sales are rising, and that the gross profit margin and operating profit margin are bottoming out. If the adjustment in the business environment lasts longer than expected, if the maintenance and expansion of commercial rights falls short of expectations, or if growth drivers (such as in-house products) slow, the premises of the recovery scenario will be undermined; therefore, while the purchase of the Company’s shares should be judged with caution, there may be room to consider adjusting the position depending on the situation.
The Company’s shares are high-beta (β: 1.32). While short-term stock price volatility is high, the current high level of capital efficiency—ROE of 19.1% and ROIC of 12.4%—is attractive. The Company’s balance sheet shows net debt of 29.184 billion yen, and during a cyclical downturn, the financial burden can amplify stock price fluctuations. On the other hand, if margin improvement during the recovery phase is confirmed, we believe the stock price will move toward re-rating.
1. Company overview
A hybrid company that combines specialized trading company functions in semiconductors and IT with manufacturer functions.
The Company is a specialized trading company that handles cutting-edge products in the semiconductor and IT sectors and also provides manufacturing functions, including design and development. It was established in March 1986, and its equity is 50.0 billion yen.
Consolidated employees total 1,424 (as of September 30, 2025, of which engineer and technical worker account for approximately 40%), and it has built a structure to accumulate commercial rights based on technical capabilities, rather than mere distribution. The bases and group comprise 15 domestic bases, six subsidiaries, and one affiliated company. As a major shareholder, Tokyo Electron holds 33.8%, and this shareholder structure supports the credibility and stability of business operations.
The business has two central pillars. In the Computer Systems business (hereinafter, the CN Business), in addition to selling networks, storage, and software, it also provides maintenance services. In the semiconductor and Electronic Components business (hereinafter, the EC Business), in addition to sales of semiconductors, boards, software, electronic components, etc., it also includes design and development. Note that the private brand business (hereinafter, the PB Business) is included in the EC Business, and in the analysis below, we need to separate and view where the Company’s value added is accumulated as differences in the earnings structures of the CN Business and the EC Business.
2. Business characteristics and details
The CN Business supports, and the EC Business aims for upside. The quality of sales that determines profit margins.
Looking at the results for FY3/2025, of net sales of 216.3 billion yen, the EC Business accounts for 179.0 billion yen (82.7%) and the CN Business accounts for 37.3 billion yen (17.3%). Of the total ordinary income of 11.415 billion yen, the CN Business accounts for 5.266 billion yen (46.1%) and the EC Business accounts for 6.149 billion yen (53.9%), meaning the profit contribution of the CN Business is larger than its sales composition ratio. Whether the Company can increase the ratio of profitable projects rather than merely grow volume is the key evaluation point.
The CN Business combines sales of network and storage equipment and security products with maintenance and monitoring services. In FY3/2025, sales of network and storage equipment and security products were strong, and demand for maintenance and monitoring services continued to expand; as a result, the CN Business achieved higher sales and profits. Because this area tends to capture replacement and operational demand and has a profile in which orders and gross profit margins are less likely to decline, it is effective at stabilizing the overall business portfolio.
The EC Business is more likely to be affected by market conditions and market inventory adjustments. However, profit margins change depending on how commercial rights are maintained and expanded, and how value added is captured. In FY3/2025, although the expansion of customer commercial rights progressed, the impact of supply chain inventory adjustments was prolonged, and the EC Business posted lower sales and profits. In the most recent FY3/2026 third-quarter cumulative results, the EC Business was affected by a decline in sales for industrial equipment, while sales for automotive applications were steady, partly due to the impact of expanding commercial rights. As the Company states, the “quality of demand” and commercial rights split outcomes by business environment phase.
We want to confirm that the thicker areas, such as the PB Business, such as design and mass production outsourcing and areas with a strong in-house character, become, the easier it is to capture value added than simple distribution, and the more the room expands for the qualitative improvement of profit margins that the Company advocates.
3. Major shareholders and investment trends
While stable shareholders are thick due to Tokyo Electron holdings and internal ownership, stock prices hinge on institutional investor holding trends.
In addition to Tokyo Electron holding 33.82%, frameworks equivalent to employee and officer holdings, such as the Tokyo Electron Device employee stock ownership plan, the Tokyo Electron Device officer compensation BIP trust, and the Tokyo Electron Device trust-type employee stock ownership incentive plan, are also lined up among the top shareholder composition. The total of these three frameworks is 10.48%, and together with the parent company holding, it corresponds to 44.30%. A thick shareholder base expected to hold stably is a feature of the Company’s shareholder distribution.
On the other hand, according to FactSet aggregation, insider ownership is 34.99%, institutional investor ownership is 12.55%, and the free float ratio is 65.0%. While there are periods when the parent company and internal holdings provide support, the formation of the stock price trend is likely influenced by how much domestic and overseas institutional investor holdings accumulate within the free float.
Among top holders, domestically Nomura Asset Management (2.29%), Amova Asset Management (1.03%), and Daiwa Asset Management (0.99%) are included, and overseas, asset managers including The Vanguard Group, Inc. (2.04%) are confirmed. Some holdings may be index- or passive-managed, and we should note that index-linked rebalancing and fund flows can appear as changes in holding ratios. When earnings improve, whether institutional investors’ positions, including trust accounts, turn upward in parallel with changes in fundamentals is likely to influence the stock price’s direction.
4. Medium-term management plan
VISION2030 clarifies that profit growth is prioritized over sales growth. The crucial points are the return of profit margins and PB growth.
The Company has set forth the medium-term management plan “VISION2030” for FY3/2026 through FY3/2030, and sets, as a financial model for the final year FY3/2030, targets of net sales of 300.0–350.0 billion yen, an ordinary income margin of 8% or more, and ROE of 20% or more. The business portfolio is set at 15% for the CN Business, 75% for EC, and 10% for PB in terms of sales composition ratio, and the target ordinary income margins by business are 12% for the CN Business, 7% for EC, and 10% for PB; the framework of the plan lies in raising profit margins while growing sales.
What is essential is not the target values themselves, but where profit margins are created. The CN Business advocates strengthening the service business and expanding solution areas. It is positioned as an area where gross profit is less likely to fall even in the trough of the business cycle. The EC Business advocates focusing on growth markets and expanding solution-type businesses. In phases, as the demand environment recovers, these efforts are designed to contribute to profit expansion. The PB Business explicitly indicates a 10% profit margin target, indicating that the Company intends to focus on areas where it is easier to capture value added than in conventional merchandise sales.
Regarding capital policy as well, VISION2030 states a policy of enhancing financial soundness by maintaining appropriate inventory levels, while promoting growth investments (technology development, business expansion, internal and external DX, and human resource development) and aiming for an equity ratio of 40% or more and ROE of 20% or more. Shareholder returns will be implemented in line with business performance; separately, the payout ratio is set at a guideline of 40% for now. As a process for stock price re-rating, it is reasonable to view it as proceeding in the order of: convergence of market inventory adjustment → margin recovery → expansion of capacity for returns.
The Company also states in its outlook for FY3/2026 that, in the semiconductor and electronic device areas, adjustments will continue through the first half due to prolonged market inventory adjustments, and recovery will begin in the second half. Therefore, in measuring the progress of VISION2030, the three checkpoints when considering investment are: (1) whether the market inventory phase of the EC Business improves toward the second half as assumed, (2) whether gross profit from services and solutions is accumulating in the CN Business, and (3) whether the ratio and profitability of the PB Business are moving toward the planned direction.
5. Regarding overseas business
Overseas is supplementary, but directly connected to actual demand in the EC Business. Exchange rates and the base network determine the swings in profits.
The Company’s overseas presence is reflected in EC Business sales by overseas consolidated subsidiaries. In FY3/2025, net sales of overseas consolidated subsidiaries rose to 51.8 billion yen, and the ratio to EC sales rose to 28.9% (YoY +4.4 pt). U.S. dollar-denominated net sales were 339 million U.S. dollars (YoY −4.5%), down from the previous year, and this metric is sensitive to changes in volume, unit price, and exchange rates. In other words, overseas should be considered not so much as upside potential as an area likely to affect the swing of the EC Business, depending on the cycle phase.
Net sales by region are: Japan 164.5 billion yen, Asia (China 18.7 billion yen, others 25.0 billion yen), and others 8.0 billion yen. More than half of sales are domestic, with overseas sales concentrated in Asia. Note that net sales by region are aggregated based on customer location, and therefore, increases or decreases by region are likely to be affected by changes in the supply chain placement, etc.
Overseas should be viewed not so much as upside potential as an area likely to affect the swing of the EC Business, depending on the cycle phase. Therefore, before assessing the high overseas ratio as a source of growth potential, it is necessary to examine how gaps in the base network and exchange rate fluctuations affect business performance. Business performance can be affected when demand shifts to regions without a sales presence, as customers shift production overseas, or when sales activities become difficult due to local constraints. There is also exchange rate risk associated with import/export transactions and certain foreign-currency-denominated transactions with domestic customers. While the Company states it will minimize the impact through forward exchange contracts and sales price adjustments, rapid fluctuations could materially affect business performance.
The key points are to check, on a quarterly basis, overseas business evaluation not from the view that a higher overseas ratio means greater growth potential, but rather: (1) whether the sales ratio of overseas consolidated subsidiaries is maintained or rises in the recovery phase of the EC Business, (2) how USD/JPY fluctuations appear in the gross profit margin, and (3) whether the Company can follow customers’ production location shifts with its base network and commercial rights.
6. Long-term performance
Performance fluctuates with the cycle, but earnings power has risen, and the question is whether profitability will increase again in the next recovery phase.
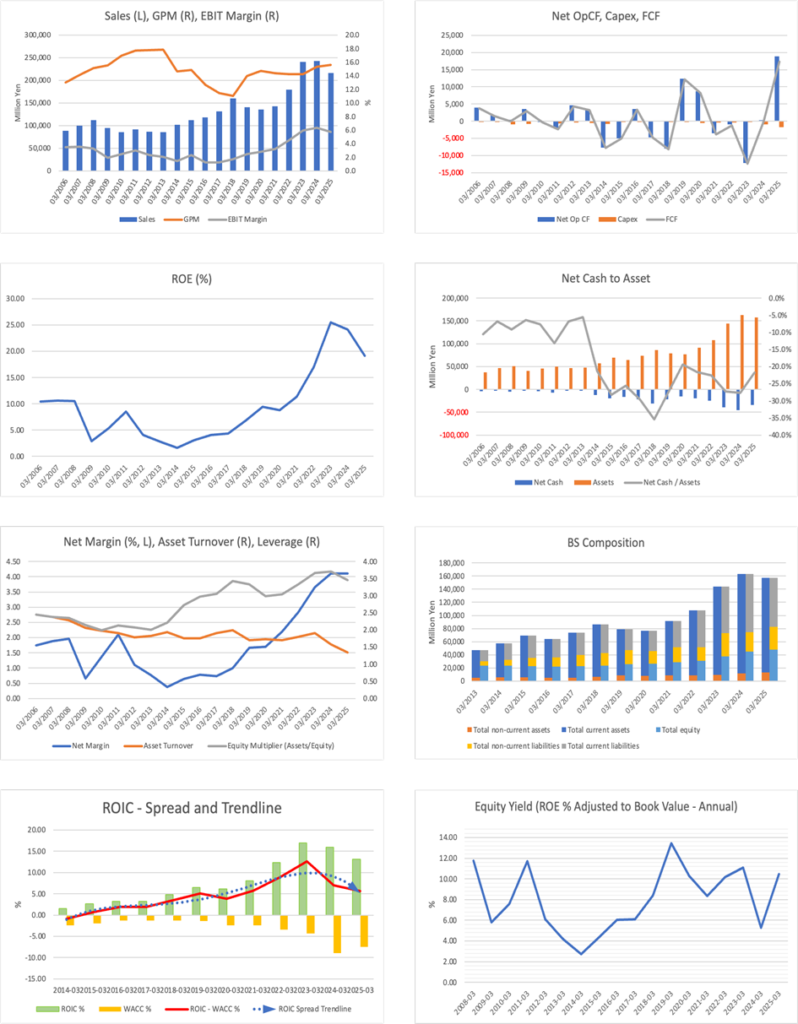
The Company’s net sales expanded from 117.8 billion yen in FY3/2016 to 240.3 billion yen in FY3/2023 and 242.8 billion yen in FY3/2024; however, in FY3/2025, net sales declined to 216.3 billion yen during the cycle-adjustment phase. ROE is also strongly cyclical, trending upward from 4.2% in FY3/2016 to 25.5% in FY3/2023 and 24.1% in FY3/2024, then declining to 19.1% in FY3/2025.
Even in consolidated data for the most recent five years, net sales grew from 143.2 billion yen in FY3/2021 to 240.3 billion yen in FY3/2023, and then decreased to 216.3 billion yen in FY3/2025. On the profit side, ordinary income moved at 4.62 billion yen in FY3/2021, 13.92 billion yen in FY3/2024, and 11.41 billion yen in FY3/2025, and EPS moved at 294.8 yen in FY3/2023, 333.4 yen in FY3/2024, and 295.7 yen in FY3/2025; while being affected by the adjustment phase, the profit level is in a higher range compared to the past. ROE also declined from 25.5% in FY3/2023 to 24.1% in FY3/2024 and 19.1% in FY3/2025, but compared to past low-ROE periods, the bottom has been raised.
The key point is that while sales fluctuate due to the semiconductor cycle, as profit margins have improved since FY3/2021, the Company has moved toward a structure in which ROE can also increase by one step. Going forward, in phases, when market inventory adjustment enters its final stage, it is essential to use, as the evaluation axis for the long-term track, not the sales rebound itself, but how far the gross profit margin and operating profit margin recover.
7. Performance in the most recent financial results
Deceleration due to the prolonged market inventory adjustment. The CN Business supports, and the EC Business pushes down profits.
Consolidated results for FY3/2026 third-quarter cumulative (April 1, 2025–December 31, 2025) were net sales of 146.7 billion yen (YoY −9.5%), operating income of 6.30 billion yen (YoY −28.8%), ordinary income of 6.02 billion yen (YoY −24.0%), and quarterly net income attributable to owners of parent of 5.03 billion yen (YoY −9.8%). While SG&A expenses were generally flat despite the sales decline, operating income declined significantly due to a contraction in gross profit.
Looking at segments, the fluctuation is clearer. The CN Business secured higher sales and higher profits with net sales of 29.4 billion yen (YoY +12.5%) and segment income of 4.17 billion yen (YoY +31.1%). In comparison, the EC Business posted a significant decline in profits with net sales of 117.3 billion yen (YoY −13.7%) and segment income of 1.85 billion yen (YoY −61.0%). In other words, while the CN Business was solid, the EC Business’s decline in profits restrained total earnings growth in the quarter.
According to the Company’s explanation, the CN Business achieved higher sales and profits, driven by strong performance in storage-related products, maintenance and monitoring services, and security-related products. The EC Business, while noting that Sales for automotive applications were steady, partly due to expanding customer commercial rights, reported lower sales and profits due to a decline in sales for industrial equipment. At the same time, it can be confirmed that the CN Business supports the market inventory adjustment phase. Whether stock price valuation revisions progress depends on whether a convergence in market inventory adjustment is evident in the EC Business and, together, whether margin recovery can be confirmed numerically.
The progress rate is 73.4% for net sales, 66.2% for ordinary income, and 69.9% for net income attributable to owners of parent, relative to the full-year forecast. At this point, rather than a rebound in volume, the EC Business’s profit margin is likely to determine the likelihood of a full-year landing and the stock price’s direction.
8. Full-year performance forecast
The company’s plan projects lower sales and profits. In the second half, the extent of profitability recovery is the focus.
The Company’s plan for FY3/2026 (April 1, 2025–March 31, 2026) is net sales of 200 billion yen (YoY −7.6%), ordinary income of 9.10 billion yen (YoY −20.3%), net income attributable to owners of parent of 7.20 billion yen (YoY −18.9%), and EPS of 244.0 yen, with no revision to the forecast in the recent period.
The Company’s view is organized around continued adjustment for the EC Business and the PB Business in the first half, and a shift to a recovery trend from the second half, with the CN Business remaining solid. The phase is such that whether the full-year forecast will be achieved depends more on how far profit margins of the EC Business and the PB Business return than on a rebound in volume. In fact, progress at the cumulative third-quarter point is 73.4% for net sales, 66.2% for ordinary income, and 69.9% for net income, with the profit side lagging. Even when discussing upside potential toward year-end, it is appropriate to confirm whether orders and the inventory phase, or an improvement in gross profit margins, support the premise that gross profit in the EC Business and the PB Business will return in the second half.
Dividends are indicated as an annual 99.00 yen (interim 35.00 yen and year-end 64.00 yen) as the forecast for FY3/2026, with no revision from the most recently announced value. Maintaining the dividend level even during a profit plateau can support the stock price; however, unless the certainty of profit recovery increases, the stock price’s upside will be limited, and a re-rating of the valuation is unlikely.
9. Growth strategy and risks
The axis of growth is solutions and services, and the risks are changes in the semiconductor cycle, commercial rights, and procurement conditions.
What the Company emphasizes in VISION2030 is accelerating profit growth, with the profit growth rate exceeding the net sales growth rate, rather than net sales expansion itself. The core of the growth strategy for the CN Business is the expansion of solution areas and the strengthening of the service business, designed to capture the end-to-end process from design and construction through introduction, operation, monitoring, and maintenance. In the EC Business, it advocates focusing on growth markets and expanding a solution-type business leveraging specialized semiconductor knowledge. The key question is whether it can recover profit margins while maintaining commercial rights in phases as the demand environment recovers. The PB Business is disclosed as part of the EC Business, with profit margin targets presented separately. A clear direction is evident to focus on thickening areas where it is easier to capture value added, such as design outsourcing and in-house products.
Risks are organized by priority, with items prioritized based on high impact and high frequency of occurrence. First, there is a risk that EC’s sales and profits will collapse for longer than expected due to fluctuations in the semiconductor cycle and customer inventory levels. Second, on the procurement side, dependence on suppliers is high, and major suppliers Infineon, TI, and NXP account for a certain proportion of total procurement, and agency agreements are non-exclusive; therefore, if transfers of commercial rights or consolidation and reorganization on the supplier side occur, business performance impacts can arise, this point is essential.
Third, most foreign-currency-denominated transactions are in U.S. dollars, and rapid changes in the USD/JPY exchange rate can significantly affect business performance. While policies are shown to mitigate impacts through forward exchange contracts and price revisions, in the short term, this tends to manifest as swings in gross profit. In addition, part of working capital is financed through borrowings and commercial paper, and rapid changes in interest rates pose a risk.
Fourth, as customers’ overseas production transfers progress, there is a risk that transfers to regions without sales bases and local constraints will make sales activities difficult and call into question the ability to enforce commercial rights. Finally, because this is a business focused on post-sale collections, there is also the possibility that bad debts arising from credit concerns and impairment of goodwill and intangible assets associated with M&A, etc., could reduce profit and loss.
The growth strategy itself has a relatively straightforward role in creating profit margins, but in the short term, the cycle, market inventory, procurement, and exchange rates tend to drive fluctuations in business performance. Confirmation of growth should focus on the accumulation of services in the CN Business and development of the PB Business, and risk management should focus on checking the market inventory phase in the EC Business and key suppliers and exchange rate sensitivity, this two-layer approach is reasonable.
10. Stock price trends and equity valuation
The stock price has recovered from its low, but the realization of upside depends on numerical confirmation of market inventory adjustment and margin recovery in the EC Business.
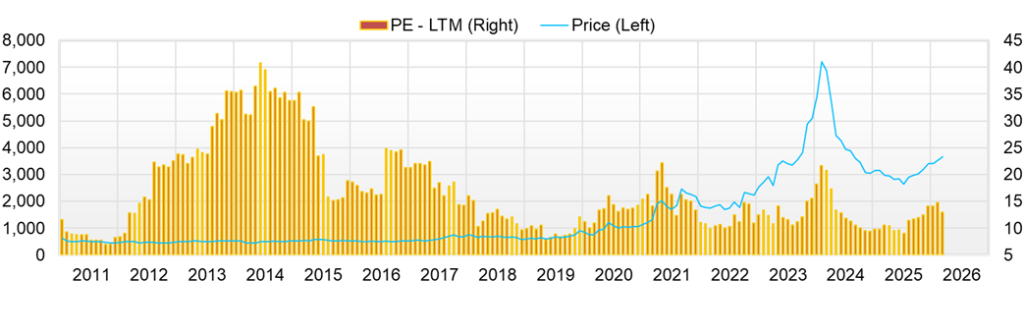
The closing price on February 3, 2025, was 2,960 yen; on February 3, 2026, it was 3,650 yen, and the stock price return over the 12 months was approximately 23.3%. The range for the same period was a low of 2,326 yen (April 7, 2025) and a high of 3,700 yen (January 22, 2026), with a price range of approximately 1.59x. In other words, while the stock price recovered after forming a low during the adjustment phase, recent upward momentum has paused, and it has shown heightened sensitivity to changes in how business performance is perceived.
We evaluate valuation using a forecast PER of 15.2x, an actual PBR of 2.18x, and a market capitalization of 114.2 billion yen. What is essential is not the level of PER or PBR itself, but separating the conditions that drive valuation and the downside factors that could arise unexpectedly. Capital efficiency is attractive at ROE of 19.1% and ROIC of 12.4%. At the same time, the Company has net debt, and in a cyclical downturn, profit fluctuations are likely to erode shareholder value. In the short term, rather than a discussion of cheapness or expensiveness, whether materials indicate an increased likelihood of business performance recovery tends to influence the stock price.
The center of short-term risk lies in determining when it can be confirmed in numbers that the market inventory adjustment in the EC Business has entered its final stage. The downside scenario is one in which the adjustment lasts longer than expected; not only does the sales rebound lag, but the recovery in gross profit margin and operating profit margin is also delayed. Even if the CN business provides support, the recovery of profit margins in the EC business tends to contribute more to upward revisions in stock valuations. When this recovery cannot be confirmed, valuation levels are unlikely to rise.
Next, there is a risk that the maintenance and expansion of commercial rights will not progress as expected. The weaker the demand environment, the more pronounced customers’ cost consciousness becomes, and price conditions tend to tighten. If an improvement in the project mix is not evident, the outlook for margin improvement tends to weaken. As an external factor, the high β amplifies periods when changes in semiconductor-sector sentiment, interest rates, and exchange rates are reflected in the stock price. In phases when risk aversion strengthens, the stock price can easily decline even without significant changes in business performance or financials. Also, on the financial side, when a company is in net interest-bearing debt, interest rates and working capital burdens tend to weigh on investor sentiment. On the supply-demand side, the further the stock has recovered from its low, the more good news is priced in and the greater the sensitivity to bad news.
Based on the above, for the time being, without placing excessive optimism assuming the solidness of the CN Business, we want to confirm, in order, for the EC Business: improvement in the market inventory phase, a bottoming of orders and sales, and a reversal of the gross profit margin and operating profit margin. Until these can be confirmed, the likelihood of business performance recovery that underpins the investment conclusion is not sufficiently solidified.
11. Equity investment conclusion derived from considerations of performance and stock price
The key to valuation is the likelihood of recovery. Rather than moving first, confirm and then thicken.
From the Company’s considerations of performance and stock price to date, the investment conclusion for this issue is organized as depending not on whether the semiconductor cycle itself returns, but on when and to what extent the resolution of market inventory adjustment and recovery of profit margins can be confirmed numerically. While the stock price has recovered over the past 12 months, rather than being a phase of expectation-led growth based on excessive growth assumptions, it is now assessing the likelihood of recovery. Therefore, it is more reasonable to adjust the weight of investment actions while confirming the possibility on a quarterly basis, rather than reaching a conclusion in a lump sum.
Looking at the indicators of forecast PER of 15.2x, actual PBR of 2.18x, market capitalization of 114.2 billion yen, ROE of 19.1%, ROIC of 12.4%, and β of 1.32, capital efficiency is high, but in the short term, the stock price is likely to fluctuate with how profit recovery appears. In particular, even if the CN Business supports, the condition for stock price re-rating is the return of profit margins in the EC Business; if recovery is delayed, the view that it is a stock that takes time will strengthen, and stock price multiples such as PER and PBR are less likely to rise. If a reversal of the gross profit margin and operating profit margin can be confirmed, the market discount that assumes a conservative long-term growth rate tends to narrow, and room for re-rating tends to emerge.
From an operational perspective, we want to set the conditions for additional purchases clearly. Specifically, we will thicken the position in phases where we can confirm, in order: (1) that the EC Business market inventory adjustment is entering its final stage, (2) an improvement in orders or leading indicators of sales, and (3) a bottoming and reversal of the gross profit margin and operating profit margin. On the other hand, if any of the following becomes clear: (1) prolonged adjustment continues, (2) signs appear that maintenance and expansion of commercial rights is failing, or (3) growth of value-added areas, including the PB Business, slows, we should prioritize, for the time being, while watching the situation, adjusting the position to a more efficient level. The Company is a type of stock where, rather than buying at the trough and selling at the peak, positions are strengthened step by step while confirming margin recovery.
12. Trends in return on equity (ROE) and current evaluation
ROE is high, but maintaining it is the focus. Will it ride on the 20% line again in the recovery phase?
The Company positions ROE as a core indicator of corporate value and targets a ROE of at least 20% in the medium term. In terms of results, ROE for the most recent three years has remained high at 25.5% in FY3/2023, 24.1% in FY3/2024, and 19.1% in FY3/2025, but it has declined from the peak. This reflects the impact of the cycle adjustment phase, and ROE is likely to appear high but declining. The key in the current phase is not whether ROE is high or low, but whether it will remain stable at the 20% line again, driven by market inventory adjustments and margin recovery.
While the ROE of 19.1% is still sufficiently high, if ROE collapses at the trough of the cycle, the explanatory power of PBR of 2.18x declines, and the stock price tends to adjust first. Conversely, when a reversal in gross profit margin and operating profit margin is confirmed, a bottom in ROE becomes easier to see, and a return to valuation is more likely. The Company also sets a target of ROE of 20% or more in VISION2030. If it can be confirmed that it is approaching this target again during the recovery phase, the level of conviction from a capital-efficiency perspective will increase.
13. Analysis of economic value creation based on ROIC and WACC
ROIC of 12.4% is high. The focus is on whether the state of exceeding WACC can be maintained even during the cycle-adjustment phase.
The Company’s ROIC is 12.4%, and capital efficiency itself is at a high level. From the viewpoint of economic value creation (EVA), the principle is simple: as long as ROIC exceeds WACC, the business accumulates value. The current WACC is estimated at approximately 7% based on market data (risk-free rate and equity risk premium), a β of 1.32, and disclosed financial data (cost of debt, tax rate, and capital structure). ROIC currently exceeds WACC. Therefore, the key points are to examine: (1) how much ROIC is resistant to collapse even in the cycle adjustment phase, and (2) if it collapses, which indicators return first (gross profit margin, inventory turnover, SG&A ratio, etc.). It is appropriate to avoid overly asserting the spread (ROIC−WACC) as a single point value and to evaluate the strength of EVA starting from changes in ROIC. Because the Company emphasizes capital efficiency in the medium to long term and sets targets such as a ROE of 20% or more in FY3/2030, the level and stability of ROIC are also inferred to be management KPIs.
When translating this into the investment conclusion, in the short term, the longer the market inventory adjustment lasts, the more profit margins tend to dull, and ROIC also tends to decline. Conversely, if the gross profit margin and operating profit margin reverse along with the inventory adjustment entering its final stage, it becomes easier to see a bottoming of ROIC, and the market is more likely to be conscious of the possibility that the ROIC−WACC spread will recover from a phase of contraction. In this phase, rather than whether sales have recovered, confirm whether profit margins have recovered as a priority.
14. Value creation capability from the perspective of free cash flow and capital allocation
FCF is strong due to improved working capital following market inventory adjustments. The focus is on whether it can achieve both funding creation and debt compression, even in phases, when working capital turns occur.
In FY3/2025, operating cash flow was 18.91 billion yen, investing cash flow was minus 2.06 billion yen, and the simple sum free cash flow was approximately 16.84 billion yen. Cash creation is due not only to profit contribution but also mainly to improvement in working capital. In the consolidated cash flow statement of the financial results, decreases in trade receivables and contract assets (9,530 million yen) and decreases in inventories (3,768 million yen) are shown as factors increasing operating cash flow, and it can be inferred that cash collection progressed in the inventory adjustment phase. On the investment side, the acquisition of tangible fixed assets was 1.55 billion yen, and intangible fixed assets were 210 million yen; the investment burden is relatively restrained.
In financing cash flow, while repaying 14.21 billion yen of short-term borrowings, the Company procured 9.66 billion yen through long-term borrowings and increased commercial paper by a net 2.00 billion yen. For shareholder returns, dividends paid totaled 3.78 billion yen, share repurchases 2.65 billion yen, and the company maintained returns within the free cash flow range. On the other hand, it also involved replacing and adjusting debt, which can be accounted for in this fiscal year.
Free cash flow in this fiscal year reflects a significant contribution from the phase-in of funds collected by compressing inventories and receivables, indicating strong cash-generation capability; however, the evaluation is that the same level does not necessarily represent earning power in normal times. Also, considering that net cash is negative 29.184 billion yen, the focus going forward shifts to how far it can proceed with lightening the borrowing structure while maintaining inventory and receivables levels. What should be examined quarterly is whether, as normalization of the inventory phase and margin recovery progress simultaneously, operating cash flow can shift from a form dependent on improvement in working capital to a form generated by the accumulation of profit.
15. Possibilities of future shareholder return measures and evaluation of past results
The axis of returns is a 40% payout ratio. Additional returns depend on earnings and the recovery and reduction of the capital burden.
Regarding shareholder returns, the Company clearly states a policy of paying dividends in line with business performance, using the consolidated payout ratio as the reference. Share repurchases will be decided after prioritizing growth investments, taking into account cash flow, stock liquidity, and future facility funding needs, among other factors, and the payout ratio is set at 40% for the time being. Therefore, the central axis of returns can be organized as dividends, with share repurchases in a supplementary position.
In terms of results, looking at the dividend trend disclosed by the Company (after adjusting for the impact of stock splits), dividends per share were 68.3 yen in FY3/2022, 118.3 yen in FY3/2023, 135.0 yen in FY3/2024, and 119 yen in FY3/2025. After a trend of dividend increases, it was restrained in the most recent period in the cycle adjustment phase. The payout ratio has generally been in the 40% range, indicating that it has operated on that basis even amid profit fluctuations.
As of now, the annual dividend forecast for FY3/2026 is 99 yen. Even in periods when profits stagnate, maintaining dividends at a certain level and expanding capacity for returns in the recovery phase are the basic lines of the design.
Regarding share repurchases, while the company regards them as a legitimate strategic option for agile use, it is clear from the current disclosures that dividends are the center. Note that while the consolidated cash flow statement for FY3/2025 states expenditures for acquisition of treasury stock of 2.65 billion yen, in the status of acquisition of treasury stock, it is disclosed that there were no acquisitions based on a Board of Directors resolution, and treasury stock acquired in the fiscal year was 39 shares (total purchase price: 0 million yen) as purchases of fractional shares, etc. The number of common shares increased by 836,839 shares, consisting of 836,800 shares acquired by the E-Ship trust and 39 shares acquired through the purchase of fractional shares as described above.
in the fiscal year was 39 shares (total purchase price: 0 million yen) as purchases of fractional shares,
The focus going forward is, in addition to maintaining the 40% payout ratio, on which phases can add concrete capacity for returns. Conditions include: first, that the market inventory adjustment in the EC Business has entered its final stage and profit margins have recovered; second, that working capital burdens normalize; and third, that capital burdens, including net interest-bearing debt, lighten. The more these progress, the more the room for expanding total returns, including share repurchases, in addition to maintaining dividends, tends to become larger.
16. Corporate value valuation (DCF and PER/PBR analysis)
The market prices ROE conservatively, but the appropriate stock price level will depend on confirming that the market inventory adjustment in the EC Business is in its final stage and that profit margins have reversed.
First, we back-calculate the current market assumptions from valuation indicators such as PER and PBR. Using a forecast PER of 15.23x, an actual PBR of 2.18x, and a market capitalization of 114.2 billion yen, the forecast net income implied by PER is approximately 7.50 billion yen (=114.2÷15.23), and the year-end equity implied by PBR is approximately 52.39 billion yen (=114.2÷2.18). The market-back-calculated ROE is approximately 14.3% (7.50/52.39), which is lower than the actual ROE of 19.11%. In other words, while the market is seeing a recovery, it does not assume that high ROE will continue as is; it is interpreted as a conservative estimate of capital profitability, considering market inventory turnover, competition, and fluctuations in customer investment.
Next, because the Company does not explicitly state a WACC, we treat the DCF as a scenario calculation based on the said premises. Note that the simple sum FCF for FY3/2025 is large at 16.847 billion yen, but this is susceptible to the impact of working capital (trade receivables, inventories, etc.) fluctuations, and it is risky to place it as a “normal value” for each year. The financial results summary also cites decreases in trade receivables and similar items as a factor increasing operating cash flow, and it should be noted that the level of FCF can fluctuate depending on the phase.
We view WACC as approximately 7%, but given valuation sensitivity, we also confirm an 8–10% range. Starting conservatively from normal FCF = 10.0 billion yen, and assuming +5% for years 1–2, +2% for years 3–5, and a perpetual growth rate of 1.5%, the enterprise value (EV) is approximately 168.8 billion yen at WACC 8%, approximately 146.2 billion yen at WACC 9%, and approximately 129.0 billion yen at WACC 10%. Equity value after subtracting net debt of 29.184 billion yen moves to approximately 139.7 billion yen at WACC 8%, approximately 117.0 billion yen at WACC 9%, and approximately 99.8 billion yen at WACC 10%. In conclusion, while there is upside in DCF, the valuation is strongly affected by capital cost assumptions, and in the short term, the accumulation of facts in the order of “EC market inventory adjustment entering its final stage → reversal of gross profit margin and operating profit margin → confirmation of bottoming of ROE/ROIC” becomes an essential premise for revising multiples (PER and PBR). Because the market prices ROE conservatively, as confirmation progresses, a re-rating room is likely to arise; however, when confirmation is delayed, an undervalued state can persist.
17. Multiple comparison analysis with peers
TED is at a mid-level valuation given its high capital efficiency, and the focus is on the likelihood of margin recovery.
Using Tokyo Electron Device (hereinafter, TED) and two comparable companies, MACNICA HOLDINGS
(hereinafter, Macnica HD) (3132) and MARUBUN (7537), we compare relative valuation levels and capital efficiency using the presented indicators of forecast PER, actual PBR, market capitalization, ROA, and ROE.
First, across multiple levels, TED’s forecast PER is 15.23x, slightly below Macnica HD’s 16.76x and above Marubun’s 11.23x. TED’s PBR is 2.18x, above Macnica HD’s 1.68x and far above MARUBUN’s 0.60x. In other words, while TED is valued at multiples between Macnica HD and MARUBUN, PBR is higher than Macnica HD, and the gap to MARUBUN is also significant.
Next, looking at capital efficiency, TED’s ROE is 19.11%, the highest among the three companies. Macnica HD is 10.2%, and MARUBUN is 8.1%. TED’s ROA is also 5.53%, above Macnica HD’s 4.5% and MARUBUN’s 3.0%. Although TED is relatively strong in capital efficiency, its forecast PER is not notably high, and the market likely conservatively evaluates long-term growth rates and the sustainability of profit margins given earnings volatility.
In conclusion, the difference in TED’s peer comparison lies not in capital efficiency being high in itself, but in whether that level is maintained after the cycle-adjustment phase and how far margin recovery can be quantified. In phases when market inventory adjustment reaches its final stage, and a reversal of the gross profit margin and operating profit margin is confirmed, a high ROE tends to serve as a basis for re-rating, and the stock price is more likely to be raised.
Finally, in terms of market capitalization, TED is 114.2 billion yen, smaller than Macnica HD’s 452.6 billion yen and larger than MARUBUN’s 34.8 billion yen. While fund inflows are likely to come in phases as business performance improves, given the scale of market capitalization, there may also be periods when the stock price fluctuates due to supply-and-demand shifts.
| Company name | PER (forecast)(X) | PBR (actual)(X) | Market capitalization (billion yen) |
ROA (%) | ROE (%) |
| TOKYO ELECTRON DEVICE | 15.23 | 2.18 | 114.2 | 5.53 | 19.11 |
| MACNICA HOLDINGS | 16.76 | 1.68 | 452.6 | 4.5 | 10.2 |
| MARUBUN | 11.23 | 0.60 | 34.8 | 3.0 | 8.1 |
Key stock price data
Key financial data
| Unit: million yen | 2021 | 2022 | 2023 | 2024 | 2025 | 2026CE |
| Sales | 143,268 | 179,907 | 240,350 | 242,888 | 216,379 | 200,000 |
| EBIT (Operating Income) | 4,621 | 8,133 | 14,228 | 15,429 | 12,459 | |
| Pretax Income | 4,589 | 7,910 | 12,469 | 13,887 | 11,408 | |
| Net Profit Attributable to Owner of Parent | 3,143 | 5,085 | 8,778 | 9,986 | 8,874 | 7,200 |
| Cash & Short-Term Investments | 5,680 | 5,134 | 6,538 | 6,867 | 8,384 | |
| Total assets | 91,453 | 108,045 | 143,751 | 163,349 | 157,600 | |
| Total Debt | 25,396 | 29,479 | 45,652 | 52,101 | 42,633 | |
| Net Debt | 19,716 | 24,345 | 39,114 | 45,234 | 34,249 | |
| Total liabilities | 61,799 | 76,025 | 104,753 | 117,158 | 108,595 | |
| Total Shareholders’ Equity | 28,965 | 30,953 | 37,849 | 45,042 | 47,861 | |
| Net Operating Cash Flow | -3,463 | -891 | -12,185 | 301 | 18,915 | |
| Capital Expenditure | 427 | 380 | 270 | 903 | 1,762 | |
| Net Investing Cash Flow | -469 | -155 | -199 | -2,695 | -2,068 | |
| Net Financing Cash Flow | 5,079 | 606 | 13,746 | 2,529 | -15,251 | |
| Free Cash Flow | -3,811 | -1,240 | -12,361 | -3 | 17,363 | |
| ROA (%) | 3.73 | 5.10 | 6.97 | 6.50 | 5.53 | |
| ROE (%) | 11.34 | 16.97 | 25.52 | 24.10 | 19.11 | |
| EPS (Yen) | 104.1 | 170.2 | 294.8 | 333.4 | 295.7 | 244.8 |
| BPS (Yen) | 957.1 | 1,042.4 | 1,268.2 | 1,501.1 | 1,624.1 | |
| Dividend per Share (Yen) | 41.67 | 68.33 | 118.33 | 135.00 | 119.00 | 99.00 |
| Shares Outstanding (Million shares) | 31.34 | 31.34 | 31.34 | 31.34 | 31.34 |
Source: Calculated by Omega Investment based on FactSet’s standard criteria, rounded to the nearest whole number. The number of shares outstanding reflects post-split adjusted figures.
Share price
Financial data (quarterly basis)
| Unit: million yen | 2024/3 | 2025/3 | 2026/3 | ||||||
| 3Q | 4Q | 1Q | 2Q | 3Q | 4Q | 1Q | 2Q | 3Q | |
| (Income Statement) | |||||||||
| Sales | 60,050 | 63,140 | 56,607 | 55,105 | 50,384 | 54,283 | 45,136 | 51,108 | 50,472 |
| Year-on-year | -6.4% | -2.0% | -4.1% | -9.2% | -16.1% | -14.0% | -20.3% | -7.3% | 0.2% |
| Cost of Goods Sold (COGS) | 51,050 | 52,984 | 47,411 | 47,877 | 42,132 | 45,226 | 38,681 | 43,717 | 42,392 |
| Gross Income | 9,000 | 10,156 | 9,196 | 7,228 | 8,252 | 9,057 | 6,455 | 7,391 | 8,080 |
| Gross Income Margin | 15.0% | 16.1% | 16.2% | 13.1% | 16.4% | 16.7% | 14.3% | 14.5% | 16.0% |
| SG&A Expense | 5,293 | 5,588 | 4,942 | 5,189 | 5,686 | 5,457 | 4,999 | 5,284 | 5,336 |
| EBIT (Operating Income) | 3,707 | 4,568 | 4,254 | 2,039 | 2,566 | 3,600 | 1,456 | 2,107 | 2,744 |
| Year-on-year | -3.3% | 19.6% | 17.2% | -42.2% | -30.8% | -21.2% | -65.8% | 3.3% | 6.9% |
| Operating Income Margin | 6.2% | 7.2% | 7.5% | 3.7% | 5.1% | 6.6% | 3.2% | 4.1% | 5.4% |
| EBITDA | 3,937 | 4,826 | 4,495 | 2,271 | 2,845 | 3,909 | 1,720 | 2,374 | 3,017 |
| Pretax Income | 3,431 | 4,200 | 3,614 | 2,532 | 1,786 | 3,476 | 1,715 | 1,950 | 3,427 |
| Consolidated Net Income | 2,544 | 2,936 | 2,506 | 1,812 | 1,279 | 3,307 | 1,240 | 1,368 | 2,451 |
| Minority Interest | 24 | 20 | 12 | 1 | 10 | 6 | 22 | 6 | 0 |
| Net Income ATOP | 2,519 | 2,916 | 2,494 | 1,811 | 1,269 | 3,300 | 1,217 | 1,363 | 2,450 |
| Year-on-year | 8.7% | 1.4% | 14.1% | -23.4% | -49.6% | 13.2% | -51.2% | -24.7% | 93.1% |
| Net Income Margin | 4.2% | 4.6% | 4.4% | 3.3% | 2.5% | 6.1% | 2.7% | 2.7% | 4.9% |
| (Balance Sheet) | |||||||||
| Cash & Short-Term Investments | 10,354 | 6,867 | 7,061 | 9,653 | 9,743 | 8,384 | 7,013 | 8,695 | 5,641 |
| Total assets | 155,739 | 163,349 | 161,802 | 164,278 | 163,485 | 157,600 | 144,121 | 154,925 | 158,331 |
| Total Debt | 55,942 | 52,101 | 48,719 | 52,161 | 50,244 | 42,633 | 32,498 | 38,305 | 34,825 |
| Net Debt | 45,588 | 45,234 | 41,658 | 42,508 | 40,501 | 34,249 | 25,485 | 29,610 | 29,184 |
| Total liabilities | 112,784 | 117,158 | 114,997 | 116,407 | 115,601 | 108,595 | 96,023 | 106,517 | 108,240 |
| Total Shareholders’ Equity | 41,826 | 45,042 | 45,678 | 46,743 | 46,747 | 47,861 | 46,939 | 47,244 | 49,177 |
| (Profitability %) | |||||||||
| ROA | 6.61 | 6.50 | 6.79 | 6.27 | 5.32 | 5.53 | 4.97 | 4.48 | 5.18 |
| ROE | 25.89 | 24.10 | 24.49 | 22.13 | 19.17 | 19.11 | 16.41 | 15.21 | 17.37 |
| (Per-share) Unit: JPY | |||||||||
| EPS | 84.1 | 97.2 | 83.1 | 60.1 | 42.1 | 110.4 | 41.2 | 46.0 | 83.3 |
| BPS | 1,395.0 | 1,501.1 | 1,520.4 | 1,552.5 | 1,550.5 | 1,624.1 | 1,583.3 | 1,608.2 | 1,671.8 |
| Dividend per Share | 0.00 | 74.00 | 0.00 | 52.00 | 0.00 | 67.00 | 0.00 | 35.00 | 0.00 |
| Shares Outstanding (million shares) | 31.34 | 31.34 | 31.34 | 31.34 | 31.34 | 31.34 | 31.34 | 31.34 | 31.34 |
Source: Calculated by Omega Investment based on FactSet’s standard criteria, rounded to the nearest whole number. The number of shares outstanding reflects post-split adjusted figures.
Financial data (full-year basis)
| Unit: million yen | 2016 | 2017 | 2018 | 2019 | 2020 | 2021 | 2022 | 2023 | 2024 | 2025 |
| (Income Statement) | ||||||||||
| Sales | 117,831 | 131,855 | 159,841 | 141,000 | 135,394 | 143,268 | 179,907 | 240,350 | 242,888 | 216,379 |
| Year-on-year | 5.5% | 11.9% | 21.2% | -11.8% | -4.0% | 5.8% | 25.6% | 33.6% | 1.1% | -10.9% |
| Cost of Goods Sold | 102,852 | 116,709 | 142,160 | 121,295 | 115,491 | 122,666 | 154,268 | 206,106 | 205,720 | 182,646 |
| Gross Income | 14,979 | 15,146 | 17,681 | 19,705 | 19,903 | 20,602 | 25,639 | 34,244 | 37,168 | 33,733 |
| Gross Income Margin | 12.7% | 11.5% | 11.1% | 14.0% | 14.7% | 14.4% | 14.3% | 14.2% | 15.3% | 15.6% |
| SG&A Expense | 13,489 | 13,481 | 14,924 | 16,179 | 16,091 | 15,981 | 17,506 | 20,016 | 21,739 | 21,274 |
| EBIT (Operating Income) | 1,490 | 1,665 | 2,757 | 3,526 | 3,812 | 4,621 | 8,133 | 14,228 | 15,429 | 12,459 |
| Year-on-year | -42.6% | 11.7% | 65.6% | 27.9% | 8.1% | 21.2% | 76.0% | 74.9% | 8.4% | -19.2% |
| Operating Income Margin | 1.3% | 1.3% | 1.7% | 2.5% | 2.8% | 3.2% | 4.5% | 5.9% | 6.4% | 5.8% |
| EBITDA | 2,083 | 2,254 | 3,317 | 4,035 | 4,451 | 5,234 | 8,864 | 14,787 | 16,192 | 13,520 |
| Pretax Income | 1,613 | 1,435 | 2,485 | 3,257 | 3,227 | 4,589 | 7,910 | 12,469 | 13,887 | 11,408 |
| Consolidated Net Income | 925 | 972 | 1,655 | 2,403 | 2,370 | 3,217 | 5,489 | 8,879 | 10,081 | 8,904 |
| Minority Interest | 0 | 0 | 56 | 61 | 81 | 74 | 404 | 100 | 94 | 29 |
| Net Income ATOP | 925 | 972 | 1,598 | 2,341 | 2,288 | 3,143 | 5,085 | 8,778 | 9,986 | 8,874 |
| Year-on-year | 29.0% | 5.1% | 64.4% | 46.5% | -2.3% | 37.4% | 61.8% | 72.6% | 13.8% | -11.1% |
| Net Income Margin | 0.8% | 0.7% | 1.0% | 1.7% | 1.7% | 2.2% | 2.8% | 3.7% | 4.1% | 4.1% |
| (Balance Sheet) | ||||||||||
| Cash & Short-Term Investments | 2,637 | 2,433 | 3,606 | 3,794 | 4,492 | 5,680 | 5,134 | 6,538 | 6,867 | 8,384 |
| Total assets | 64,284 | 73,708 | 86,708 | 78,927 | 77,013 | 91,453 | 108,045 | 143,751 | 163,349 | 157,600 |
| Total Debt | 19,064 | 24,243 | 34,266 | 25,443 | 19,400 | 25,396 | 29,479 | 45,652 | 52,101 | 42,633 |
| Net Debt | 16,427 | 21,810 | 30,660 | 21,649 | 14,908 | 19,716 | 24,345 | 39,114 | 45,234 | 34,249 |
| Total liabilities | 42,110 | 50,780 | 62,306 | 52,516 | 49,870 | 61,799 | 76,025 | 104,753 | 117,158 | 108,595 |
| Total Shareholders’ Equity | 22,172 | 22,926 | 23,838 | 25,806 | 26,476 | 28,965 | 30,953 | 37,849 | 45,042 | 47,861 |
| (Cash Flow) | ||||||||||
| Net Operating Cash Flow | 3,543 | -4,685 | -7,993 | 12,335 | 8,651 | -3,463 | -891 | -12,185 | 301 | 18,915 |
| Capital Expenditure | 215 | 166 | 256 | 262 | 544 | 427 | 380 | 270 | 903 | 1,762 |
| Net Investing Cash Flow | -347 | -262 | -896 | -1,708 | -549 | -469 | -155 | -199 | -2,695 | -2,068 |
| Net Financing Cash Flow | -2,841 | 4,739 | 9,869 | -10,504 | -7,479 | 5,079 | 606 | 13,746 | 2,529 | -15,251 |
| Free Cash Flow | 3,407 | -4,818 | -8,133 | 12,111 | 8,163 | -3,811 | -1,240 | -12,361 | -3 | 17,363 |
| (Profitability ) | ||||||||||
| ROA (%) | 1.38 | 1.41 | 1.99 | 2.83 | 2.94 | 3.73 | 5.10 | 6.97 | 6.50 | 5.53 |
| ROE (%) | 4.12 | 4.31 | 6.84 | 9.44 | 8.76 | 11.34 | 16.97 | 25.52 | 24.10 | 19.11 |
| Net Margin (%) | 0.79 | 0.74 | 1.00 | 1.66 | 1.69 | 2.19 | 2.83 | 3.65 | 4.11 | 4.10 |
| Asset Turn | 1.76 | 1.91 | 1.99 | 1.70 | 1.74 | 1.70 | 1.80 | 1.91 | 1.58 | 1.35 |
| Assets/Equity | 2.98 | 3.06 | 3.43 | 3.34 | 2.98 | 3.04 | 3.33 | 3.66 | 3.70 | 3.45 |
| (Per-share) Unit: JPY | ||||||||||
| EPS | 30.8 | 32.2 | 52.7 | 76.9 | 74.8 | 104.1 | 170.2 | 294.8 | 333.4 | 295.7 |
| BPS | 737.5 | 758.6 | 785.0 | 845.4 | 880.4 | 957.1 | 1,042.4 | 1,268.2 | 1,501.1 | 1,624.1 |
| Dividend per Share | 20.00 | 20.00 | 22.00 | 31.00 | 30.00 | 41.67 | 68.33 | 118.33 | 135.00 | 119.00 |
| Shares Outstanding (million shares) | 31.34 | 31.34 | 31.34 | 31.34 | 31.34 | 31.34 | 31.34 | 31.34 | 31.34 | 31.34 |
Source: Calculated by Omega Investment based on FactSet’s standard criteria, rounded to the nearest whole number. The number of shares outstanding reflects post-split adjusted figures.