2026-06-19
Home
Japanese

Omega Investment Co., Ltd.
KYODO PUBLIC RELATIONS (Investment report – 4Q update)
| Share price (3/11) | ¥1,016 | Dividend Yield (26/12 CE) | 1.6 % |
| 52weeks high/low | ¥627/1,103 | ROE(25/12) | 22.7 % |
| Avg Vol (3 month) | 9.4 thou shrs | Operating margin (25/12) | 15.2 % |
| Market Cap | ¥8.95 bn | Beta (5Y Monthly) | 0.72 |
| Enterprise Value | ¥5.92 bn | Shares Outstanding | 8.814 mn shrs |
| PER (26/12 CE) | 9.9 X | Listed market | TSE Standard |
| PBR (25/12 act) | 2.1 X |
| Click here for the PDF version of this page |
| PDF version |
The business is highly profitable, and the downside risk in the stock price is relatively small.If quantitative disclosure of MRR and retention rates improves and the certainty of growth is confirmed, additional purchases should be considered.
◇ Investment conclusion: Maintain neutral view. The earnings are strong, but the factors that would allow the market to price in growth are not yet fully in place.
We maintain a neutral view on the stock of KYODO PUBLIC RELATIONS (the “Company”). Given that the market capitalization is small and it is difficult for sizable trades to be executed all at once, we will first include the stock in the portfolio at a limited weighting. Once we can confirm that quantitative disclosure of KPIs, including MRR and retention rate, which determine the certainty of growth, is progressing or that performance strength continues, it is realistic to increase holdings while minimizing the impact on the stock price.
Last time, we presented ① continued growth across the three pillars of PR, influencer, and AI, ② rising unit prices and the accumulation of recurring revenue, and ③ progress in visualizing qualitative KPIs as conditions for re-rating. As of the fourth quarter of FY12/2026, we were generally able to confirm continued growth in the three pillars. However, visualization of KPIs remains limited, and the stock price has not yet entered a full-scale re-rating phase. While it is not a phase to clearly raise the weighting within the portfolio at this time, given that continued growth can be confirmed, there is room to consider an initial inclusion to avoid opportunity loss from not holding the stock.
There are three reasons. First, the business framework for realizing growth is being maintained. The structure in which influencers, AI, and SaaS are added on top of the stable PR base remains unchanged, and the direction of growth remains as assumed. Capital efficiency is also high, with ROE 21.8% and ROIC 20.6%, and profitability is strongly supported, including ROA 13.8%. Second, a few factors would push up the stock valuation. While the expansion of SaaS and AI is visible, quantitative disclosure of KPIs that determine the certainty of growth, such as recurring fees (MRR), average revenue per customer (ARPU), and retention rate, is limited, and the market has not fully priced in growth. A forecast PER of 10.2x may appear undervalued, but for the valuation to be raised on the premise of structural regrowth, additional quantitative information is necessary. Third, the downside risk in the stock price is relatively small. The stock has a low beta (0.72), and net cash of 3.22 billion yen is equivalent to approximately 35% of the market capitalization of 9.2 billion yen. Financial leeway is substantial, and resilience is relatively high even in phases when the overall equity market sharply declines.
The Company’s source of strength lies in its customer base supported by long-term retainer contracts and the deepening of specialized domains, as well as initiatives to standardize operations through technology implementation. The focus at this time is whether the Company can quantitatively demonstrate the extent to which SaaS is contributing to profits. If the profit contribution from SaaS rises to a visibly meaningful level and indicators such as MRR and the number of contracting companies are quantitatively disclosed, the market will be better able to assess the certainty of growth, creating room for the valuation to be raised from the current PER level.
In the investment scenario organized last time, continued growth can be confirmed, but the decisive factor that would justify a valuation uplift has not yet been achieved. In the current phase, while maintaining neutrality, if we can confirm the accumulation of SaaS revenues and progress in quantitative KPI disclosure, we will start with limited weighting and then add thickness to holdings in stages. In addition, if stable double-digit growth in operating profit continues, the room to raise the weighting will expand further.
◇ FY12/2025 results highlights: Record highs in all segments; results further strengthen the quality of growth
The Company’s full-year results for FY12/2025 (announced on February 12, 2026) set new record highs for net sales and each profit item, and also exceeded the Company’s plan, landing above expectations. Consolidated net sales were 8.554 billion yen (YoY +16.8%), operating profit was 1.302 billion yen (YoY +21.2%), ordinary profit was 1.307 billion yen (YoY +20.9%), and net income attributable to owners of the parent was 863 million yen (YoY +64.1%).
The results also exceeded the full-year performance forecasts. Net sales landed above expectations at 8.554 billion yen versus the forecast of 8.500 billion yen, and operating profit landed above expectations at 1.302 billion yen versus the forecast of 1.280 billion yen. In addition, the Company states that it achieved record-high performance in all segments.
The background to the upside can be organized as overlapping growth across the three pillars. In the PR business, against the backdrop of an increase in inquiries for PR projects, the Company explains that the number of retainer contracting companies increased by approximately 7% and spot projects increased by approximately 20%; in addition, there was the impact of consolidating Total Communications from August 2025, resulting in segment net sales of 6.184 billion yen (YoY +13.6%) and segment profit of 1.140 billion yen (YoY +20.3%). In the influencer marketing business, tie-up projects for cosmetics and apparel by affiliated creators increased by approximately 27% YoY. Projects related to the Company’s own media increased by approximately 15% YoY, resulting in segment net sales of 1.294 billion yen (YoY +31.2%) and segment profit of 111 million yen (YoY +33.9%). In the AI & Big Data solutions business, ShtockData-related operating fees increased by approximately 29% YoY, and data infrastructure construction and BI implementation support increased by approximately 18% YoY, resulting in segment net sales of 1.075 billion yen (YoY +20.75%) and segment profit of 192 million yen (YoY +11.8%).
Regarding the decrease in non-consolidated ordinary profit, the Company explains that the main factor was a dividend of 150 million yen from a consolidated subsidiary in 2024; since it is eliminated on a consolidated basis, it is reflected as substantive growth in both sales and profits. Achieving net sales of 8.5 billion yen and operating profit of 1.3 billion yen succinctly indicates the strength of the earnings base. On the other hand, because the impact of IPO preparation costs remains in AI/data, the focus in the next fiscal year will be on how profit growth compares with net sales growth. While the three pillars continue to grow, we would like to confirm whether each set of results shows continued improvement in profit margins.
◇ Segment analysis: PR is the earnings base, accounting for more than 70%, with growth in influencer and AI/data adding on
The Company has three pillars: while positioning the PR business as the core earnings base, the influencer marketing business and the AI & Big Data solutions business add on growth. Segment net sales in FY12/2025 were 6.184 billion yen for the PR business, 1.294 billion yen for the influencer marketing business, and 1.075 billion yen for the AI & Big Data solutions business, with PR accounting for a little over 70% of net sales.
An overview of each segment and recent topics is as follows.
・PR business: Against the backdrop of increased inquiries for PR projects, the number of retainer contracting companies increased by approximately 7%, while spot projects increased by approximately 20%. In addition to promoting operational sophistication through a full AI shift and the impact of consolidating Total Communications from August 2025, net sales were up 13.6% YoY, and profit was up 20.3% YoY. In addition, the Osaka branch is said to have provided public relations support for the Osaka-Kansai Expo, leading to increased inquiries and orders.
・Influencer marketing business: Tie-up projects for cosmetics and apparel by creators affiliated with the Company increased by approximately 27% YoY, and related projects for the Company’s own media, including “Merupuchi” and “CulDRAMA,” increased by approximately 15% YoY, resulting in net sales of +31.2% YoY and profit of +33.9% YoY. In addition, “Merupuchi” was appointed as a cheering supporter for the “20th Asian Games” and the “5th Asian Para Games” to be held in Nagoya, and the number of YouTube subscribers for “Osaki,” an influencer cultivated by VAZ, exceeded 1 million.
・AI & Big data solutions business: ShtockData-related operating fees for the Company’s own services increased by approximately 29% YoY, and data infrastructure construction and BI tool implementation support increased by approximately 18% YoY, resulting in net sales growth of +20.7%. While profit has increased, costs associated with IPO preparation are covered by higher net sales, resulting in +11.8%. As a topic, the Company began full-scale “AI utilization support services” in May 2025, providing end-to-end support from design through operational support for generative AI. In addition, the group company “KeyWalker” was selected for “Best Venture 100 2026,” which can be seen as a result of high evaluations of the Company’s data and AI products and services.
◇ Performance forecasts: Toward 10.0 billion yen in net sales and 1.6 billion yen in operating profit; improving AI productivity is key
The Company sets its FY12/2026 forecasts as net sales of 10.0 billion yen, operating profit of 1.6 billion yen (operating profit margin of 16%), and net income attributable to owners of the parent of 900 million yen. Compared with the results for the previous fiscal year (net sales of 8.554 billion yen and operating profit of 1.302 billion yen), the plan assumes an increase of approximately 1.4 billion yen in net sales and approximately 300 million yen in operating profit, and the content continues the growth track.
In the medium-term management plan, the Company sets targets of achieving net sales of 10.0 billion yen and operating profit of 1.6 billion yen in FY12/2026. In FY12/2025, against a plan of 8.8 billion yen in net sales, results were 8.554 billion yen, and against a plan of 1.3 billion yen in operating profit, results were 1.302 billion yen; progress exceeded the plan on the profit side. The operating profit margin also improved from 14.7% to 15.2%, and profitability is progressing in line with the medium-term plan.
There are three growth drivers. First is the deepening of the PR business. In addition to strengthening the linkage between retainer and spot projects, the policy is to expand commercial flow through acquiring large projects in the Kansai area. Second is strengthening IP development in the influencer business, aiming to diversify revenue sources through Asian influencer expansion and D2C-type cosmetics businesses. Third is improving productivity through AI utilization. The Company has set forth its “full AI shift declaration” and is advancing the establishment of the AI Innovation Core Center (AIC) and improvements in AI utilization. In addition, the Company aims for a 130% growth rate per head through AI utilization, positioning it as a measure to improve profit margins.
On the other hand, risks also exist. It is highly likely that upfront costs, such as AI-related investments and IPO preparation, will continue. In addition, achieving 10.0 billion yen in net sales presupposes not only stable growth in PR but also sustained high growth in the influencer and AI domains. In particular, the AI/data domain is still at a net sales scale of around 1 billion yen, and if the growth rate slows, the impact on the overall plan will not be small.
The current plan is not excessively optimistic, but achieving it requires quantitative results from productivity improvements enabled by AI. If the Company achieves an operating profit margin of 16%, it may enter a higher valuation stage as a highly profitable communication company.
The key to achieving the plan lies not in expanding net sales but in improving profit margins. We would like to confirm each quarter whether AI investment is recorded as an increase in expenses or as a productivity improvement.
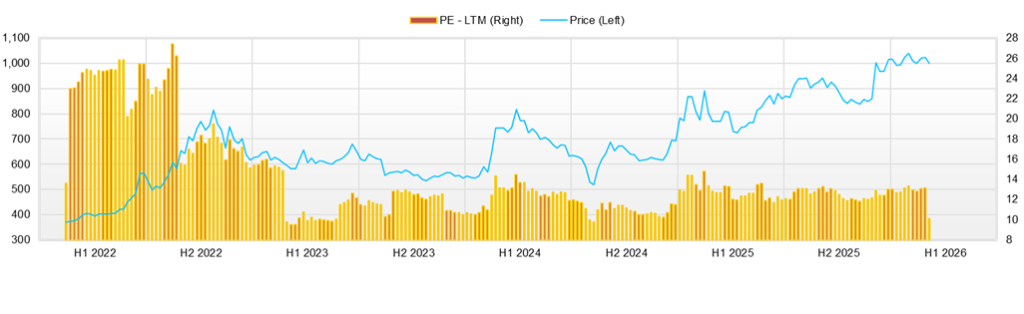
◇ Stock price trends and points to watch going forward: Recovering trend from the November low of 838 yen; volume increased on results, but additional factors are needed to test the upside
Over the last three months (early November 2025 to February 16, 2026), the stock price has been moving higher from its November low. From the bottom of 838 yen on November 7, it recovered to 1,050 yen on February 16, an increase of approximately 25%. Along the way, it tested the upside to a high of 1,103 yen on January 13, but thereafter it traded in a range around 1,000 yen, and after the results, it appears to have settled back in the 1,000 yen range.
Valuation is currently a forecast PER of 10.2x and an actual PBR of 2.1x. While the PER does not show a strong sense of overheating relative to the high ROE of 21.8% and ROIC of 20.6% in terms of profitability, the PBR is in the 2x range, and there is room for the valuation to be raised as visibility of growth strengthens. Conversely, while quantitative factors for growth are weak, the market valuation is likely to remain, as the upside is limited despite high profitability.
Stock price reactions to announcements tend to be characterized not so much by sharp surges as by increases in trading volume and wider price ranges. In the results announcement on February 12, the closing price was 977 yen, but on the following day, February 13, it moved widely with a high of 1,097 yen and a low of 984 yen, and trading volume increased to 50,000 shares. While short-term funds tend to enter and the price range widens, on a closing-price basis, it remained at about +4.5% from February 12 to 13, indicating a move that digests the factor over several days.
Looking across recent news, the Company continues to emphasize “AI and public relations operations” and “building AI organizations.” The Company announced on November 18 that it implemented an AI agent function in the public relations/PR automation tool “SAKAE,” but the stock price moved only slightly, from the closing price of 858 yen on November 17 to the closing price of 859 yen on November 18, and the reaction was limited. On the other hand, trading volume increased from 3,700 shares to 11,900 shares. The start of providing the “AI Talent Concierge” on November 25 also saw the closing price range from 850 yen to 848 yen, indicating that, while it has a thematic nature, it is unlikely to lead to an immediate valuation uplift. However, the establishment of a generative AI talent development program on December 16 saw a small increase from the closing price that day of 958 yen to 964 yen the next day, while trading volume the next day increased to 20,000 shares, indicating rising interest. The establishment of the AIC Center on January 19 and the X linkage for “SAKAE” on January 30 are intended to support the accumulation of factors while maintaining the level around 1,000 yen, rather than causing a sudden surge in the stock price.
Technically, the upside is the high of 1,103 yen on January 13, which is an easy-to-identify resistance zone. To break above it, beyond results, factors are needed that show the next growth in numbers. The downside is the low of 984 yen on the day after the results, which is the near-term support line, and below 1,000 yen is a price range where buy-on-dips and selling pressure tend to collide.
Going forward, the condition for adding purchases comes down to whether the structure in which AI and SaaS push up profits can be confirmed in numbers. Specifically, the focus is on whether the accumulation of recurring fees and the effects of product adoption on project unit prices, person-hours, and profit margins are quantified. As investment timing, ① establishment/expansion of KPI disclosure, ② upward revision, ③ additional disclosure of product adoption cases, and ④ execution of capital policy tend to trigger an increase in the trading range. The stock price is in a recovering trend, but to break above requires numbers for AI and SaaS. If KPI disclosure progresses, breaking above 1,103 yen comes into view; if it stagnates, trading around 1,000 yen is likely to continue.
Company profile
◇ A long-established independent PR firm enters a transformation phase aimed at standardizing public relations through SaaS and AI
KYODO PUBLIC RELATIONS is a comprehensive communication company that, while securing stable earnings through PR support centered on long-term contracts, expands the influencer and AI and SaaS domains, advancing the sophistication of the value it provides and multilayering of revenue sources. The Company was established on November 14, 1964, and has 377 consolidated employees (as of December 2025). Its business consists of three pillars: the PR business, the influencer marketing business, and the AI & Big Data solutions business, and, while based on human services, it is steering toward greater reproducibility in data and products. Specifically, the Company established KYODO PUBLIC RELATIONS Ring Co., Ltd. on January 5, 2026, as a subsidiary responsible for operating the SaaS business “Kyodo PR Connect,” and put in place a structure to accelerate the commercialization of PR and technology. In addition, most recently, the in-house public relations operations tool “SAKAE” began linking to the enterprise version API of X (formerly Twitter), enabling public relations effectiveness analysis that integrates publicity exposure and SNS monitoring. This is notable as a move that translates the Company’s stated goal of “sophistication and efficiency improvement of PR operations” into concrete functions. While maintaining the strengths of conventional PR, the Company has a structure designed to expand its product-driven recurring-fee model.
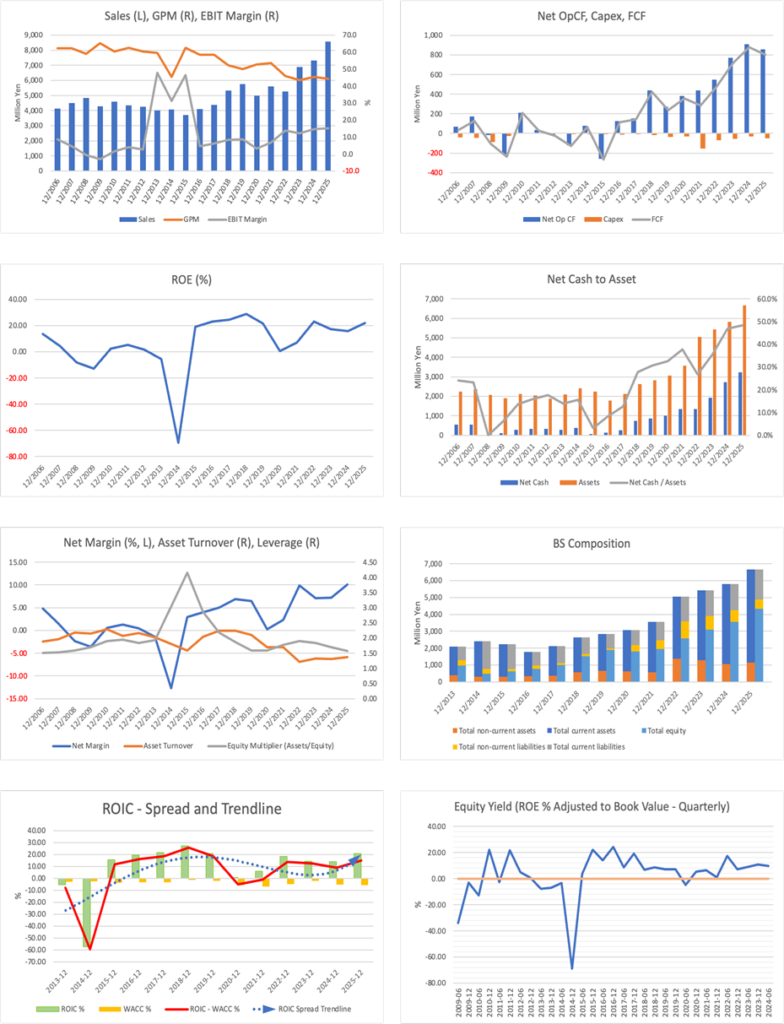
Key financial data
| Unit: million yen | 2021 | 2022 | 2023 | 2024 | 2025 | 2026 CE |
| Sales | 5,610 | 5,265 | 6,896 | 7,324 | 8,555 | 10,000 |
| EBIT (Operating Income) | 381 | 720 | 841 | 1,075 | 1,303 | 1,600 |
| Pretax Income | 288 | 768 | 862 | 1,034 | 1,305 | |
| Net Profit Attributable to Owner of Parent | 132 | 520 | 488 | 526 | 863 | 900 |
| Cash & Short-Term Investments | 1,943 | 2,318 | 2,691 | 3,260 | 3,578 | |
| Total assets | 3,572 | 5,044 | 5,428 | 5,810 | 6,656 | |
| Total Debt | 591 | 967 | 767 | 539 | 357 | |
| Net Debt | -1,352 | -1,351 | -1,925 | -2,721 | -3,221 | |
| Total liabilities | 1,630 | 2,267 | 2,097 | 1,921 | 1,957 | |
| Total Shareholders’ Equity | 1,942 | 2,595 | 3,090 | 3,553 | 4,336 | |
| Net Operating Cash Flow | 442 | 546 | 771 | 911 | 855 | |
| Capital Expenditure | 155 | 67 | 54 | 33 | 51 | |
| Net Investing Cash Flow | -26 | -397 | -35 | -37 | -109 | |
| Net Financing Cash Flow | 16 | 220 | -375 | -311 | -428 | |
| Free Cash Flow | 286 | 479 | 717 | 878 | 804 | |
| ROA (%) | 3.97 | 12.08 | 9.31 | 9.36 | 13.85 | |
| ROE (%) | 7.03 | 22.94 | 17.15 | 15.84 | 21.88 | |
| EPS (Yen) | 16.3 | 61.2 | 56.6 | 60.6 | 99.0 | 103.2 |
| BPS (Yen) | 236.1 | 299.5 | 356.7 | 408.2 | 496.4 | |
| Dividend per Share (Yen) | 7.00 | 8.00 | 10.00 | 12.00 | 14.00 | 16.00 |
| Shares Outstanding (Million shares) | 8.64 | 8.74 | 8.78 | 8.79 | 8.81 |
Source: Omega Investment from company data, rounded to the nearest whole number.
Share price
Key stock price data
Financial data (quarterly basis)
| Unit: million yen | 2023/12 | 2024/12 | 2025/12 | ||||||
| 4Q | 1Q | 2Q | 3Q | 4Q | 1Q | 2Q | 3Q | 4Q | |
| (Income Statement) | |||||||||
| Sales | 1,943 | 1,788 | 1,779 | 1,716 | 2,041 | 2,037 | 1,922 | 2,052 | 2,544 |
| Year-on-year | 16.8% | 8.4% | 10.2% | 1.6% | 5.0% | 13.9% | 8.0% | 19.6% | 24.7% |
| Cost of Goods Sold (COGS) | 1,128 | 972 | 966 | 925 | 1,147 | 1,108 | 1,077 | 1,107 | 1,470 |
| Gross Income | 815 | 816 | 814 | 791 | 894 | 929 | 845 | 945 | 1,074 |
| Gross Income Margin | 42.0% | 45.6% | 45.7% | 46.1% | 43.8% | 45.6% | 44.0% | 46.1% | 42.2% |
| SG&A Expense | 616 | 519 | 545 | 530 | 646 | 560 | 581 | 620 | 730 |
| EBIT (Operating Income) | 200 | 297 | 269 | 261 | 248 | 369 | 264 | 325 | 345 |
| Year-on-year | 45.6% | 11.2% | 49.2% | 34.4% | 24.4% | 24.1% | -1.7% | 24.8% | 38.8% |
| Operating Income Margin | 10.3% | 16.6% | 15.1% | 15.2% | 12.2% | 18.1% | 13.7% | 15.9% | 13.6% |
| EBITDA | 254 | 349 | 319 | 312 | 298 | 414 | 311 | 375 | 395 |
| Pretax Income | 206 | 277 | 271 | 230 | 256 | 366 | 260 | 328 | 351 |
| Consolidated Net Income | 152 | 147 | 177 | 147 | 150 | 244 | 167 | 218 | 349 |
| Minority Interest | 15 | 31 | 28 | 26 | 10 | 28 | 27 | 34 | 25 |
| Net Income ATOP | 137 | 116 | 148 | 121 | 141 | 215 | 140 | 184 | 324 |
| Year-on-year | 39.3% | -19.5% | 49.1% | 13.6% | 2.5% | 85.1% | -5.6% | 51.9% | 130.4% |
| Net Income Margin | 7.1% | 6.5% | 8.3% | 7.0% | 6.9% | 10.6% | 7.3% | 9.0% | 12.7% |
| (Balance Sheet) | |||||||||
| Cash & Short-Term Investments | 2,691 | 2,657 | 2,980 | 2,946 | 3,260 | 3,115 | 3,422 | 3,305 | 3,578 |
| Total assets | 5,428 | 5,286 | 5,448 | 5,342 | 5,810 | 5,598 | 5,871 | 5,876 | 6,656 |
| Total Debt | 767 | 707 | 647 | 586 | 539 | 490 | 445 | 400 | 357 |
| Net Debt | -1,925 | -1,950 | -2,333 | -2,360 | -2,721 | -2,625 | -2,977 | -2,906 | -3,221 |
| Total liabilities | 2,097 | 1,885 | 1,855 | 1,615 | 1,921 | 1,704 | 1,782 | 1,558 | 1,957 |
| Total Shareholders’ Equity | 3,090 | 3,129 | 3,293 | 3,401 | 3,553 | 3,617 | 3,786 | 3,979 | 4,336 |
| (Profitability %) | |||||||||
| ROA | 9.31 | 9.12 | 9.79 | 10.20 | 9.36 | 11.49 | 10.90 | 12.12 | 13.85 |
| ROE | 17.15 | 15.92 | 16.72 | 16.57 | 15.84 | 18.54 | 17.43 | 18.42 | 21.88 |
| (Per-share) Unit: JPY | |||||||||
| EPS | 15.9 | 13.4 | 17.1 | 13.9 | 16.2 | 24.7 | 16.0 | 21.0 | 37.2 |
| BPS | 356.7 | 361.1 | 379.0 | 391.4 | 408.2 | 415.5 | 433.6 | 455.8 | 496.4 |
| Dividend per Share | 10.00 | 0.00 | 0.00 | 0.00 | 12.00 | 0.00 | 0.00 | 0.00 | 14.00 |
| Shares Outstanding (million shares) | 8.78 | 8.79 | 8.79 | 8.79 | 8.79 | 8.81 | 8.81 | 8.81 | 8.81 |
Source: Omega Investment from company materials
Financial data (full-year basis)
| Unit: million yen | 2016 | 2017 | 2018 | 2019 | 2020 | 2021 | 2022 | 2023 | 2024 | 2025 |
| (Income Statement) | ||||||||||
| Sales | 4,100 | 4,379 | 5,318 | 5,758 | 4,990 | 5,610 | 5,265 | 6,896 | 7,324 | 8,555 |
| Year-on-year | 10.7% | 6.8% | 21.4% | 8.3% | -13.3% | 12.4% | -6.1% | 31.0% | 6.2% | 16.8% |
| Cost of Goods Sold | 1,703 | 1,822 | 2,546 | 2,879 | 2,367 | 2,614 | 2,843 | 3,894 | 4,010 | 4,762 |
| Gross Income | 2,396 | 2,558 | 2,772 | 2,879 | 2,623 | 2,996 | 2,422 | 3,002 | 3,314 | 3,793 |
| Gross Income Margin | 58.5% | 58.4% | 52.1% | 50.0% | 52.6% | 53.4% | 46.0% | 43.5% | 45.3% | 44.3% |
| SG&A Expense | 2,216 | 2,293 | 2,324 | 2,374 | 2,456 | 2,597 | 1,685 | 2,147 | 2,225 | 2,490 |
| EBIT (Operating Income) | 180 | 265 | 444 | 502 | 157 | 381 | 720 | 841 | 1,075 | 1,303 |
| Year-on-year | -89.5% | 46.7% | 68.0% | 12.9% | -68.8% | 143.8% | 88.7% | 16.8% | 27.8% | 21.2% |
| Operating Income Margin | 4.4% | 6.0% | 8.4% | 8.7% | 3.1% | 6.8% | 13.7% | 12.2% | 14.7% | 15.2% |
| EBITDA | 195 | 284 | 468 | 534 | 202 | 447 | 857 | 1,059 | 1,279 | 1,495 |
| Pretax Income | 181 | 257 | 432 | 502 | 70 | 288 | 768 | 862 | 1,034 | 1,305 |
| Consolidated Net Income | 163 | 221 | 366 | 372 | 13 | 132 | 539 | 546 | 621 | 977 |
| Minority Interest | 0 | 0 | 0 | 0 | 0 | 0 | 18 | 58 | 95 | 114 |
| Net Income ATOP | 163 | 221 | 366 | 372 | 13 | 132 | 520 | 488 | 526 | 863 |
| Year-on-year | 51.2% | 35.3% | 65.8% | 1.5% | -96.6% | 943.0% | 294.4% | -6.3% | 7.9% | 64.1% |
| Net Income Margin | 4.0% | 5.0% | 6.9% | 6.5% | 0.3% | 2.4% | 9.9% | 7.1% | 7.2% | 10.1% |
| (Balance Sheet) | ||||||||||
| Cash & Short-Term Investments | 611 | 659 | 1,012 | 1,032 | 1,531 | 1,943 | 2,318 | 2,691 | 3,260 | 3,578 |
| Total assets | 1,784 | 2,113 | 2,637 | 2,831 | 3,068 | 3,572 | 5,044 | 5,428 | 5,810 | 6,656 |
| Total Debt | 462 | 390 | 280 | 163 | 531 | 591 | 967 | 767 | 539 | 357 |
| Net Debt | -149 | -269 | -732 | -869 | -1,000 | -1,352 | -1,351 | -1,925 | -2,721 | -3,221 |
| Total liabilities | 1,003 | 1,105 | 1,109 | 930 | 1,254 | 1,630 | 2,267 | 2,097 | 1,921 | 1,957 |
| Total Shareholders’ Equity | 782 | 1,008 | 1,528 | 1,901 | 1,814 | 1,942 | 2,595 | 3,090 | 3,553 | 4,336 |
| (Cash Flow) | ||||||||||
| Net Operating Cash Flow | 125 | 152 | 437 | 274 | 384 | 442 | 546 | 771 | 911 | 855 |
| Capital Expenditure | 13 | 9 | 15 | 36 | 30 | 155 | 67 | 54 | 33 | 51 |
| Net Investing Cash Flow | -16 | -15 | -131 | -123 | -102 | -26 | -397 | -35 | -37 | -109 |
| Net Financing Cash Flow | 31 | -89 | 47 | -132 | 242 | 16 | 220 | -375 | -311 | -428 |
| Free Cash Flow | 112 | 144 | 422 | 238 | 355 | 286 | 479 | 717 | 878 | 804 |
| (Profitability ) | ||||||||||
| ROA (%) | 8.11 | 11.34 | 15.43 | 13.60 | 0.43 | 3.97 | 12.08 | 9.31 | 9.36 | 13.85 |
| ROE (%) | 23.24 | 24.69 | 28.89 | 21.69 | 0.68 | 7.03 | 22.94 | 17.15 | 15.84 | 21.88 |
| Net Margin (%) | 3.99 | 5.05 | 6.89 | 6.46 | 0.25 | 2.35 | 9.89 | 7.07 | 7.18 | 10.09 |
| Asset Turn | 2.03 | 2.25 | 2.24 | 2.11 | 1.69 | 1.69 | 1.22 | 1.32 | 1.30 | 1.37 |
| Assets/Equity | 2.87 | 2.18 | 1.87 | 1.59 | 1.59 | 1.77 | 1.90 | 1.84 | 1.69 | 1.58 |
| (Per-share) Unit: JPY | ||||||||||
| EPS | 22.2 | 30.0 | 46.6 | 46.6 | 1.6 | 16.3 | 61.2 | 56.6 | 60.6 | 99.0 |
| BPS | 106.0 | 136.7 | 191.9 | 237.9 | 229.8 | 236.1 | 299.5 | 356.7 | 408.2 | 496.4 |
| Dividend per Share | 0.00 | 0.00 | 2.50 | 5.00 | 6.00 | 7.00 | 8.00 | 10.00 | 12.00 | 14.00 |
| Shares Outstanding (million shares) | 7.56 | 7.56 | 8.15 | 8.17 | 8.18 | 8.64 | 8.74 | 8.78 | 8.79 | 8.81 |
Source: Omega Investment from company materials