2026-06-16
Home
Japanese

Omega Investment Co., Ltd.
Cosmo Bio (Company note – 1Q update)

| Share price (6/15) | ¥1,228 | Dividend Yield (26/12 CE) | 4.0 % |
| 52weeks high/low | ¥1,486/1,083 | ROE(25/12) | 3.7 % |
| Avg Vol (3 month) | 5.3 thou shrs | Operating margin (25/12) | 3.2 % |
| Market Cap | ¥7.42 bn | Beta (5Y Monthly) | 0.2 |
| Enterprise Value | ¥3.76 bn | Shares Outstanding | 6.048 mn shrs |
| PER (26/12 CE) | 31.7 X | Listed market | TSE Standard |
| PBR (25/12 act) | 0.7X |
| Click here for the PDF version of this page |
| PDF version |
1Q saw an increase in revenue
◇ 1Q FY12/2026 financial results highlights: A steady start
Cosmo Bio’s 1Q FY12/2026 financial results, announced on May 8, 2026, showed a year-on-year increase in revenue, and quarterly net income attributable to owners of the parent increased. Operating profit and ordinary profit, meanwhile, declined.
Net sales were 3.33 billion yen (up 7.7% YoY), operating profit was 0.27 billion yen (down 1.0% YoY), ordinary profit was 0.26 billion yen (down 9.7% YoY), and quarterly net income attributable to owners of the parent was 0.22 billion yen (up 4.7% YoY). The exchange rate was 153 yen/USD (152 yen/USD in the same period of the previous fiscal year). Progress was generally solid relative to the company forecast.
Net sales increased steadily in both research reagents and equipment, and the gross profit margin was 34.1% (down 0.1 percentage point YoY), remaining almost unchanged. However, SG&A expenses increased due to higher personnel expenses, resulting in a slight decline in operating profit. Although the amount was small, a foreign exchange loss was recorded, causing ordinary profit to decline as well. In contrast, quarterly net income increased as gains from the sale of investment securities were recognized. Inventory was controlled appropriately, and there has been no material change in the balance sheet.
◇ 2Q FY12/2026 cumulative and full-year earnings forecasts: No change
There have been no changes to any of the earnings forecasts.
- 2Q cumulative forecast: net sales of 5.70 billion yen (up 5.5% YoY), operating profit of 0.17 billion yen (down 38.5% YoY), ordinary profit of 0.20 billion yen (down 41.7% YoY), and net income attributable to owners of the parent of 0.13 billion yen (down 48.2% YoY)
- Full-year forecast: net sales of 11.40 billion yen (up 5.9% YoY), operating profit of 0.27 billion yen (down 21.3% YoY), ordinary profit of 0.34 billion yen (down 30.5% YoY), and net income attributable to owners of the parent of 0.22 billion yen (down 34.7% YoY)
Progress in the first quarter has been steady relative to the full-year forecast. Also, in the second quarter, there appear to be signs that customers, in response to heightened geopolitical risk, are moving ahead of schedule to secure volume. Generally speaking, this is a phase in which, in addition to increased volume, it is easier to pass higher procurement costs through to prices. However, because procurement and inventory risks also increase, fluctuations in business performance may become larger. This should be noted.
◇ News on new businesses continues
The company is promoting new business development as a long-term growth strategy. Since the start of the year, the following two news items have been announced.
•“Next-generation femtech: Discovery of the PMS-mitigating effect of intake of lactic acid bacterium ‘KB-1’ and joint filing of a use patent” (March 27, 2026)
As a result of joint research and a human clinical trial with LAB Biotech, a startup originating from Hokkaido University, the company discovered that the lactic acid bacterium “KB-1” has an effect in alleviating symptoms associated with premenstrual syndrome (PMS) and jointly filed a patent application for a new use of “KB-1.”
“KB-1” is said to enhance the absorption of soy isoflavones and, according to the company, has been shown to alleviate physical and mental symptoms associated PMS through its intake. Going forward, the company aims to develop and sell supplements for people with PMS from the end of 2026 to the beginning of 2027 and also plans to consider notification as a Food with Function Claims.
•“Notice Regarding the Start of Construction of a New Poultry House for the Expansion of the Chicken Egg Bioreactor Business” (May 14, 2026)
A new poultry house will be built in Otaru, Hokkaido, and is scheduled to begin operations around winter 2026. The number of chickens that can be raised will double.
The main purposes are the “plan to create 50 types of genome-edited chickens by 2028” and the “maintenance and management of chickens expressing the sweet protein brazzein.” Regarding the latter, for the brazzein-expressing chickens successfully created in 2025, the company plans to establish a method for the mass purification of the protein and to conduct various evaluations, including safety assessments.
Brazzein is a natural, plant-derived protein, and its quality can be maintained under the stringent manufacturing processes used in the processed food and beverage industries, with expectations rising for it as a next-generation sweetener.
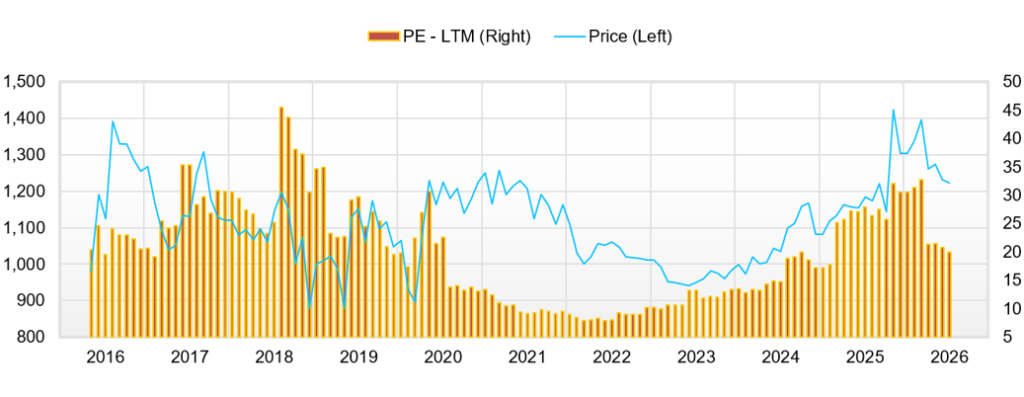
◇ Stock price trend and points of focus going forward
The stock price has remained on an upward trend since 2024. After the November 13, 2025, news release, “Successful development and manufacturing of the sweet protein ‘brazzein’ using the chicken egg bioreactor,” it reached a recent high of 1,486 yen. It continued to move within a high range. However, because the full-year financial results announced on February 13, 2026, indicated an increase in revenue but a decrease in profit for FY12/2026, the stock price has been weak. These two news items mentioned above also did not lead to movements in the stock price.
The current valuation is a PBR of 0.74x and a forecast dividend yield of 4.0%, and downside risk to the stock price appears limited. However, the forecast PER is 32x, and the actual ROE is 3.7%. For the stock price to re-enter an upward trajectory, expectations for business performance will need to rise.
Specific points of focus are as follows:
- Whether FY12/2026 business performance will exceed the company forecast: trends in the USD/JPY exchange rate, linking customer trends in response to geopolitical risk to increased earnings, and improving labor productivity through the promotion of DX, among other factors.
- Whether medium- to long-term growth potential will become concrete: the globalization of trading company functions progressing and reducing foreign exchange risk at the company-wide level, Scientist Cube, which is a contract service matching platform, beginning operations, and the development of and concrete earnings potential for value-added businesses such as the chicken egg bioreactor business, the Healthcare Science business (including the supplement business using lactic acid bacterium “KB-1”), and the peptide manufacturing business.
If new medium- to long-term growth drivers become clear, a scenario can be fully envisaged in which expectations for future ROE improvement push up the stock price and eliminate the discount to book value. It can be said that this is a phase in which news releases regarding new businesses should be watched more closely than before.
Company profile
Cosmo Bio Co., Ltd. is a bio-focused trading company that upholds the objective of “contributing to the advancement of life sciences.” It is one of the major providers of reagents for life science research, supplying as many as 10 million items from about 500 manufacturers worldwide. In recent years, it has expanded globally, advancing the functions of trading companies, launching its own contract services, and entering proprietary manufacturing and sales businesses. Expectations are placed on these to contribute to earnings, improve capital efficiency, and raise PBR.
Key financial data
| Unit: million yen | 2021/12 | 2022/12 | 2023/12 | 2024/12 | 2025/12 | 2026/12CE |
| Sales | 9,231 | 9,553 | 9,340 | 10,037 | 10,766 | 11,400 |
| EBIT (Operating Income) | 1,050 | 817 | 521 | 319 | 342 | 270 |
| Pretax Income | 1,099 | 790 | 653 | 369 | 504 | |
| Net Profit Attributable to Owner of Parent | 737 | 517 | 442 | 262 | 337 | 220 |
| Cash & Short-Term Investments | 3,555 | 3,036 | 3,025 | 2,693 | 2,946 | |
| Total assets | 10,072 | 10,313 | 10,872 | 11,723 | 12,662 | |
| Total Debt | 28 | 27 | 25 | 23 | 22 | |
| Net Debt | -3,527 | -3,009 | -3,000 | -2,670 | -2,924 | |
| Total liabilities | 1,750 | 1,693 | 1,844 | 2,166 | 2,704 | |
| Total Shareholders’ Equity | 7,787 | 8,052 | 8,445 | 8,968 | 9,373 | |
| Net Operating Cash Flow | 648 | 306 | 744 | 241 | 595 | |
| Capital Expenditure | 156 | 119 | 120 | 319 | 344 | |
| Net Investing Cash Flow | -145 | -313 | -766 | -217 | 43 | |
| Net Financing Cash Flow | -420 | -236 | -201 | -479 | -283 | |
| Free Cash Flow | 617 | 251 | 677 | 25 | 366 | |
| ROA (%) | 7.48 | 5.07 | 4.17 | 2.32 | 2.76 | |
| ROE (%) | 9.73 | 6.53 | 5.36 | 3.01 | 3.66 | |
| EPS (Yen) | 126.9 | 89.1 | 75.8 | 45.0 | 59.3 | 38.8 |
| BPS (Yen) | 1,344.5 | 1,385.1 | 1,447.2 | 1,565.0 | 1,651.9 | |
| Dividend per Share (Yen) | 36.00 | 36.00 | 30.00 | 50.00 | 50.00 | 50.00 |
| Shares Outstanding (Million shares) | 6.05 | 6.05 | 6.05 | 6.05 | 6.05 |
Source: Calculated by Omega Investment based on FactSet’s standard criteria, rounded to the nearest whole number.
Share price
Financial data (quarterly basis)
| Unit: million yen | 2024/12 | 2025/12 | 2026/12 | ||||||
| 1Q | 2Q | 3Q | 4Q | 1Q | 2Q | 3Q | 4Q | 1Q | |
| (Income Statement) | |||||||||
| Sales | 2,943 | 2,186 | 2,280 | 2,628 | 3,093 | 2,309 | 2,483 | 2,881 | 3,331 |
| Year-on-year | 4.1% | 9.4% | 11.2% | 6.7% | 5.1% | 5.6% | 8.9% | 9.6% | 7.7% |
| Cost of Goods Sold (COGS) | 1,956 | 1,460 | 1,522 | 1,770 | 2,034 | 1,502 | 1,612 | 1,916 | 2,195 |
| Gross Income | 987 | 726 | 758 | 858 | 1,059 | 807 | 871 | 965 | 1,136 |
| Gross Income Margin | 33.5% | 33.2% | 33.2% | 32.6% | 34.2% | 35.0% | 35.1% | 33.5% | 34.1% |
| SG&A Expense | 681 | 708 | 713 | 908 | 785 | 805 | 871 | 898 | 864 |
| EBIT (Operating Income) | 306 | 18 | 45 | -50 | 274 | 2 | 0 | 67 | 272 |
| Year-on-year | -23.7% | -69.0% | -509.1% | -168.5% | -10.5% | -88.9% | -100.0% | -234.0% | -0.7% |
| Operating Income Margin | 10.4% | 0.8% | 2.0% | -1.9% | 8.9% | 0.1% | 0.0% | 2.3% | 8.2% |
| EBITDA | 336 | 50 | 79 | -10 | 308 | 40 | 41 | 121 | 318 |
| Pretax Income | 353 | 37 | 48 | -69 | 321 | 50 | 26 | 107 | 335 |
| Consolidated Net Income | 240 | 27 | 34 | -32 | 220 | 35 | 22 | 56 | 233 |
| Minority Interest | 10 | -2 | 2 | -3 | 7 | -2 | -1 | -7 | 10 |
| Net Income ATOP | 230 | 28 | 33 | -29 | 212 | 38 | 22 | 65 | 222 |
| Year-on-year | -12.9% | -71.1% | 560.0% | -138.2% | -7.8% | 35.7% | -33.3% | -324.1% | 4.7% |
| Net Income Margin | 7.8% | 1.3% | 1.4% | -1.1% | 6.9% | 1.6% | 0.9% | 2.3% | 6.7% |
| (Balance Sheet) | |||||||||
| Cash & Short-Term Investments | 2,813 | 3,224 | 3,044 | 2,693 | 2,497 | 3,192 | 3,192 | 2,946 | 3,242 |
| Total assets | 11,594 | 11,739 | 11,333 | 11,723 | 11,516 | 11,790 | 12,266 | 12,662 | 12,539 |
| Total Debt | 316 | 418 | 370 | 23 | 345 | 490 | 667 | 22 | 641 |
| Net Debt | -2,497 | -2,806 | -2,674 | -2,670 | -2,152 | -2,702 | -2,525 | -2,924 | -2,601 |
| Total liabilities | 2,101 | 1,953 | 1,853 | 2,166 | 2,160 | 2,114 | 2,396 | 2,704 | 2,488 |
| Total Shareholders’ Equity | 8,903 | 9,197 | 8,889 | 8,968 | 8,763 | 9,084 | 9,279 | 9,373 | 9,459 |
| (Profitability %) | |||||||||
| ROA | 3.66 | 3.01 | 3.31 | 2.32 | 2.12 | 2.15 | 2.07 | 2.76 | 2.88 |
| ROE | 4.76 | 3.84 | 4.23 | 3.01 | 2.77 | 2.77 | 2.69 | 3.66 | 3.80 |
| (Per-share) Unit: JPY | |||||||||
| EPS | 39.4 | 4.8 | 5.7 | -5.1 | 37.1 | 6.7 | 3.9 | 11.5 | 39.1 |
| BPS | 1,525.8 | 1,569.7 | 1,532.0 | 1,565.0 | 1,536.8 | 1,597.1 | 1,635.1 | 1,651.9 | 1,667.5 |
| Dividend per Share | 0.00 | 14.00 | 0.00 | 36.00 | 0.00 | 25.00 | 0.00 | 25.00 | 0.00 |
| Shares Outstanding(million shares) | 6.05 | 6.05 | 6.05 | 6.05 | 6.05 | 6.05 | 6.05 | 6.05 | 6.05 |
Source: Calculated by Omega Investment based on FactSet’s standard criteria, rounded to the nearest whole number.
Financial data (full-year basis)
| Unit: million yen | 2016/12 | 2017/12 | 2018/12 | 2019/12 | 2020/12 | 2021/12 | 2022/12 | 2023/12 | 2024/12 | 2025/12 |
| (Income Statement) | ||||||||||
| Sales | 7,427 | 7,068 | 7,261 | 7,590 | 8,092 | 9,231 | 9,553 | 9,340 | 10,037 | 10,766 |
| Year-on-year | 1.0% | -4.8% | 2.7% | 4.5% | 6.6% | 14.1% | 3.5% | -2.2% | 7.5% | 7.3% |
| Cost of Goods Sold | 4,655 | 4,535 | 4,607 | 4,710 | 4,940 | 5,572 | 6,112 | 6,090 | 6,708 | 7,064 |
| Gross Income | 2,772 | 2,533 | 2,654 | 2,880 | 3,152 | 3,659 | 3,441 | 3,250 | 3,329 | 3,702 |
| Gross Income Margin | 37.3% | 35.8% | 36.6% | 37.9% | 39.0% | 39.6% | 36.0% | 34.8% | 33.2% | 34.4% |
| SG&A Expense | 2,257 | 2,339 | 2,330 | 2,474 | 2,399 | 2,609 | 2,624 | 2,729 | 3,010 | 3,359 |
| EBIT (Operating Income) | 515 | 194 | 324 | 406 | 753 | 1,050 | 817 | 521 | 319 | 342 |
| Year-on-year | 157.5% | -62.3% | 67.0% | 25.3% | 85.5% | 39.4% | -22.2% | -36.2% | -38.8% | 7.2% |
| Operating Income Margin | 6.9% | 2.7% | 4.5% | 5.3% | 9.3% | 11.4% | 8.6% | 5.6% | 3.2% | 3.2% |
| EBITDA | 600 | 350 | 507 | 613 | 928 | 1,216 | 958 | 669 | 455 | 509 |
| Pretax Income | 456 | 400 | 403 | 388 | 1,008 | 1,099 | 790 | 653 | 369 | 504 |
| Consolidated Net Income | 276 | 250 | 278 | 246 | 701 | 768 | 552 | 461 | 269 | 333 |
| Minority Interest | 22 | 12 | 17 | 8 | 27 | 31 | 35 | 19 | 7 | -3 |
| Net Income ATOP | 254 | 237 | 260 | 237 | 674 | 737 | 517 | 442 | 262 | 337 |
| Year-on-year | 10.4% | -6.7% | 9.7% | -8.8% | 184.4% | 9.3% | -29.9% | -14.5% | -40.7% | 28.6% |
| Net Income Margin | 3.4% | 3.4% | 3.6% | 3.1% | 8.3% | 8.0% | 5.4% | 4.7% | 2.6% | 3.1% |
| (Balance Sheet) | ||||||||||
| Cash & Short-Term Investments | 1,948 | 1,483 | 2,268 | 2,516 | 3,259 | 3,555 | 3,036 | 3,025 | 2,693 | 2,946 |
| Total assets | 7,934 | 8,126 | 8,501 | 8,890 | 9,640 | 10,072 | 10,313 | 10,872 | 11,723 | 12,662 |
| Total Debt | 20 | 20 | 20 | 20 | 20 | 28 | 27 | 25 | 23 | 22 |
| Net Debt | -1,928 | -1,463 | -2,248 | -2,496 | -3,239 | -3,527 | -3,009 | -3,000 | -2,670 | -2,924 |
| Total liabilities | 1,350 | 1,286 | 1,445 | 1,566 | 1,776 | 1,750 | 1,693 | 1,844 | 2,166 | 2,704 |
| Total Sharehjolders’ Equity | 6,135 | 6,381 | 6,581 | 6,843 | 7,358 | 7,787 | 8,052 | 8,445 | 8,968 | 9,373 |
| (Cash Flow) | ||||||||||
| Net Operating Cash Flow | 573 | 294 | 909 | 569 | 803 | 648 | 306 | 744 | 241 | 595 |
| Capital Expenditure | 252 | 546 | 152 | 171 | 76 | 156 | 119 | 120 | 319 | 344 |
| Net Investing Cash Flow | 99 | -440 | -186 | -135 | 42 | -145 | -313 | -766 | -217 | 43 |
| Net Financing Cash Flow | -107 | -109 | -85 | -85 | -97 | -420 | -236 | -201 | -479 | -283 |
| Free Cash Flow | 444 | -185 | 858 | 428 | 767 | 617 | 251 | 677 | 25 | 366 |
| (Profitability %) | ||||||||||
| ROA | 3.23 | 2.96 | 3.14 | 2.74 | 7.27 | 7.48 | 5.07 | 4.17 | 2.32 | 2.76 |
| ROE | 4.20 | 3.80 | 4.03 | 3.55 | 9.49 | 9.73 | 6.53 | 5.36 | 3.01 | 3.66 |
| Net profit margin | 3.42 | 3.37 | 3.59 | 3.14 | 8.33 | 7.98 | 5.41 | 4.73 | 2.61 | 3.12 |
| Asset turnover ratio | 0.94 | 0.88 | 0.87 | 0.87 | 0.87 | 0.94 | 0.94 | 0.88 | 0.89 | 0.88 |
| Financial leverage | 1.30 | 1.28 | 1.28 | 1.30 | 1.30 | 1.30 | 1.29 | 1.28 | 1.30 | 1.33 |
| (Per-share) Unit: JPY | ||||||||||
| EPS | 42.8 | 40.0 | 43.9 | 40.0 | 113.7 | 126.9 | 89.1 | 75.8 | 45.0 | 59.3 |
| BPS | 1,034.9 | 1,076.4 | 1,110.2 | 1,154.4 | 1,241.2 | 1,344.5 | 1,385.1 | 1,447.2 | 1,565.0 | 1,651.9 |
| Dividend per Share | 18.00 | 14.00 | 14.00 | 14.00 | 34.00 | 36.00 | 36.00 | 30.00 | 50.00 | 50.00 |
| Shares Outstanding(million shares) | 6.05 | 6.05 | 6.05 | 6.05 | 6.05 | 6.05 | 6.05 | 6.05 | 6.05 | 6.05 |
Source: Calculated by Omega Investment based on FactSet’s standard criteria, rounded to the nearest whole number.