2026-11-06
Home
Japanese

Omega Investment Co., Ltd.
TOKYO ELECTRON DEVICE (Investment report – Basic)
| Share price (11/10) | ¥3,790 | Dividend Yield (27/3 CE) | 4.0 % |
| 52weeks high/low | ¥5,230/2,833 | ROE(26/3 act) | 15.6 % |
| Avg Vol (3 month) | 184.9 thou shrs | Operating income margin (26/3 act) | 5.0 % |
| Market Cap | ¥118.77 bn | Beta (5Y Monthly) | 0.81 |
| Enterprise Value | ¥124.78 bn | Shares Outstanding | 31.336 mn shrs |
| PER (27/3 CE) | 10.1 X | Listed market | TSE Prime section |
| PBR (26/3 act) | 2.0 X |
| Click here for the PDF version of this page |
| PDF version |
Earnings recovery has been confirmed. The next stage of share price appreciation will be determined by profit margins, ROIC, and cash generation.
Investment conclusion
We maintain a bullish investment conclusion. In the previous Basic Report published in February 2026, we indicated that equity holdings should be increased after confirming the end of the market inventory adjustment in the EC Business, an improvement in orders or leading sales indicators, and a reversal in the gross profit margin and operating income margin. Through the first and second quarters of FY3/2027, a substantial portion of these conditions has subsequently been met. Accordingly, this Basic Report does not need to return to the earlier argument of waiting for the bottom of the cycle. The focus of the investment conclusion has shifted to whether the recovered sales and profits can be maintained from FY3/2028 onward and translated into improvements in ROIC and cash generation.
The share price has risen from 3,765 yen at the time of the previous Basic Report to 4,360 yen, while the Company’s forecast EPS has increased from around 244 yen to 373.78 yen. The earnings forecast improvement has outpaced the share price rise, and the current forecast PER has declined to 11.7 times. PBR is 2.33 times, the forecast dividend yield is 3.5%, and forecast ROE calculated using the simplified method is 20.0%. Looking only at the share price, it is higher than before. However, considering the recovery in earnings and capital efficiency, we do not view the stock valuation as having become excessive.
On the other hand, the median of the central fair values estimated using the three PBR, DCF, and ROIC methods is 4,300 yen, almost the same as the current share price. We therefore do not base our investment conclusion primarily on the view that the current share price is substantially undervalued. Further share price appreciation over the next one to two years will require converting the order backlog into sales, improving profit margins, normalizing inventories and trade receivables, and improving operating cash flow. Over the medium to long term, the key question is whether the Company can achieve the VISION2030 targets of an ordinary income margin of at least 8% and ROE of at least 20%.
The cautious stance in the previous Basic Report published in February 2026 was reasonable given the earnings environment at the time. However, we were somewhat too cautious about the timing of the recovery and the pace of EC Business profit recovery. We also acknowledged this point in the 1Q Update Report. With that lesson in mind, we will assess not only sales volume but also the order backlog, product prices, project mix, profit margins, and working capital as an integrated whole. Now that the confirmation conditions for the earnings recovery have been met, short-term volatility in semiconductor stocks alone should not weaken the investment conclusion.
1. Company profile and history
TOKYO ELECTRON DEVICE is a technology trading company centered on the Electronic Components Business (EC) and Computer Networks Business (CN), and also provides design and development of its own products, contract mass production, and maintenance and monitoring services for IT products. The Company was established in March 1986, has capital of 2.495 billion yen, net sales of 203.748 billion yen in FY3/2026, and 1,408 consolidated employees. It is listed on the Tokyo Stock Exchange, Prime Market, and Tokyo Electron holds 33.82% of shares outstanding. Rather than merely purchasing and reselling products, engineers are involved from the early stages of customers’ product development and IT infrastructure construction, expanding revenue opportunities through product selection, design support, operations, and maintenance.
The Company’s history is easiest to understand as a process of adding technology and manufacturing functions to its trading company functions. Tokyo Electron began selling electronic components in 1965 and opened a design and development center in 1985. In 1990, the business foundation for TOKYO ELECTRON DEVICE was established, and in 1998 the Company fully succeeded to Tokyo Electron’s electronic components business. It was listed on the Second Section of the Tokyo Stock Exchange in 2003, launched its inrevium private brand in 2004, and succeeded to Tokyo Electron’s computer and network business in 2006, adding what is now the CN Business. It was listed on the First Section of the Tokyo Stock Exchange in 2010, made the current TOKYO ELECTRON DEVICE NAGASAKI LIMITED a consolidated subsidiary in 2017, and further expanded the foundation of the PB Business in 2018, including by bringing in a company with image processing technology.
This history shows that the Company’s growth has not been driven simply by increased sales volume. It has deepened customer relationships by adding technical support, design, manufacturing, and services, while also expanding commercial rights. This business-model shift underpins the long-term rise in gross profit margin and operating income margin. The semiconductor cycle cannot be avoided, but if earnings power remains higher than before at each cyclical bottom, it is reasonable to view the Company as cyclical growth rather than simply a semiconductor trading company.
2. Business model and sources of competitiveness
The Company’s competitiveness lies first in commercial rights, second in customer contact through engineers, third in manufacturing capabilities, and fourth in the credibility generated by its relationship with the Tokyo Electron Group. In semiconductors and IT infrastructure, simply purchasing and reselling products tends to lead to price competition. The Company enters customers’ development processes, combines the optimal semiconductors, boards, and software, and provides design support, evaluation, mass production, and post-introduction maintenance, thereby creating relationships in which it is less likely to be compared solely on selling price.
In the EC Business, profitability depends on maintaining and expanding commercial rights while increasing the share of high-value-added products. In the CN Business, sales of network, storage, and security products are combined with maintenance and monitoring services, and recurring sales contribute to earnings stability. In the PB Business, the Company creates opportunities to improve gross margins by maintaining its own technology and manufacturing functions in areas such as wafer inspection systems and design and manufacturing services. Because the three businesses have different characteristics, total Company sales alone do not capture the substance of corporate value creation.
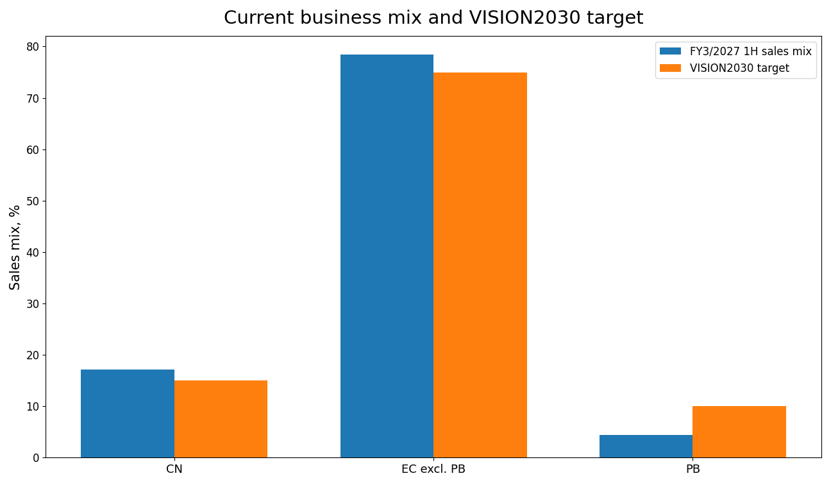
The key KPIs for the EC Business are orders, order backlog, sales by application, product mix, profit margins, and customer inventories. In the CN Business, sales of network- and security-related products, share of maintenance and monitoring services, and project profitability are important. In the PB Business, investors should monitor not only sales but also its share of total Company sales and profit margin. VISION2030 targets a PB Business sales composition ratio of 10%, and how far the current ratio in the 4% range can be raised will be an important indicator of structural improvement in the total Company profit margin.
3. Roles of the CN, EC, and PB Businesses
We have previously positioned the CN Business as a source of earnings support, but it is now evolving into a business that combines stable earnings with growth. In the first half of FY3/2027, net sales increased 12.9% YoY to 21.68 billion yen, and profit increased 10.8% to 2.89 billion yen. The profit margin remained in the 13% range, far above that of the EC Business. Network-related products, security-related products, and maintenance and monitoring services increased, absorbing the reactionary decline from a large storage-related project in the previous year. Maintenance and monitoring services are relatively resistant to economic fluctuations and help stabilize the earnings base.
In addition, the spread of AI agents is creating new security demand in areas such as access control, data protection, and GRC. The Company is strengthening its handling of security products and services, expanding its product portfolio from conventional network product sales into security areas premised on the use of AI. The CN Business accounts for less than 20% of total Company sales, but its earnings contribution is higher than its sales share, making its stable earnings significant.
The EC Business (including the PB Business) is the core driver of total Company sales and earnings growth. In the first half of FY3/2027, net sales increased 35.3% to 104.28 billion yen, while profit increased sharply to 4.46 billion yen. Sales for industrial equipment, automotive applications, and computers and peripherals all increased, with particularly strong growth in computers and peripherals. A broad range of products, including analog ICs, logic ICs, memory ICs, boards, and electronic components, recorded higher sales, confirming a recovery in demand following the inventory adjustment.
However, the increase in EC Business sales reflects not only a volume recovery but also higher product prices, yen depreciation, and advance orders in anticipation of longer lead times. Accordingly, large sales and order figures should not all be viewed as structural growth. Going forward, it will be necessary to assess volume excluding the effect of price increases, together with the time required to convert the order backlog into sales, profit margins, and customer inventories.
The PB Business is important to the Company’s evolution into a higher-value-added company, but it remains some distance from the VISION2030 target. First-half net sales declined 2.5% YoY to 5.50 billion yen, and its share of total Company sales fell to 4.4%. Given the Company’s explanation that many projects are scheduled for revenue recognition in the second half, the short-term sales decline should not be viewed as excessive. Nonetheless, growth toward the 10% sales composition ratio targeted for 2030 still needs confirmation. Structural growth in the PB Business, in addition to a cyclical recovery in the EC Business, would strengthen the path toward an overall Company profit margin of 8%.
4. Overseas business and global commercial rights
The Company’s overseas business is primarily linked to the EC Business. When customers shift production overseas, sales depend on whether the Company can maintain commercial rights and continue supplying customers locally. Centered on Japan, the Company has established bases in China, Hong Kong, Singapore, Thailand, the United States, and other locations, building a structure that follows customers’ overseas expansion. Rather than equating a higher overseas sales ratio with growth potential, it is more important to assess whether the Company can maintain commercial rights and technical support as customers shift production locations.
Foreign exchange also changes how earnings appear. U.S. dollar-denominated transactions account for most foreign-currency transactions, and yen depreciation tends to increase sales translated into yen. On the other hand, the impact on gross profit is not constant because it depends on purchase prices, the timing of selling price revisions, and foreign exchange hedging. Yen depreciation appears to have contributed to second-quarter sales growth, while foreign exchange gains and losses can work in the opposite direction below the operating line. Foreign exchange should therefore be assessed not only in terms of sales but also in terms of profit margins and cash flow.
Over the medium to long term, the key point in the overseas business is not simply whether sales at overseas consolidated subsidiaries increase, but whether the Company can follow the overseas production shifts of domestic customers without losing commercial rights. In industrial equipment and automotive applications in particular, customers’ global production footprints can change. Production transfers to regions where the Company does not have a sales base, or local regulations, may constrain sales activities. How far the Company can absorb this risk through its network of bases, commercial rights, and technical support will be important.
5. Long-term earnings and changes in the earnings structure
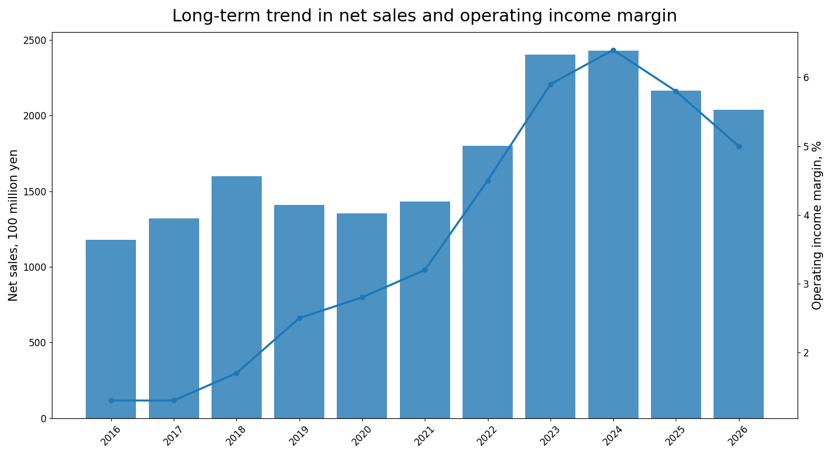
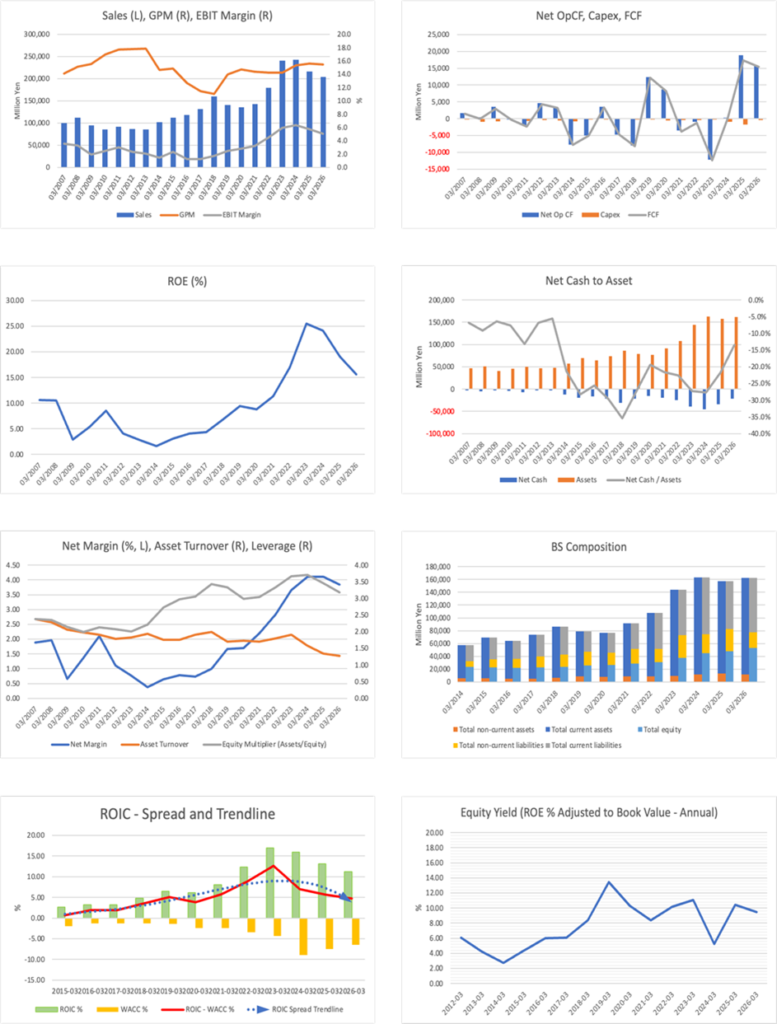
Looking at long-term earnings, the Company is a typical semiconductor-cycle company, yet it has raised the floor of its earnings power through successive cycles. Net sales expanded from 117.8 billion yen in FY3/2016 to 242.9 billion yen in FY3/2024. Sales declined in FY3/2025 and FY3/2026 due to the market inventory adjustment, but the Company’s FY3/2027 forecast of 270.0 billion yen calls for a record high.
More important is the profit margin. The operating income margin rose from 1.3% in FY3/2016 to 6.4% in FY3/2024. Although it declined to 5.0% in FY3/2026, this level is substantially higher than the low-profitability period in the first half of the 2010s. This improvement is difficult to explain solely by higher semiconductor prices. It is more natural to view it as a shift in sales quality driven by technical support, services, design and manufacturing, and the expansion of commercial rights.
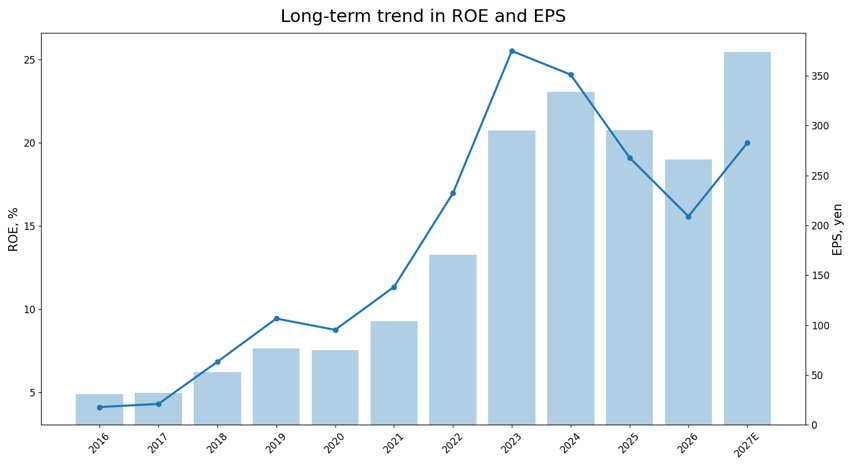
ROE shows a similar pattern, rising from 4.1% in FY3/2016 to 25.5% in FY3/2023. It declined to 15.6% in FY3/2026, but forecast ROE calculated using the simplified method based on the Company’s FY3/2027 forecast EPS and latest BPS returns to 20.0%. For long-term stock valuation, the important point is not the rate of sales growth but whether profit margins and ROE can settle into a structurally higher range.
(Figure 1 Long-term trend in net sales and operating income margin)
6. FY3/2027 second-quarter results and full-year earnings forecast
In the first half of FY3/2027, net sales increased 30.9% YoY to 125.96 billion yen, operating income increased 114.0% to 7.62 billion yen, ordinary income increased 100.5% to 7.35 billion yen, and interim net income attributable to owners of parent increased 93.7% to 5.00 billion yen. The recovery in EC Business profitability confirmed in the first quarter continued in the second quarter, and the Company again raised its full-year forecast on October 28, following the upward revision in July.
The revised full-year plan calls for net sales of 270.0 billion yen, ordinary income of 16.0 billion yen, net income of 11.0 billion yen, EPS of 373.78 yen, and an annual dividend of 151 yen. Based on first-half results, the second half requires net sales of 144.04 billion yen and ordinary income of 8.65 billion yen, implying an ordinary income margin of 6.0%. This is above the first-half margin of 5.8% and also requires improvement from 5.2% in the second quarter alone. Accordingly, the sales target appears highly achievable given the substantial order backlog, while the earnings target assumes improved product mix and profitability.
This is where our view changes from the previous Update Report. At the first-quarter stage, we assessed that the Company’s plan remained cautious, but that degree of caution has diminished following the latest upward revision. However, additional upside would require a further improvement in the second-half profit margin. The share price declined 7.2% on October 29, 2026, the day after the earnings announcement, from the previous day’s closing price of 4,700 yen to 4,360 yen. We believe this decline reflected a shift in market focus away from the upward revision to the Company’s earnings forecast and toward the decline in the second-quarter standalone profit margin and the prospects for future margin improvement.
7. How to assess orders and the order backlog
First-half orders increased 104.8% YoY to 199.54 billion yen, and the order backlog at the end of September increased 86.8% to 219.74 billion yen. Second-quarter standalone orders were 99.77 billion yen, almost unchanged from 99.78 billion yen in the first quarter, which is positive because the order momentum did not end after only one quarter. EC Business orders increased to 86.07 billion yen in the second quarter, suggesting that the breadth of the demand recovery is expanding.
On the other hand, it would be risky to equate the size of the order backlog directly with future profits. The Company cites longer lead times, higher semiconductor prices, and customers placing orders in advance as factors behind the increase in orders. Order values include price increases and therefore do not equal volume growth. In addition, if customers order earlier to respond to longer lead times, future demand is brought forward. Going forward, it will be necessary to monitor the speed of conversion from order backlog to sales, cancellations, volume excluding price effects, and customer inventories.
Even so, the order backlog of 219.7 billion yen is equivalent to more than 80% of the Company’s full-year sales forecast of 270.0 billion yen and provides greater visibility into sales. The next focal point for the share price is not simply how many yen of sales the order backlog becomes, but the profit margin at which it is converted into sales. Testing order quality through profit margins and cash flow will be important when considering the second half of FY3/2027 and FY3/2028.
8. VISION2030 and growth strategy
VISION2030 targets net sales of 300.0 billion yen to 350.0 billion yen, an ordinary income margin of at least 8%, and ROE of at least 20% in FY3/2030. The target sales composition of the business portfolio is 15% for the CN Business, 75% for the EC Business (excluding the PB Business), and 10% for the PB Business*, while the target ordinary income margins are 12% for the CN Business, 7% for the EC Business, and 10% for the PB Business. The Company’s current FY3/2027 sales forecast of 270.0 billion yen is already approaching the target range in terms of sales scale.
*In the Company’s segment results, the EC Business includes the PB Business, whereas the PB Business is presented separately in the target sales composition under VISION2030.
Accordingly, the difficult part of VISION2030 is not sales but the profit margin. The Company forecasts an ordinary income margin of 5.9% for the current fiscal year, requiring an improvement of slightly more than two percentage points to reach the 8% target. To achieve this, the Company needs to increase the shares of services and security in the CN Business, increase high-value-added products and solution-based projects in the EC Business, and move the PB Business sales composition ratio closer to 10%. Reaching the target margin through an improved business mix, rather than only a cyclical recovery, would be more reproducible.
In capital policy, the Company aims to improve the equity ratio while also achieving ROE of at least 20%. Currently, working capital and borrowings are increasing alongside the earnings recovery, and the equity ratio is declining. To assess the quality of VISION2030, it is necessary to examine inventory levels, net interest-bearing debt, operating cash flow, and ROIC together with sales and earnings growth.
(Figure 2 Current business mix and VISION2030 target)
9. Relationship with the AI and semiconductor cycle
If the view that the upward phase in AI and semiconductor stocks is ending becomes more widespread, the TOKYO ELECTRON DEVICE share price may also be affected. The Company is traded as a semiconductor-related stock, and its market capitalization is smaller than that of major semiconductor companies, so the share price can move more than earnings changes would imply when funds flow out of the sector as a whole. In fact, the share price corrected approximately 17% from the year-to-date high of 5,230 yen on October 14 to the October 29 closing price of 4,360 yen.
Meanwhile, the impact on earnings is more diversified than for AI semiconductor manufacturers. The EC Business has multiple demand sources, including industrial equipment, automotive applications, and computers and peripherals, while the CN Business includes networks, security, and maintenance services. A decline in AI-related stock prices alone does not directly reduce the Company’s earnings.
More important is a slowdown in AI-related capital expenditure itself. Semiconductor manufacturing equipment, industrial equipment, PCs and storage, data centers, networks, and security all sit on the broader perimeter of AI investment. The Company is also positioning AI implementation support for industrial equipment, collaboration with Intel and Microsoft, and proprietary solutions as growth areas. The Company benefits as long as AI-related investment continues in the real economy, but a slowdown in capital expenditure could spill over into EC Business orders and CN infrastructure demand. A correction in AI-related stocks and the end of the AI capital expenditure cycle should be considered separately.
10. ROE, ROIC, cash flow, and capital efficiency
Forecast ROE calculated using the simplified method by dividing forecast EPS of 373.78 yen by the latest BPS of 1,868.6 yen is 20.0%, reaching the VISION2030 target level. This is positive evidence of the earnings recovery. However, the improvement in ROE should not automatically be regarded as an improvement in shareholder value; it is necessary to separate the contribution of higher profit margins from that of financial leverage. From a long-term perspective, financial leverage also rose, along with the improvement in the net profit margin, during periods when ROE increased.
The same applies to ROIC. It has declined since peaking in FY3/2023, but remains above WACC. In FY3/2027, profits are recovering sharply, while inventories, trade receivables, and interest-bearing debt are also increasing. Because both the numerator (profit) and the denominator (invested capital) are increasing, ROIC may not improve as quickly as the operating income margin. The important point going forward is whether the Company can increase profits while improving inventory turnover and trade receivables turnover.
Cash flow is a particular focus in this Basic Report. In FY3/2025 and FY3/2026, reductions in inventories and receivables boosted operating cash flow. In contrast, in the first half of FY3/2027, inventories and trade receivables increased as earnings recovered, and operating cash flow was an outflow of 4.76 billion yen. Strong earnings and declining cash can occur simultaneously in this trading-company-type business model.
At the end of September, cash and deposits were 6.13 billion yen and interest-bearing debt was 36.67 billion yen, resulting in net interest-bearing debt of approximately 30.55 billion yen. Because the Company is not in a net cash position, a net-cash-adjusted PER is not applicable. Rather than concluding that the stock is undervalued based only on the low forecast PER of 11.7 times, investors should consider the working capital burden and borrowings. If the order backlog converts into sales, inventories decline, and operating cash flow improves, corporate value should improve from both ROIC and financial soundness perspectives.
(Figure 3 Long-term trend in ROE and EPS)
(Figure 4 Long-term trend in operating cash flow, FCF, and net interest-bearing debt)
11. Shareholder returns, balance sheet, and capital allocation
The Company uses a consolidated payout ratio of 40% as its current guideline, and the annual dividend forecast for FY3/2027 has been raised to 151 yen. The payout ratio based on forecast EPS of 373.78 yen is 40.4%, almost exactly in line with the policy. The forecast dividend yield based on the current share price of 4,360 yen is 3.5%, and dividends moving with earnings growth provide shareholders with a clear return framework.
On the other hand, current working capital requirements are large, and net interest-bearing debt is also increasing. Accordingly, we do not assume large-scale share repurchases in the stock valuation. If operating cash flow increases as earnings recover, inventories and trade receivables normalize, and borrowings decline, the range of additional shareholder return measures may increase. At present, however, dividends remain the core form of shareholder returns.
We also reviewed investment securities and real estate, but did not identify unrealized assets large enough to affect the Company’s market capitalization materially. The overall scale of fixed assets is also limited, and we consider it appropriate to value the stock based on business earnings power rather than asset value. Accordingly, this report does not use PER adjusted for investment securities or PER adjusted for unrealized gains on real estate.
12. Management, governance, and ownership structure
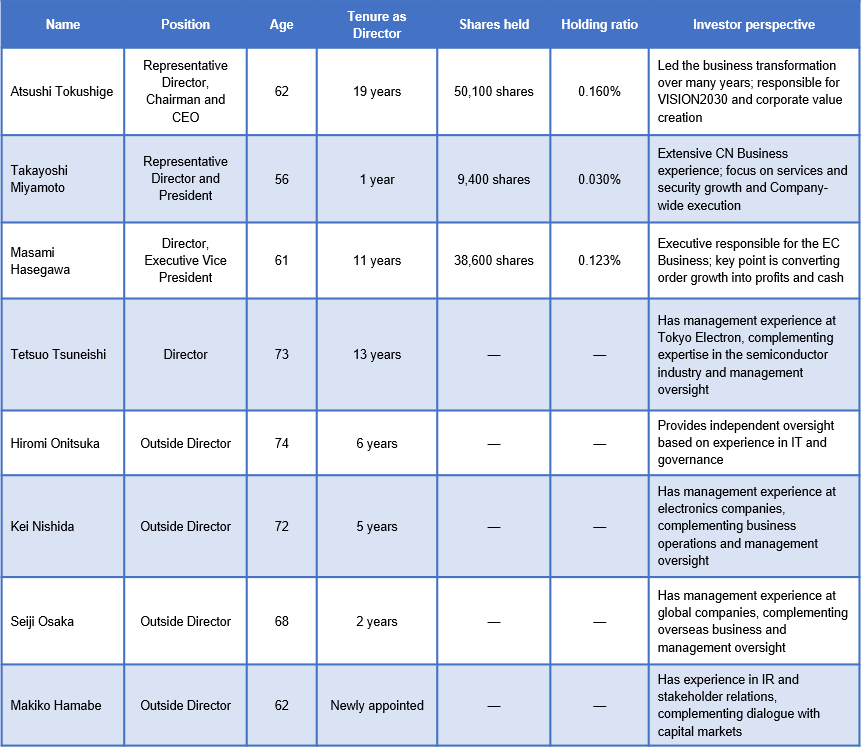
The management structure changed in April 2026, with Atsushi Tokushige becoming Chairman and CEO and Takayoshi Miyamoto becoming President. Mr. Tokushige has led the Company’s business transformation for many years. Mr. Miyamoto has extensive experience as a sales and business manager in the CN Business. He is responsible for Company-wide execution and growth in the CN Business through services, security, and AI-related demand. Masami Hasegawa is responsible for the EC Business, currently the core driver of the earnings recovery. The division of roles at the top can be viewed as Mr. Tokushige focusing on VISION2030 and corporate value, Mr. Miyamoto on Company-wide execution, and Mr. Hasegawa on EC Business earnings growth.
The Board consists of eight Directors, four of whom are Outside Directors. The Company has established Nomination and Compensation Committees and has built a governance structure that includes Outside Directors. Combining experience in semiconductor and IT expertise with management, finance, global business, and investor relations is important for overseeing the profitability and capital efficiency improvements required under VISION2030.
In the ownership structure, Tokyo Electron holds 33.82%. The employee stock ownership plan, trusts, and other stable shareholders are also among the major shareholders. This supports continuity of long-term strategy and credibility with business partners. On the other hand, the effective free float is limited, and the share price can be sensitive to inflows and outflows from institutional investors. FactSet data also show increased holdings by overseas asset managers, suggesting that the investor base may broaden as earnings recover.
(Management team)
13. Share price trend and valuation
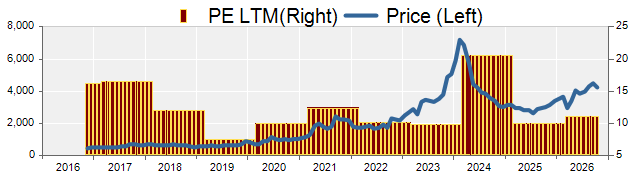
The share price rose sharply from 2021 through 2023, corrected in 2024, and recovered from 2025 onward. From 2021 through 2023, the main drivers were the semiconductor shortage, expansion of commercial rights, higher profit margins, and an increase in ROE into the 20% range. From 2024 onward, despite high earnings, customer inventory adjustments, a slowdown in the EC Business, and concerns about peak earnings weighed on the share price. In 2026, the end of the inventory adjustment and the earnings recovery were confirmed in the financial results, and the share price also rose sharply year-to-date.
At the current share price of 4,360 yen, the forecast PER is 11.7 times, PBR is 2.33 times, and the forecast dividend yield is 3.5%. The five-year historical CAGR from EPS of 104.1 yen in FY3/2021 to 265.9 yen in FY3/2026 is 20.6%. In contrast, the long-term EPS growth rate implied by a dividend-discount-based PER is approximately 6%, while the growth rate implied by PBR and forecast ROE is slightly below 2%. Taken together, we estimate that the market is pricing in growth of around 4%. The market is not assuming that the high growth recorded over the past five years will continue indefinitely.
That caution is reasonable. Past growth reflected a combination of the semiconductor cycle, price increases, expansion of commercial rights, and higher profit margins, so it would not be appropriate to assume 20% growth in perpetuity. Even so, a forecast PER in the 11 times range is not a high valuation for a company expected to generate ROE of 20%. We believe the market is discounting the cyclicality of earnings, the working capital burden, and the sustainability of AI-related investment.
Under the three PBR, DCF, and ROIC methods, we estimate a fair value range of 3,600 yen to 5,500 yen under the PBR method, 3,200 yen to 5,400 yen under the DCF method, and 3,300 yen to 5,100 yen under the ROIC method. The central values are 4,600 yen, 4,300 yen, and 4,300 yen, respectively, with the median of the three central values at 4,300 yen. The current share price is close to the central value and is not at a level where a substantial increase can be asserted based solely on the current Company forecast. Further share price appreciation requires either earnings growth from FY3/2028 onward or an increase in fair value resulting from improved capital efficiency.
(Fair value estimates)
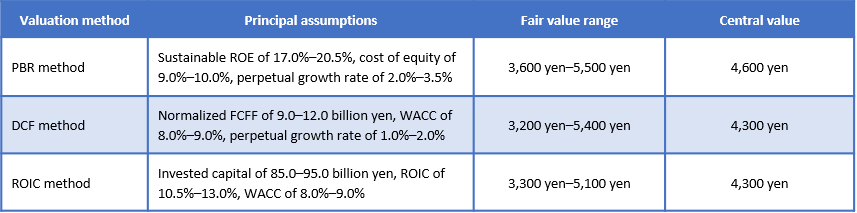
Note: The PBR method is based on a constant-growth model using sustainable ROE, the cost of equity, and the perpetual growth rate. Under the DCF method, enterprise value is calculated by discounting future free cash flow to the firm (FCFF) at the weighted average cost of capital (WACC). Equity value is then derived by deducting net interest-bearing debt of approximately 30.5 billion yen from enterprise value, and the resulting amount is divided by approximately 29.37 million shares outstanding, excluding treasury shares, to calculate the fair value per share. The fair values estimated using each method are based on certain assumptions adopted by Omega Investment.
14. Competitive environment and peer comparison
When valuing semiconductor and electronic component trading companies, differences in the quality of commercial rights, technical support capabilities, customer base, value-added services, and capital efficiency matter more than simple sales scale. TOKYO ELECTRON DEVICE, like Macnica Holdings and Marubun, handles semiconductors and electronic components, but is differentiated by its historical relationship with Tokyo Electron, its two pillars of EC and CN, and the manufacturer functions of the PB Business. Although it is not the largest company by scale, it has maintained relatively high ROE and profit margins.
In the previous Basic Report published in February 2026, TOKYO ELECTRON DEVICE’s forecast PER was slightly below Macnica Holdings and above Marubun, while TOKYO ELECTRON DEVICE had the highest ROE among the comparison companies. The Company’s forecast EPS has since been revised sharply upward, and TOKYO ELECTRON DEVICE’s forecast PER has declined to the 11-times range. This reflects that the earnings forecast increase has outpaced the share price rise, and the stock valuation is not excessively high relative to its capital efficiency.
TOKYO ELECTRON DEVICE can justify a premium relative to peers only if it improves ROIC while maintaining ROE around 20% and mitigates EC Business cyclicality through the CN and PB Businesses. Conversely, even if ROE is high, a higher PBR is difficult to justify if that ROE depends on financial leverage generated by increases in working capital and borrowings. Because the market considers not only profit but also the capital used to generate it, improvements in ROIC and operating cash flow will determine the valuation gap versus peers going forward.
Another competitive issue is commercial rights. Semiconductor manufacturers may change distributor policies, and industry consolidation and reorganization can lead to reviews of sales channels. The Company has grown by accumulating commercial rights, but distribution agreements are not permanently guaranteed. Strengthening technical support, involvement from the design stage, and proposals that combine multiple products will be important conditions for maintaining commercial rights by establishing a role that goes beyond a simple sales channel.
In this sense, the PB Business and service revenues in the CN Business also reduce the relative dependence of the EC Business on commercial rights. Design and manufacturing in the PB Business and maintenance and monitoring services in the CN Business create customer relationships that are less likely to be lost solely because of changes in semiconductor manufacturers’ distributor policies. The emphasis placed on the PB sales mix and services under VISION2030 can therefore be viewed not only as a strategy to improve profit margins but also to increase the resilience of the business portfolio.
15. Risk factors and downside scenarios
The largest business risk is the semiconductor cycle and customer inventories. From 2024 through 2026, the market inventory adjustment weighed on the EC Business, reducing not only sales but also profit margins. In FY3/2027, the opposite factors of demand recovery, price increases, and advance orders are occurring simultaneously. A strong current order backlog does not mean that another inventory adjustment cannot occur. If customer inventories begin to build, lead times shorten rapidly, or orders remain below sales for a sustained period, it will be necessary to consider the possibility that the cycle has peaked.
The second risk is profit margins. In the second quarter alone, sales exceeded the first quarter, while the gross profit margin, operating income margin, and ordinary income margin all declined. Even if higher product prices lift sales, profits may be difficult to increase if purchase prices rise or the proportion of lower-margin projects increases. Because the Company’s second-half plan assumes margins above the first-half level, failure of margins to recover from the third quarter onward would reduce the likelihood of achieving the earnings forecast even if sales are in line with plan.
The third risk is working capital and interest rates. Inventories increased sharply in the first half, and operating cash flow was an outflow. If the inventories correspond to the order backlog, cash should be recovered as sales are recorded. However, if demand slows, inventories and borrowings could remain simultaneously. If higher interest rates are added to funding that includes short-term borrowings and commercial paper, earnings could be pressured through non-operating expenses. This is why inventory turnover and net interest-bearing debt need to be monitored alongside profit margins.
The fourth risk is foreign exchange. Yen depreciation increases sales translated into yen, while affecting profits more complexly through purchase costs and foreign exchange gains and losses. Rapid yen appreciation would reduce reported sales, and could also affect gross profit if selling price revisions lag. The Company uses foreign exchange hedging and selling price revisions to reduce the impact, but it is difficult to offset rapid movements over a short period fully.
The fifth risk is a slowdown in AI- and semiconductor-related capital expenditure. A correction in AI-related stock prices alone would have limited impact on the business. However, an actual decline in investment in data centers, semiconductor manufacturing equipment, and industrial equipment would affect EC Business orders and CN infrastructure demand. The Company is not an AI semiconductor manufacturer, so its dependence on a single theme is limited. Nonetheless, because AI-related investment is included in the current demand recovery, changes in capital expenditure plans cannot be ignored.
The sixth risk is commercial rights and supplier policies. Changes in major suppliers’ sales strategies, consolidation among semiconductor manufacturers, or changes in distribution agreements could directly affect sales and profits. One reason the Company strengthens technical support and customer contact is to create a role that cannot be replaced by price and logistics alone. It is necessary to assess not only the number of commercial rights acquired, but also the continued retention of existing commercial rights and the depth of integration into customer projects.
16. Long-term relationship between share price and earnings
Over roughly the past five years, earnings and the share price have not always moved in tandem. From 2021 through 2023, the share price rose sharply on earnings growth and higher ROE. In 2024, however, the share price declined despite maintaining a high level of earnings because the equity market priced in inventory adjustments and lower earnings in the following fiscal year ahead of the actual results. From 2025 through the first half of 2026, the share price recovered while earnings were still weak, anticipating the end of inventory adjustments and a reversal in earnings.
Given this, changing the investment conclusion based only on the most recent quarter’s profit tends to be late for this stock. It is more important to read the next earnings phase from order trends, inventories, profit margins, and customer investment. The earnings recovery has now been confirmed in the first and second quarters, and the share price corrected after rising to the year-to-date high of 5,230 yen. We view the decline on the day after the results as a reassessment of the sustainability of profit margins against high expectations, rather than a rejection of the strong financial results.
If earnings remain strong but the share price fails to rise, there are three main possible reasons. First, the market may be anticipating an earnings peak. Second, the stock valuation of AI and semiconductor stocks as a whole may be declining. Third, operating cash flow and ROIC may not be improving as much as earnings. Conversely, even if near-term profits are weak, the share price may rise ahead of earnings if leading indicators for orders and profit margins improve.
Accordingly, the gap between the share price and earnings should not simply be judged as undervaluation or overvaluation for this stock; it is necessary to consider how much of the next cycle the market is already pricing in. The current forecast PER in the 11 times range appears low, but PER on peak earnings in the semiconductor cycle is typically low. Confirmation that current fiscal-year earnings are not the peak and can be maintained or increased from FY3/2028 onward is the condition that would turn the low PER into genuine undervaluation.
17. Assessment of the management structure and points for investors to monitor
The 2026 change in the management structure should be viewed not simply as a change in titles but as a division of roles aligned with the execution phase of VISION2030. Mr. Tokushige has served as a Director since 2007 and led the Company’s business expansion as Representative Director and President from 2015 onward. Much of the current business structure comprising the EC, CN, and PB Businesses was formed during his tenure. Now that he is Chairman and CEO, the main areas for assessment are medium- to long-term strategy, capital efficiency, and business portfolio design rather than short-term sales execution.
Mr. Miyamoto has experience as a sales manager and Business Unit head in the CN Business and became Representative Director and President in April 2026. The CN Business has high profit margins and recurring revenues from services and security. Given Mr. Miyamoto’s background, the management challenge is not only to connect the EC Business recovery to total Company growth but also to expand service-type revenues in the CN Business and reduce earnings volatility. His performance as President should be assessed not only on sales growth but also on improvements in profit margins, ROIC, and operating cash flow.
Mr. Hasegawa, as head of the EC Business, is directly involved in the current earnings recovery. Orders and sales increased sharply in the first half, but the second-quarter standalone margin declined. Going forward, the key issue will be the product mix through which the order backlog is converted into sales and the level of gross profit that can be secured. Because the EC Business accounts for the majority of total Company sales, Mr. Hasegawa’s area of responsibility will have a major impact not only on FY3/2027 results but also on the level of earnings in FY3/2028.
The Board structure, including four Outside Directors, indicates that the Company emphasizes not only technology and sales but also capital markets, governance, and global management. In particular, Ms. Hamabe has extensive experience in investor and stakeholder relations, which is highly relevant to the Company’s current management focus on capital efficiency and investor dialogue, in addition to earnings growth. For medium- to long-term shareholder value creation, it will also be important for the Company to explain progress under VISION2030 not only in terms of sales but also ROE, ROIC, and cash flow.
Management shareholdings are 50,100 shares for Mr. Tokushige, 9,400 shares for Mr. Miyamoto, and 38,600 shares for Mr. Hasegawa. The ratios to shares outstanding are not large, but ownership of Company shares by key executives can be viewed positively in terms of alignment of interests with shareholders. Nonetheless, rather than the management ownership ratio itself, we will continue to monitor whether the compensation structure, including performance-linked stock compensation, is aligned with medium- to long-term improvements in capital efficiency.
18. Medium- to long-term equity investment conclusion
TOKYO ELECTRON DEVICE is affected by the semiconductor cycle, but it has raised the floor of profit margins and capital efficiency through successive cycles. The conditions set in the previous Basic Report published in February 2026—the end of the EC Business inventory adjustment, improved orders, and a reversal in profit margins—have largely been confirmed in the subsequent first and second quarters. We therefore maintain a bullish investment conclusion.
However, the Company has moved from confirming the recovery to assessing how sustainable the recovered profits will be. The order backlog is large, providing high visibility for the Company’s sales forecast. On the other hand, the second-quarter standalone margin declined from the first quarter, and operating cash flow also deteriorated due to higher working capital. What will drive the share price going forward is not simply the amount of sales or orders, but whether the order backlog converts into sales at high profit margins and whether inventories and trade receivables normalize and turn into cash.
Over a three- to four-year horizon, progress toward VISION2030 will be central. The Company’s forecast sales of 270.0 billion yen are already close to the target of 300.0 billion yen to 350.0 billion yen. The remaining challenge is an ordinary income margin of 8%. If CN services and security expand, EC moves toward higher value added, and the PB sales composition ratio rises, and if the Company moves closer to an 8% profit margin while improving ROIC, the fair value benchmark itself, currently around 4,300 yen, could rise.
Over a one- to two-year horizon, the key points are achievement of full-year ordinary income of 16.0 billion yen and whether that earnings level can be maintained or increased in FY3/2028. The share price may fluctuate during corrections in AI and semiconductor stocks as a whole. However, as long as the recovery in business earnings remains intact, orders continue to convert into sales, and cash generation improves, we see little need to change the medium- to long-term investment conclusion solely because of short-term market volatility.
Notes
The share price is the October 29, 2026 closing price of 4,360 yen. Forecast EPS of 373.78 yen and forecast dividend of 151 yen are based on the Company’s full-year forecast announced on October 28, 2026.
The latest BPS is 1,868.6 yen as of the end of September 2026. We estimate ROE at 20.0% using the simplified method: dividing forecast EPS of 373.78 yen by the latest BPS of 1,868.6 yen.
We calculated a forecast PER of 11.7 times, a PBR of 2.33 times, a forecast dividend yield of 3.5%, and a market capitalization of 128.06 billion yen based on the closing share price of 4,360 yen on October 29, 2026. Market capitalization was calculated using 29,370,681 shares outstanding, excluding 1,965,819 treasury shares from the total of 31,336,500 issued shares as of September 30, 2026.
Financial data are principally based on FactSet standardized data. They therefore may differ in part from line-item presentation, reclassifications, rounding, segment disclosure, and other figures in Company materials. Company materials are prioritized for business-by-business figures, KPIs, medium-term plans, capital allocation policy, and related information, supplemented by FactSet data and our calculations where necessary.
Fair value, PER, PBR, DCF, ROIC, and other valuation amounts used in the report are our calculations based on certain assumptions and do not constitute an investment recommendation or guarantee future share prices or corporate value. Net-cash-adjusted PER, PER adjusted for investment securities, and PER adjusted for unrealized gains on real estate are not used in this report.
Key financial data
| Unit: million yen | 2022/3 | 2023/3 | 2024/3 | 2025/3 | 2026/3 | 2027/3 CE |
| Sales | 179,907 | 240,350 | 242,888 | 216,379 | 203,748 | 270,000 |
| EBIT (Operating Income) | 8,133 | 14,228 | 15,429 | 12,459 | 10,254 | |
| Pretax Income | 7,910 | 12,469 | 13,887 | 11,408 | 10,883 | |
| Net Profit Attributable to Owner of Parent | 5,085 | 8,778 | 9,986 | 8,874 | 7,842 | 11,000 |
| Cash & Short-Term Investments | 5,134 | 6,538 | 6,867 | 8,384 | 7,622 | |
| Total assets | 108,045 | 143,751 | 162,567 | 156,841 | 162,211 | |
| Total Debt | 29,479 | 45,652 | 52,101 | 42,633 | 29,433 | |
| Net Debt | 24,345 | 39,114 | 45,234 | 34,249 | 21,811 | |
| Total liabilities | 76,025 | 104,753 | 116,377 | 107,837 | 108,455 | |
| Total Shareholders’ Equity | 30,953 | 37,848 | 45,042 | 47,860 | 52,830 | |
| Net Operating Cash Flow | -891 | -12,185 | 301 | 18,915 | 15,684 | |
| Capital Expenditure | 380 | 270 | 903 | 1,762 | 381 | |
| Net Investing Cash Flow | -155 | -199 | -2,695 | -2,068 | 1,200 | |
| Net Financing Cash Flow | 606 | 13,746 | 2,529 | -15,251 | -17,848 | |
| Free Cash Flow | -1,240 | -12,361 | -3 | 17,363 | 15,412 | |
| ROA (%) | 5.10 | 6.97 | 6.53 | 5.56 | 4.92 | |
| ROE (%) | 16.97 | 25.52 | 24.10 | 19.11 | 15.58 | |
| EPS (Yen) | 170.2 | 294.8 | 333.5 | 295.7 | 265.9 | 373.78 |
| BPS (Yen) | 1,042.4 | 1,268.2 | 1,501.1 | 1,624.1 | 1,794.0 | |
| Dividend per Share (Yen) | 68.33 | 118.33 | 135.00 | 119.00 | 107.00 | 151.00 |
| Shares Outstanding (Million shares) | 31.34 | 31.34 | 31.34 | 31.34 | 31.34 |
Source: Calculated by Omega Investment based on FactSet’s standard criteria, rounded to the nearest whole number. The number of shares outstanding reflects post-split adjusted figures.
Share price
Key stock price data
Financial data (quarterly basis)
| Unit: million yen | 2025/3 | 2026/3 | 2027/3 | ||||||
| 2Q | 3Q | 4Q | 1Q | 2Q | 3Q | 4Q | 1Q | 2Q | |
| (Income Statement) | |||||||||
| Sales | 55,105 | 50,384 | 54,283 | 45,136 | 51,108 | 50,472 | 57,032 | 60,322 | 65,636 |
| Year-on-year | -9.2% | -16.1% | -14.0% | -20.3% | -7.3% | 0.2% | 5.1% | 33.6% | 28.4% |
| Cost of Goods Sold (COGS) | 47,877 | 42,132 | 45,226 | 38,681 | 43,717 | 42,392 | 47,416 | 51,015 | 56,074 |
| Gross Income | 7,228 | 8,252 | 9,057 | 6,455 | 7,391 | 8,080 | 9,616 | 9,307 | 9,562 |
| Gross Income Margin | 13.1% | 16.4% | 16.7% | 14.3% | 14.5% | 16.0% | 16.9% | 15.4% | 14.6% |
| SG&A Expense | 5,189 | 5,686 | 5,457 | 4,999 | 5,284 | 5,336 | 5,669 | 5,240 | 6,007 |
| EBIT | 2,039 | 2,566 | 3,600 | 1,456 | 2,107 | 2,744 | 3,947 | 4,067 | 3,555 |
| Year-on-year | -42.2% | -30.8% | -21.2% | -65.8% | 3.3% | 6.9% | 9.6% | 179.3% | 68.7% |
| Operating Income Margin | 3.7% | 5.1% | 6.6% | 3.2% | 4.1% | 5.4% | 6.9% | 6.7% | 5.4% |
| EBITDA | 2,271 | 2,845 | 3,909 | 1,720 | 2,374 | 3,017 | 4,220 | 4,319 | 3,816 |
| Pretax Income | 2,532 | 1,786 | 3,476 | 1,715 | 1,950 | 3,427 | 3,791 | 3,908 | 3,445 |
| Consolidated Net Income | 1,812 | 1,279 | 3,307 | 1,240 | 1,368 | 2,451 | 2,825 | 2,667 | 2,347 |
| Minority Interest | 1 | 10 | 6 | 22 | 6 | 0 | 13 | 16 | 0 |
| Net Income ATOP | 1,811 | 1,269 | 3,300 | 1,217 | 1,363 | 2,450 | 2,812 | 2,651 | 2,347 |
| Year-on-year | -23.4% | -49.6% | 13.2% | -51.2% | -24.7% | 93.1% | -14.8% | 117.8% | 72.2% |
| Net Income Margin | 3.3% | 2.5% | 6.1% | 2.7% | 2.7% | 4.9% | 4.9% | 4.4% | 3.6% |
| (Balance Sheet) | |||||||||
| Cash & Short-Term Investments | 9,653 | 9,743 | 8,384 | 7,013 | 8,695 | 5,641 | 7,622 | 5,445 | 6,126 |
| Total assets | 164,278 | 163,485 | 156,841 | 144,121 | 154,925 | 158,331 | 162,211 | 163,594 | 186,396 |
| Total Debt | 52,161 | 50,244 | 42,633 | 32,498 | 38,305 | 34,825 | 29,433 | 33,530 | 36,672 |
| Net Debt | 42,508 | 40,501 | 34,249 | 25,485 | 29,610 | 29,184 | 21,811 | 28,085 | 30,546 |
| Total liabilities | 116,407 | 115,601 | 107,837 | 96,023 | 106,517 | 108,240 | 108,455 | 109,231 | 131,513 |
| Total Shareholders’ Equity | 46,743 | 46,746 | 47,860 | 46,939 | 47,244 | 49,176 | 52,830 | 53,432 | 54,880 |
| (Profitability %) | |||||||||
| ROA | 6.27 | 5.32 | 5.56 | 4.97 | 4.48 | 5.18 | 4.92 | 6.03 | 6.01 |
| ROE | 22.13 | 19.17 | 19.11 | 16.41 | 15.21 | 17.37 | 15.58 | 18.48 | 20.09 |
| (Per-share) Unit: JPY | |||||||||
| EPS | 60.1 | 42.1 | 110.8 | 41.2 | 46.0 | 83.3 | 95.5 | 90.0 | 79.8 |
| BPS | 1,552.5 | 1,550.5 | 1,624.1 | 1,583.3 | 1,608.2 | 1,671.8 | 1,794.0 | 1,812.2 | 1,868.6 |
| Dividend per Share | 52.00 | 0.00 | 67.00 | 0.00 | 35.00 | 0.00 | 72.00 | 0.00 | 69.00 |
| Shares Outstanding (million shares) | 31.34 | 31.34 | 31.34 | 31.34 | 31.34 | 31.34 | 31.34 | 31.34 | 31.34 |
Source: Calculated by Omega Investment based on FactSet’s standard criteria, rounded to the nearest whole number. The number of shares outstanding reflects post-split adjusted figures.
Financial data (full-year basis)
| Unit: million yen | 2017 | 2018 | 2019 | 2020 | 2021 | 2022 | 2023 | 2024 | 2025 | 2026 |
| (Income Statement) | ||||||||||
| Sales | 131,855 | 159,841 | 141,000 | 135,394 | 143,268 | 179,907 | 240,350 | 242,888 | 216,379 | 203,748 |
| Year-on-year | 11.9% | 21.2% | -11.8% | -4.0% | 5.8% | 25.6% | 33.6% | 1.1% | -10.9% | -5.8% |
| Cost of Goods Sold | 116,709 | 142,160 | 121,295 | 115,491 | 122,666 | 154,268 | 206,106 | 205,720 | 182,646 | 172,206 |
| Gross Income | 15,146 | 17,681 | 19,705 | 19,903 | 20,602 | 25,639 | 34,244 | 37,168 | 33,733 | 31,542 |
| Gross Income Margin | 11.5% | 11.1% | 14.0% | 14.7% | 14.4% | 14.3% | 14.2% | 15.3% | 15.6% | 15.5% |
| SG&A Expense | 13,481 | 14,924 | 16,179 | 16,091 | 15,981 | 17,506 | 20,016 | 21,739 | 21,274 | 21,288 |
| EBIT (Operating Income) | 1,665 | 2,757 | 3,526 | 3,812 | 4,621 | 8,133 | 14,228 | 15,429 | 12,459 | 10,254 |
| Year-on-year | 11.7% | 65.6% | 27.9% | 8.1% | 21.2% | 76.0% | 74.9% | 8.4% | -19.2% | -17.7% |
| Operating Income Margin | 1.3% | 1.7% | 2.5% | 2.8% | 3.2% | 4.5% | 5.9% | 6.4% | 5.8% | 5.0% |
| EBITDA | 2,254 | 3,317 | 4,035 | 4,451 | 5,234 | 8,864 | 14,787 | 16,192 | 13,520 | 11,331 |
| Pretax Income | 1,435 | 2,485 | 3,257 | 3,227 | 4,589 | 7,910 | 12,469 | 13,887 | 11,408 | 10,883 |
| Consolidated Net Income | 972 | 1,655 | 2,403 | 2,370 | 3,217 | 5,489 | 8,879 | 10,081 | 8,904 | 7,884 |
| Minority Interest | 0 | 56 | 61 | 81 | 74 | 404 | 100 | 94 | 29 | 41 |
| Net Income ATOP | 972 | 1,598 | 2,341 | 2,288 | 3,143 | 5,085 | 8,778 | 9,986 | 8,874 | 7,842 |
| Year-on-year | 5.1% | 64.4% | 46.5% | -2.3% | 37.4% | 61.8% | 72.6% | 13.8% | -11.1% | -11.6% |
| Net Income Margin | 0.7% | 1.0% | 1.7% | 1.7% | 2.2% | 2.8% | 3.7% | 4.1% | 4.1% | 3.8% |
| (Balance Sheet) | ||||||||||
| Cash & Short-Term Investments | 2,433 | 3,606 | 3,794 | 4,492 | 5,680 | 5,134 | 6,538 | 6,867 | 8,384 | 7,622 |
| Total assets | 73,708 | 86,708 | 78,927 | 77,013 | 91,453 | 108,045 | 143,751 | 162,567 | 156,841 | 162,211 |
| Total Debt | 24,243 | 34,266 | 25,443 | 19,400 | 25,396 | 29,479 | 45,652 | 52,101 | 42,633 | 29,433 |
| Net Debt | 21,810 | 30,660 | 21,649 | 14,908 | 19,716 | 24,345 | 39,114 | 45,234 | 34,249 | 21,811 |
| Total liabilities | 50,780 | 62,306 | 52,516 | 49,870 | 61,799 | 76,025 | 104,753 | 116,377 | 107,837 | 108,455 |
| Total Shareholders’ Equity | 22,925 | 23,837 | 25,805 | 26,476 | 28,965 | 30,953 | 37,848 | 45,042 | 47,860 | 52,830 |
| (Cash Flow) | ||||||||||
| Net Operating Cash Flow | -4,685 | -7,993 | 12,335 | 8,651 | -3,463 | -891 | -12,185 | 301 | 18,915 | 15,684 |
| Capital Expenditure | 166 | 256 | 262 | 544 | 427 | 380 | 270 | 903 | 1,762 | 381 |
| Net Investing Cash Flow | -262 | -896 | -1,708 | -549 | -469 | -155 | -199 | -2,695 | -2,068 | 1,200 |
| Net Financing Cash Flow | 4,739 | 9,869 | -10,504 | -7,479 | 5,079 | 606 | 13,746 | 2,529 | -15,251 | -17,848 |
| Free Cash Flow | -4,818 | -8,133 | 12,111 | 8,163 | -3,811 | -1,240 | -12,361 | -3 | 17,363 | 15,412 |
| (Profitability ) | ||||||||||
| ROA (%) | 1.41 | 1.99 | 2.83 | 2.94 | 3.73 | 5.10 | 6.97 | 6.53 | 5.56 | 4.92 |
| ROE (%) | 4.31 | 6.84 | 9.44 | 8.76 | 11.34 | 16.97 | 25.52 | 24.10 | 19.11 | 15.58 |
| Net Margin (%) | 0.74 | 1.00 | 1.66 | 1.69 | 2.19 | 2.83 | 3.65 | 4.11 | 4.10 | 3.85 |
| Asset Turn | 1.91 | 1.99 | 1.70 | 1.74 | 1.70 | 1.80 | 1.91 | 1.58 | 1.35 | 1.28 |
| Assets/Equity | 3.06 | 3.43 | 3.34 | 2.98 | 3.04 | 3.33 | 3.66 | 3.70 | 3.44 | 3.17 |
| (Per-share) Unit: JPY | ||||||||||
| EPS | 32.2 | 52.7 | 76.9 | 74.8 | 104.1 | 170.2 | 294.8 | 333.5 | 295.7 | 265.9 |
| BPS | 758.6 | 785.0 | 845.4 | 880.4 | 957.1 | 1,042.4 | 1,268.2 | 1,501.1 | 1,624.1 | 1,794.0 |
| Dividend per Share | 20.00 | 22.00 | 31.00 | 30.00 | 41.67 | 68.33 | 118.33 | 135.00 | 119.00 | 107.00 |
| Shares Outstanding (million shares) | 31.34 | 31.34 | 31.34 | 31.34 | 31.34 | 31.34 | 31.34 | 31.34 | 31.34 | 31.34 |
Source: Calculated by Omega Investment based on FactSet’s standard criteria, rounded to the nearest whole number. The number of shares outstanding reflects post-split adjusted figures.