2026-07-09
Home
Japanese

Omega Investment Co., Ltd.
Cosmo Bio (Company note – 2Q update)

| Share price (9/8) | ¥1,211 | Dividend Yield (25/12 CE) | 4.1 % |
| 52weeks high/low | ¥971/1,279 | ROE(24/12) | 3.0 % |
| Avg Vol (3 month) | 5.5 thou shrs | Operating margin (24/12) | 3.2 % |
| Market Cap | ¥7.32 bn | Beta (5Y Monthly) | 0.1 |
| Enterprise Value | ¥3.64 bn | Shares Outstanding | 6.048 mn shrs |
| PER (25/12 CE) | 16.1 X | Listed market | TSE Standard |
| PBR (24/12 act) | 0.8 X |
| Click here for the PDF version of this page |
| PDF version |
Although the first half (cumulative) recorded higher net sales, results fell slightly short of the company’s forecast—expectation for a rebound in the second half through management’s steering.
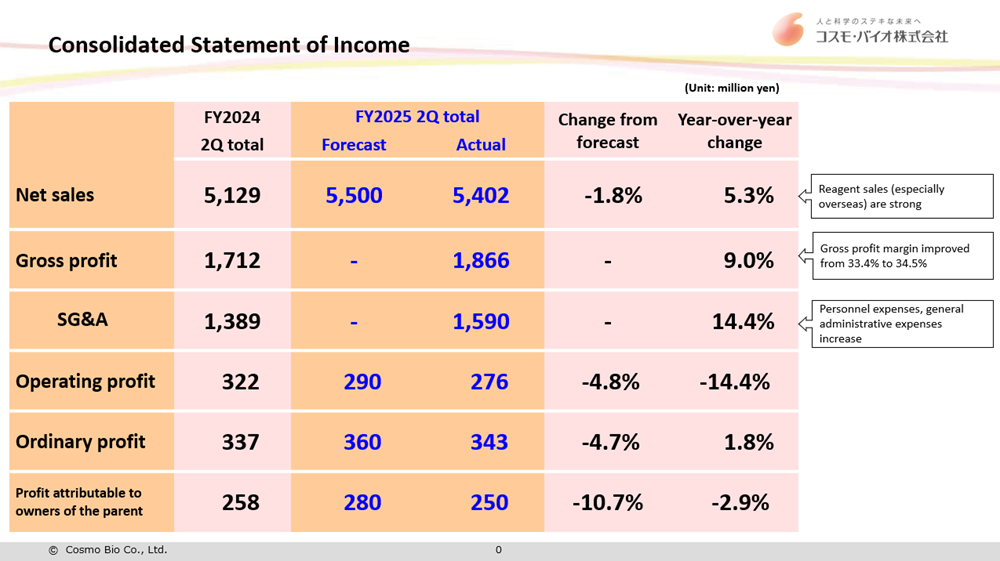
◇ 2Q FY12/2025 financial results highlights
Cosmo Bio’s first-half (interim period) results for FY12/2025, announced on August 5, 2025, recorded higher net sales YoY, but interim net income attributable to owners of the parent declined slightly.
On a cumulative basis, net sales were 5.40 billion yen (up 5% YoY), operating profit was 270 million yen (down 14% YoY), ordinary profit was 340 million yen (up 1% YoY), and interim net income attributable to owners of the parent was 250 million yen (down 2% YoY). The exchange rate was 149 yen/USD (unchanged YoY). Both net sales and profits were slightly below the company’s forecasts, but can be said to be within the expected range.
Net sales experienced growth in reagents, particularly overseas, and equipment sales were also robust. Contract services remained solid. However, the business reorganization of certain customers had an impact, which is one factor contributing to the shortfall of the plan. The gross profit margin also improved to 34.5% (up 1.1 percentage points YoY). This was attributable to the dollar–yen rate remaining flat, the implementation of price revisions, and an improved sales mix. Meanwhile, as planned, personnel expenses and general administrative expenses increased, but operating profit fell short of plan.
◇ Full-year earnings forecasts for FY12/2025
The company left its full-year earnings forecasts unchanged from the start of the fiscal year. Assumptions include an assumed dollar–yen rate of 152 yen/USD for the second half; net sales of 10.70 billion yen (up 6% YoY), operating profit of 490 million yen (up 53% YoY), ordinary profit of 580 million yen (up 59% YoY), and net income attributable to owners of the parent of 430 million yen (up 64% YoY). The full-year dividend per share of 50 yen is also unchanged.
Because second-quarter results came in slightly below assumptions, it is necessary to achieve steady YoY increases in both net sales and profit in the second half. The company states that it will steadily advance its business development toward achieving the plan. In addition, with respect to the U.S. business, it is considering countermeasures because effects such as import tariffs under the Trump administration are also assumed.
◇ Completion of share repurchases
Based on the board of directors’ resolution dated August 5, 2024, the company had been conducting share repurchases of 400,000 shares and 300 million yen equivalent from August 6, 2024, to July 31, 2025. Still, it reached the deadline having acquired a cumulative 205,000 shares for 230 million yen. This amounts to approximately 3.4% of the shares outstanding.
Regrettably, part of the authorization was left unused; however, it is commendable that the company demonstrated restraint in increasing the denominator of ROE, tightened the supply–demand balance of the free float, leading to a steady stock price trend, and provided a certain degree of liquidity.
At present, there has been no disclosure regarding a new share repurchase plan, so there is a desire to see some sort of announcement.
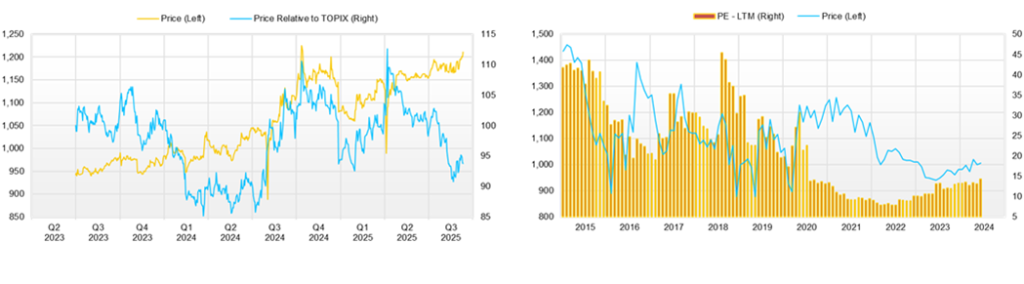
◇ Stock price trend and points of focus going forward
The company’s stock price has been on a gradual upward trend since July 2024. Factors behind this include the pause in the yen depreciation that had progressed over a long period, the promotion of the current three-year plan, and the disclosure, in a form related to this plan, of “Toward realizing management consciousness of capital costs and stock price” (in particular, a stance to strengthen shareholder returns).
The current valuation is a forecast PER of 16x, a PBR of 0.75x, and a forecast dividend yield of 4.2%, and the stock price has limited downside risk. If, in addition, a pathway to globalization of the trading company’s business through the use of IT and expanding revenue sources through the creation of new companies becomes apparent, an ROE of 8% and a PBR of 1x would also come into view.
Points of focus going forward are, for the time being, the dollar–yen exchange rate trend that determines import costs and whether the likelihood of achieving the full-year earnings forecasts increases at the third-quarter earnings announcement. Medium- to long-term points of focus are the globalization of trading company functions and reduction of exchange rate risk, improvement of labor productivity through promotion of digital transformation (DX), Scientist Cube, a matching service for contract services, and the expansion of value-added businesses such as the chicken egg bioreactor business and the peptide manufacturing business. Because the current three-year plan runs through FY2025, expectations are likely to grow regarding the direction of the next plan (including capital policies such as share repurchases).
Company profile
Cosmo Bio Co., Ltd. is a bio-focused trading company that upholds the objective of “contributing to the advancement of life sciences.” It is one of the major providers of reagents for life science research, supplying as many as 12 million items from about 500 manufacturers worldwide. In recent years, it has expanded globally, advancing the functions of trading companies, launching its own contract services, and entering proprietary manufacturing and sales businesses. Expectations are placed on these to contribute to earnings, improve capital efficiency, and raise PBR.
Key financial data
| Unit: million yen | 2020/12 | 2021/12 | 2022/12 | 2023/12 | 2024/12 | 2025/12 CE |
| Sales | 8,092 | 9,231 | 9,553 | 9,340 | 10,037 | 10,700 |
| EBIT (Operating Income) | 753 | 1,050 | 817 | 521 | 319 | 490 |
| Pretax Income | 1,008 | 1,099 | 790 | 653 | 369 | 580 |
| Net Profit Attributable to Owner of Parent | 674 | 737 | 517 | 442 | 262 | 430 |
| Cash & Short-Term Investments | 3,259 | 3,555 | 3,036 | 3,025 | 2,693 | |
| Total assets | 9,640 | 10,072 | 10,313 | 10,872 | 11,723 | |
| Total Debt | 20 | 28 | 27 | 25 | 23 | |
| Net Debt | -3,239 | -3,527 | -3,009 | -3,000 | -2,670 | |
| Total liabilities | 1,776 | 1,750 | 1,693 | 1,844 | 2,166 | |
| Total Shareholders’ Equity | 7,358 | 7,787 | 8,052 | 8,445 | 8,968 | |
| Net Operating Cash Flow | 803 | 648 | 306 | 744 | 241 | |
| Capital Expenditure | 76 | 156 | 119 | 120 | 319 | |
| Net Investing Cash Flow | 42 | -145 | -313 | -766 | -217 | |
| Net Financing Cash Flow | -97 | -420 | -236 | -201 | -479 | |
| Free Cash Flow | 767 | 617 | 251 | 677 | 25 | |
| ROA (%) | 7.27 | 7.48 | 5.07 | 4.17 | 2.32 | |
| ROE (%) | 9.49 | 9.73 | 6.53 | 5.36 | 3.01 | |
| EPS (Yen) | 113.7 | 126.9 | 89.1 | 75.8 | 45.0 | 75.5 |
| BPS (Yen) | 1,241.2 | 1,344.5 | 1,385.1 | 1,447.2 | 1,565.0 | |
| Dividend per Share (Yen) | 34.00 | 36.00 | 36.00 | 30.00 | 50.00 | 50.00 |
| Shares Outstanding (Million shrs) | 6.05 | 6.05 | 6.05 | 6.05 | 6.05 |
Source: Omega Investment from company data, rounded to the nearest whole number.
Share price
Key points for financial results
Source: Company materials

Source: Company materials
Financial data (quarterly basis)
| Unit: million yen | 2023/12 | 2024/12 | 2025/12 | ||||||
| 2Q | 3Q | 4Q | 1Q | 2Q | 3Q | 4Q | 1Q | 2Q | |
| (Income Statement) | |||||||||
| Sales | 1,999 | 2,050 | 2,463 | 2,943 | 2,186 | 2,280 | 2,628 | 3,093 | 2,309 |
| Year-on-year | -3.1% | 1.7% | 1.5% | 4.1% | 9.4% | 11.2% | 6.7% | 5.1% | 5.6% |
| Cost of Goods Sold (COGS) | 1,273 | 1,350 | 1,678 | 1,956 | 1,460 | 1,522 | 1,770 | 2,034 | 1,502 |
| Gross Income | 726 | 700 | 785 | 987 | 726 | 758 | 858 | 1,059 | 807 |
| Gross Income Margin | 36.3% | 34.1% | 31.9% | 33.5% | 33.2% | 33.2% | 32.6% | 34.2% | 35.0% |
| SG&A Expense | 668 | 711 | 712 | 681 | 708 | 713 | 908 | 785 | 805 |
| EBIT (Operating Income) | 58 | -11 | 73 | 306 | 18 | 45 | -50 | 274 | 2 |
| Year-on-year | 23.4% | -114.5% | -36.0% | -23.7% | -69.0% | -509.1% | -168.5% | -10.5% | -88.9% |
| Operating Income Margin | 2.9% | -0.5% | 3.0% | 10.4% | 0.8% | 2.0% | -1.9% | 8.9% | 0.1% |
| EBITDA | 94 | 28 | 112 | 336 | 50 | 79 | -10 | 308 | 40 |
| Pretax Income | 136 | 2 | 99 | 353 | 37 | 48 | -69 | 321 | 50 |
| Consolidated Net Income | 98 | 1 | 83 | 240 | 27 | 34 | -32 | 220 | 35 |
| Minority Interest | 1 | -5 | 8 | 10 | -2 | 2 | -3 | 7 | -2 |
| Net Income ATOP | 97 | 5 | 76 | 230 | 28 | 33 | -29 | 212 | 38 |
| Year-on-year | 136.6% | -89.4% | 20.6% | -12.9% | -71.1% | 560.0% | -138.2% | -7.8% | 35.7% |
| Net Income Margin | 4.9% | 0.2% | 3.1% | 7.8% | 1.3% | 1.4% | -1.1% | 6.9% | 1.6% |
| (Balance Sheet) | |||||||||
| Cash & Short-Term Investments | 3,852 | 3,637 | 3,025 | 2,813 | 3,224 | 3,044 | 2,693 | 2,497 | 3,192 |
| Total assets | 10,852 | 10,773 | 10,872 | 11,594 | 11,739 | 11,333 | 11,723 | 11,516 | 11,790 |
| Total Debt | 228 | 219 | 25 | 316 | 418 | 370 | 23 | 345 | 490 |
| Net Debt | -3,624 | -3,418 | -3,000 | -2,497 | -2,806 | -2,674 | -2,670 | -2,152 | -2,702 |
| Total liabilities | 1,762 | 1,772 | 1,844 | 2,101 | 1,953 | 1,853 | 2,166 | 2,160 | 2,114 |
| Total Shareholders’ Equity | 8,509 | 8,426 | 8,445 | 8,903 | 9,197 | 8,889 | 8,968 | 8,763 | 9,084 |
| (Profitability %) | |||||||||
| ROA | 4.44 | 4.12 | 4.17 | 3.66 | 3.01 | 3.31 | 2.32 | 2.12 | 2.15 |
| ROE | 5.69 | 5.24 | 5.36 | 4.76 | 3.84 | 4.23 | 3.01 | 2.77 | 2.77 |
| (Per-share) Unit: JPY | |||||||||
| EPS | 16.6 | 0.9 | 13.0 | 39.4 | 4.8 | 5.7 | -5.1 | 37.1 | 6.7 |
| BPS | 1,458.0 | 1,443.9 | 1,447.2 | 1,525.8 | 1,569.7 | 1,532.0 | 1,565.0 | 1,536.8 | 1,597.1 |
| Dividend per Share | 14.00 | 0.00 | 16.00 | 0.00 | 14.00 | 0.00 | 36.00 | 0.00 | 25.00 |
| Shares Outstanding(million shrs) | 6.05 | 6.05 | 6.05 | 6.05 | 6.05 | 6.05 | 6.05 | 6.05 | 6.05 |
Source: Omega Investment from company materials
Financial data (full-year basis)
| Unit: million yen | 2015/12 | 2016/12 | 2017/12 | 2018/12 | 2019/12 | 2020/12 | 2021/12 | 2022/12 | 2023/12 | 2024/12 |
| (Income Statement) | ||||||||||
| Sales | 7,357 | 7,427 | 7,068 | 7,261 | 7,590 | 8,092 | 9,231 | 9,553 | 9,340 | 10,037 |
| Year-on-year | 1.7% | 1.0% | -4.8% | 2.7% | 4.5% | 6.6% | 14.1% | 3.5% | -2.2% | 7.5% |
| Cost of Goods Sold | 4,976 | 4,655 | 4,535 | 4,607 | 4,710 | 4,940 | 5,572 | 6,112 | 6,090 | 6,708 |
| Gross Income | 2,381 | 2,772 | 2,533 | 2,654 | 2,880 | 3,152 | 3,659 | 3,441 | 3,250 | 3,329 |
| Gross Income Margin | 32.4% | 37.3% | 35.8% | 36.6% | 37.9% | 39.0% | 39.6% | 36.0% | 34.8% | 33.2% |
| SG&A Expense | 2,181 | 2,257 | 2,339 | 2,330 | 2,474 | 2,399 | 2,609 | 2,624 | 2,729 | 3,010 |
| EBIT (Operating Income) | 200 | 515 | 194 | 324 | 406 | 753 | 1,050 | 817 | 521 | 319 |
| Year-on-year | 23.5% | 157.5% | -62.3% | 67.0% | 25.3% | 85.5% | 39.4% | -22.2% | -36.2% | -38.8% |
| Operating Income Margin | 2.7% | 6.9% | 2.7% | 4.5% | 5.3% | 9.3% | 11.4% | 8.6% | 5.6% | 3.2% |
| EBITDA | 279 | 600 | 350 | 507 | 613 | 928 | 1,216 | 958 | 669 | 455 |
| Pretax Income | 407 | 456 | 400 | 403 | 388 | 1,008 | 1,099 | 790 | 653 | 369 |
| Consolidated Net Income | 249 | 276 | 250 | 278 | 246 | 701 | 768 | 552 | 461 | 269 |
| Minority Interest | 19 | 22 | 12 | 17 | 8 | 27 | 31 | 35 | 19 | 7 |
| Net Income ATOP | 230 | 254 | 237 | 260 | 237 | 674 | 737 | 517 | 442 | 262 |
| Year-on-year | 14.4% | 10.4% | -6.7% | 9.7% | -8.8% | 184.4% | 9.3% | -29.9% | -14.5% | -40.7% |
| Net Income Margin | 3.1% | 3.4% | 3.4% | 3.6% | 3.1% | 8.3% | 8.0% | 5.4% | 4.7% | 2.6% |
| (Balance Sheet) | ||||||||||
| Cash & Short-Term Investments | 1,498 | 1,948 | 1,483 | 2,268 | 2,516 | 3,259 | 3,555 | 3,036 | 3,025 | 2,693 |
| Total assets | 7,790 | 7,934 | 8,126 | 8,501 | 8,890 | 9,640 | 10,072 | 10,313 | 10,872 | 11,723 |
| Total Debt | 20 | 20 | 20 | 20 | 20 | 20 | 28 | 27 | 25 | 23 |
| Net Debt | -1,478 | -1,928 | -1,463 | -2,248 | -2,496 | -3,239 | -3,527 | -3,009 | -3,000 | -2,670 |
| Total liabilities | 1,412 | 1,350 | 1,286 | 1,445 | 1,566 | 1,776 | 1,750 | 1,693 | 1,844 | 2,166 |
| Total Sharehjolders’ Equity | 5,951 | 6,135 | 6,381 | 6,581 | 6,843 | 7,358 | 7,787 | 8,052 | 8,445 | 8,968 |
| (Cash Flow) | ||||||||||
| Net Operating Cash Flow | 129 | 573 | 294 | 909 | 569 | 803 | 648 | 306 | 744 | 241 |
| Capital Expenditure | 175 | 252 | 546 | 152 | 171 | 76 | 156 | 119 | 120 | 319 |
| Net Investing Cash Flow | -263 | 99 | -440 | -186 | -135 | 42 | -145 | -313 | -766 | -217 |
| Net Financing Cash Flow | -151 | -107 | -109 | -85 | -85 | -97 | -420 | -236 | -201 | -479 |
| Free Cash Flow | 80 | 444 | -185 | 858 | 428 | 767 | 617 | 251 | 677 | 25 |
| (Profitability %) | ||||||||||
| ROA | 2.88 | 3.23 | 2.96 | 3.14 | 2.74 | 7.27 | 7.48 | 5.07 | 4.17 | 2.32 |
| ROE | 3.83 | 4.20 | 3.80 | 4.03 | 3.55 | 9.49 | 9.73 | 6.53 | 5.36 | 3.01 |
| Net profit margin | 3.13 | 3.42 | 3.37 | 3.59 | 3.14 | 8.33 | 7.98 | 5.41 | 4.73 | 2.61 |
| Asset turnover ratio | 0.92 | 0.94 | 0.88 | 0.87 | 0.87 | 0.87 | 0.94 | 0.94 | 0.88 | 0.89 |
| Financial leverage | 1.33 | 1.30 | 1.28 | 1.28 | 1.30 | 1.30 | 1.30 | 1.29 | 1.28 | 1.30 |
| (Per-share) Unit: JPY | ||||||||||
| EPS | 38.8 | 42.8 | 40.0 | 43.9 | 40.0 | 113.7 | 126.9 | 89.1 | 75.8 | 45.0 |
| BPS | 1,003.9 | 1,034.9 | 1,076.4 | 1,110.2 | 1,154.4 | 1,241.2 | 1,344.5 | 1,385.1 | 1,447.2 | 1,565.0 |
| Dividend per Share | 16.00 | 18.00 | 14.00 | 14.00 | 14.00 | 34.00 | 36.00 | 36.00 | 30.00 | 50.00 |
| Shares Outstanding(million shrs) | 6.05 | 6.05 | 6.05 | 6.05 | 6.05 | 6.05 | 6.05 | 6.05 | 6.05 | 6.05 |
Source: Omega Investment from company materials