2026-06-19
Home
Japanese

Omega Investment Co., Ltd.
KENKO Mayonnaise (Price Discovery)
| Share price (6/24) | ¥1,977 | Dividend Yield (27/3 CE) | 3.5 % |
| 52weeks high/low | ¥1,693/2,365 | ROE(26/3 act) | 7.2 % |
| Avg Vol (3 month) | 32.5 thou shrs | Operating margin (26/3 act) | 4.5 % |
| Market Cap | ¥32.57 bn | Beta (5Y Monthly) | 0.01 |
| Enterprise Value | ¥18.27 bn | Shares Outstanding | 16.476 mn shrs |
| PER (27/3 CE) | 10.0 X | Listed market | TSE Prime |
| PBR (26/3 act) | 0.7 X |
| Click here for the PDF version of this page |
| PDF version |
Although earnings will undergo a temporary adjustment phase, this is a stage at which building a position in a portfolio should be considered over a medium- to long-term perspective, in light of the Company’s business restructuring and low valuation.
Investment conclusion
The investment stance toward KENKO Mayonnaise Co., Ltd. (hereinafter, the “Company”) is that this is a stage at which inclusion in a portfolio should be considered from a medium- to long-term perspective. In FY 3/2026, net sales were 92,354 million yen, operating profit was 4,155 million yen, and profit attributable to owners of the parent was 2,926 million yen, with sales posting a slight increase while profit declined. Although price increases had a certain effect, investments for the future, including the timing gap in price increases, the impact of persistently high egg market prices, increases in major raw material costs and SG&A expenses, and expenses for the relocation of Tokyo Headquarters, weighed on profit. For FY 3/2027, the Company forecasts net sales of 97,000 million yen, operating profit of 4,000 million yen, and profit attributable to owners of the parent of 2,840 million yen. It plans to prioritize rebuilding its earnings structure and growth investments over short-term profit recovery.
On the other hand, the valuation factored into the current share price is quite conservative. Forecast PER is 10.7 times, actual PBR is 0.67 times, actual ROE is 7.18%, forecast EPS is 193.09 yen, and the forecast dividend is 70 yen. Against a market capitalization of 32.0 billion yen, net cash is 10.1 billion yen, and the effective forecast PER after deducting net cash is approximately 7.32 times. Considering stable demand as a food manufacturer, its business foundations in Salads and Delicatessen, such as potato salads for commercial use, Mayonnaise and Dressings, Processed Egg products, and Delicatessen-related Business, which sells fresh salads to mass retailers, as well as its solid financial position, the current share price valuation appears quite restrained.
There are three points in the investment stance. First, the Company has restored its earnings power after bottoming in FY 3/2023. After the net profit margin rose to the 4.0% range in FY 3/2017, the combination of raw material costs, logistics costs, personnel expenses, capital expenditure burden, the COVID-19 pandemic, increases in egg market prices, and delays in price increases caused the net profit margin to decline to around 0.6% in FY 3/2023. However, from FY 3/2024 onward, price increases, improvement in product mix, cost management, and review of the business portfolio took effect, and the profit margin recovered sharply. FY 3/2026 saw a decline in profit, but this should be viewed as a temporary adjustment as the Company absorbs higher raw material costs and upfront expenses, not as a return to a structurally low-profitability business model.
Second, the Company reviewed its Medium- to Long-Term Management Plan, “KENKO Vision 2035,” and outlined a transition toward becoming a “Global Food Solution Company.” Specifically, it has set forth sales expansion in existing businesses through “customer-in” and “co-creation,” optimization of Salad Cafe and cooking classes, an increase in the overseas sales ratio, evolution from DX to BX, the addition of an IT strategy, and a transition to “cash-based management.” The Company raised its FY 2035 target for consolidated net sales from 125.0 billion yen to 200.0 billion yen. It adopted the EBITDA margin and ROIC as profitability indicators, and the net D/E ratio as a soundness indicator. This is an expression of its intention to shift from a conventional commercial-use food manufacturer to a food solution company that combines products, services, overseas expansion, and IT, starting from customers’ issues.
Third, improvement in capital policy has begun. The Company has positioned shareholder returns as the most important management issue and indicated a policy of using DOE as an indicator. It plans to raise its DOE targets in stages: to 2.5% or more from FY 2025, 3.5% or more in FY 2031, and 4.0% or more in FY 2035. The annual dividend was 67 yen in FY 3/2026 and is forecast at 70 yen for FY 3/2027. In addition, in FY 3/2026, it also implemented expenditures of 1,034 million yen for the purchase of treasury shares. As a company with a large net cash position, the allocation among dividends, share buybacks, growth investments, overseas expansion, and facilities and IT investments will have a major impact on the share price valuation going forward.
At present, the Company’s shares are not priced as a stock that has fully factored in earnings recovery, but are instead valued as an undervalued stock, with caution about higher raw material costs and slowing growth remaining strong. From a medium- to long-term perspective, as renewed improvement in the profit margin, recovery in ROIC, increases in DOE execution, and effective use of cash are confirmed, a re-rating of the share price valuation should become easier to expect. In the short term, the forecast of lower profits in FY 3/2027 may cap upside, but downside risk is likely to be mitigated by net cash, dividends, and a PBR of 0.67 times. Therefore, rather than focusing solely on short-term earnings momentum, emphasis should be placed on how the Company converts the cash-generation capacity resulting from business restructuring into corporate value.
◇Highlights of the results for FY 3/2026
Increase in sales but decrease in profit. Price increases had an effect, but persistently high egg market prices and upfront expenses weighed on profit.
Full-year results for FY 3/2026 were net sales of 92,354 million yen, operating profit of 4,155 million yen, ordinary profit of 4,329 million yen, and profit attributable to owners of parent of 2,926 million yen. Net sales secured a slight increase, up 0.7% YoY, but operating profit decreased 14.3% YoY, ordinary profit decreased 13.4% YoY, and net profit decreased 16.4% YoY. In addition to the reactionary decline following the significant profit recovery in the previous fiscal year, raw material prices, egg market prices, logistics costs, personnel expenses, and relocation expenses for the Tokyo Headquarters overlapped, resulting in a decline in the profit margin.
Regarding sales, the Company states that fresh salads in Delicatessen-related Business decreased, but Mayonnaise and Dressings and potato salad grew. On the profit side, although price increases had a certain effect, the timing gap in price increases, rising raw material costs due to persistently high egg market prices, higher SG&A expenses, and relocation expenses for the Tokyo Headquarters were factors behind the decline in profit. These results show that demand collapsed less than the pass-through of higher raw material costs, and that increased expenses and profitability corrections are still in progress.
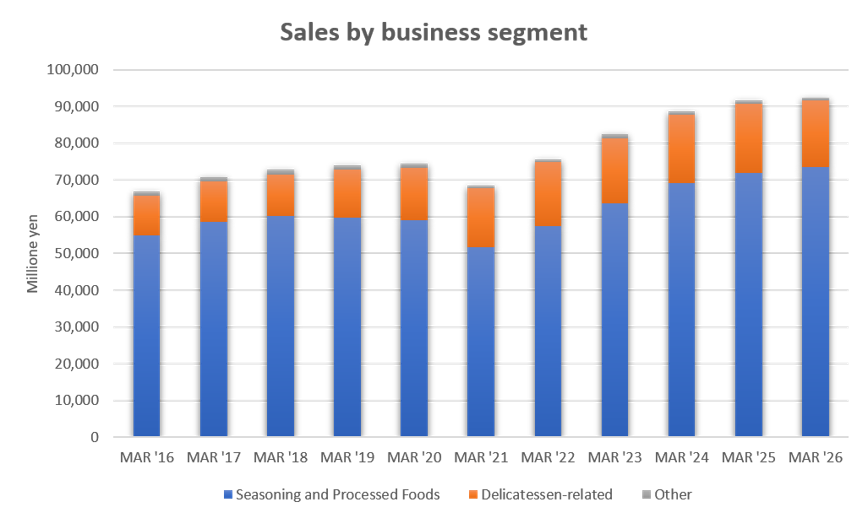
By segment, net sales in the Seasoning and Processed Foods Business were 73,434 million yen, up 2.2% YoY, and segment profit was 3,094 million yen, down 20.6% YoY. In Salads and Delicatessen, potato salad in 1kg formats and small formats grew for restaurants, mass retailers, and convenience stores. Processed Egg products were generally in line with the previous fiscal year, although egg salad, boiled eggs, and Kinshi egg increased. In Mayonnaise and Dressings, 10 kg and 1 kg formats increased for bread and restaurants, and restaurant sauces also increased. Basic top-line demand was maintained, but higher raw material costs, including eggs, and increased expenses reduced profit.
In the Delicatessen-related Business, net sales were 18,180 million yen, down 4.1% YoY, and segment profit was 1,004 million yen, up 16.4% YoY. Although sales declined due to factors including in-house production by customers, profit increased due to the expansion of product categories, the development of high-value-added products, and the effect of price increases. Although this business has lower sales volume than the Seasoning and Processed Foods Business, it is important because it indicates room for improvement in profitability. The direction of securing profit through price increases, higher added value, and review of low-profitability products, rather than pursuing volume, was confirmed.
◇View on long-term performance
Profitability declined after peaking in FY 3/2017, and restructuring has progressed since bottoming in FY 3/2023
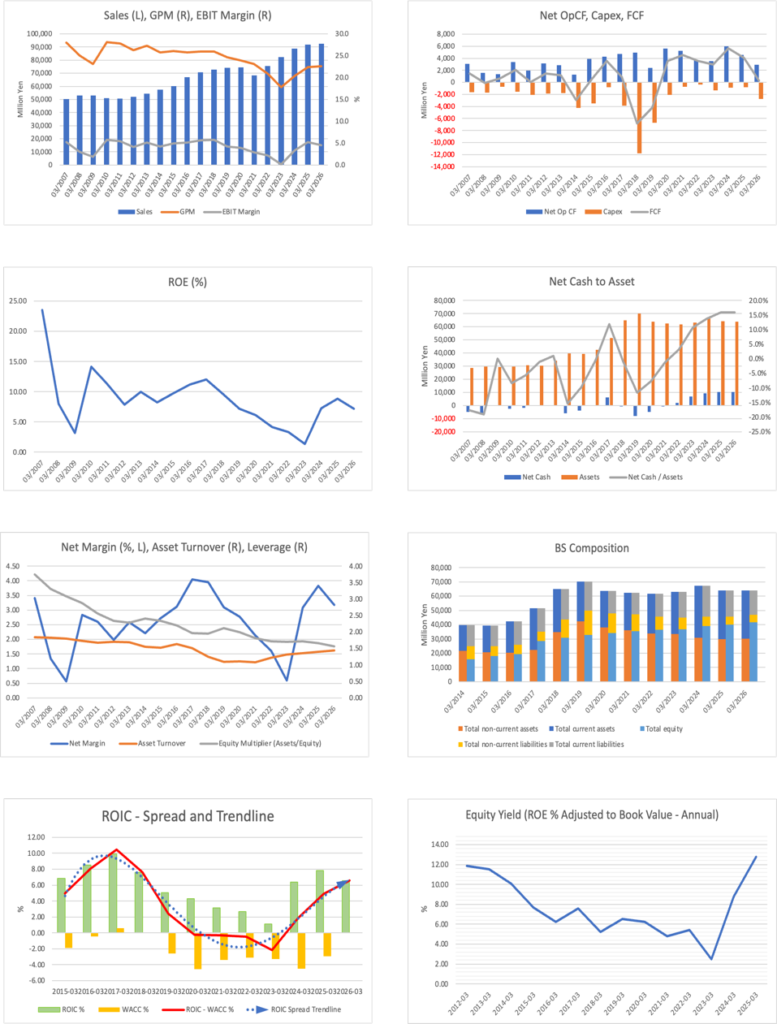
In looking at the Company’s long-term performance, the important point is that sales have not collapsed significantly, while the profit margin has fluctuated greatly. Net sales expanded from 70,812 million yen in FY 3/2017 to 92,354 million yen in FY 3/2026. However, the net profit margin peaked at 4.05% in FY 3/2017, then declined to 3.95% in FY 3/2018, 3.10% in FY 3/2019, 2.76% in FY 3/2020, 2.13% in FY 3/2021, and 1.60% in FY 3/2022, before falling to 0.59% in FY 3/2023. It then sharply improved to 3.08% in FY 3/2024, 3.82% in FY 3/2025, and 3.17% in FY 3/2026. This clearly shows that this is a company whose share price valuation is not re-rated by sales growth alone, and that the quality of the profit margin is important.
The reasons the profit margin was lost after FY 3/2017 should be viewed as a combination of multiple factors. First, increases in raw material prices, particularly cost increases for eggs, vegetables, oils and fats, and packaging materials, pressured the gross profit margin of the commercial-use food manufacturer. Second, price increases lagged increases in fixed costs, including factories, logistics, and personnel expenses. Food manufacturers have long-standing business relationships with customers, and especially in commercial use, time lags in price increases tend to occur. Third, the burden of capital expenditures and the development of production systems increased, with depreciation and fixed costs taking precedence. Fourth, during the COVID-19 pandemic, the demand mix, including restaurants, ready-made meals, and school lunches, changed, and sales channels and the product mix, with good profitability, temporarily deteriorated. These factors overlapped, and a phase continued in which the profit margin declined even as sales volume was maintained.
The background to the sharp improvement after bottoming in FY 3/2023 was the penetration of price increases, a review of the product and customer mix, a response to low-profitability areas, and strengthened cost management. The sharp recovery in operating profit in FY 3/2024 and FY 3/2025 shows that the Company’s business foundation was not impaired, but rather that its structure enabled it to regain profitability through price pass-through and cost correction. The fact that profit declined again in FY 3/2026 warrants attention, but the earnings level is less critical than in FY 3/2023. Rather, the fact that the Company has once again set “cash-based management,” ROIC, and EBITDA margin as management indicators during the business restructuring can be evaluated as a redesign of management in response to the past decline in the profit margin.
◇Forecast for FY 3/2027
Plan for increased sales and decreased profit. A conservative plan that factors in growth, investment, and the timing gap in price increases
The Company’s forecast for FY 3/2027 is net sales of 97,000 million yen, operating profit of 4,000 million yen, ordinary profit of 4,150 million yen, and profit attributable to owners of parent of 2,840 million yen. YoY, net sales are forecast to increase by 5.0%, operating profit to decrease by 3.7%, ordinary profit to decrease by 4.1%, and net profit to decrease by 3.0%. The Company continues to operate in an uncertain environment, including geopolitical risks, energy prices, U.S. policies, and foreign exchange trends, and its policy is to promote profitability, productivity improvements, and fundamental reforms in line with the review of the Medium- to Long-Term Management Plan.
This plan is not so much a plan to significantly increase short-term profits as one that maintains an upward sales trend while continuing business restructuring and growth investments. Because operating profit is forecast to decline, the share price is likely to continue to face heavy downside pressure in the short term. However, compared with the operating profit of 4,155 million yen in FY 3/2026, the forecast for FY 3/2027 is 4,000 million yen, so the decline in profit is not large. The plan can be viewed as conservatively factoring in increases in raw material prices and personnel expenses and cautiously incorporating the effects of price increases and productivity improvement.
Factors incorporated into the Company plan include persistently high raw material prices, increases in SG&A and personnel expenses, growth investments, and the timing gap in price increases. On the other hand, upside factors that may not be sufficiently incorporated include a settlement of egg market prices, further penetration of price increases, increases in sales volume of potato salad, mayonnaise, and Dressings, expansion of high-value-added products in Delicatessen-related Business, and progress in overseas expansion. Downside factors are renewed increases in raw material prices, delays in price increases, slowdown in demand from restaurants, CVS, and mass retailers, expansion of in-house production by customers, and increases in fixed costs, including expenses related to the relocation of equipment and the Research Department and Development Department of the Business Development Division and the Quality Assurance Office to Shinkiba.
Monitoring items to confirm in subsequent results are, first, the gross profit margin. Whether price increases are taking effect beyond higher raw material costs will be the most important point. Second is the segment profit margin of the Seasoning and Processed Foods Business. If the structure in which sales increase but profit does not grow remains, the share price valuation will be difficult to re-rate. Third is the continuation of profitability improvement in the Delicatessen-related Business. If the trend of lower sales but higher profits continues, this can be evaluated as a qualitative improvement in the business portfolio. Fourth are operating cash flow and inventories. In FY 3/2026, operating cash flow decreased to 2,940 million yen, and an increase in inventories reduced cash. As the Company advocates cash-based management, the recovery of cash generation capacity, not only profit, should be confirmed.
◇Balance sheet, net cash, and capital policy
The focus is on whether the Company can shift from defensive finances to capital allocation that enhances corporate value.
The Company’s finances are strong. At the end of FY 3/2026, total assets were 63,922 million yen, net assets were 41,563 million yen, and the equity ratio was 65.0%. Cash and deposits totaled 13,487 million yen; net cash after deducting interest-bearing debt was approximately 10.1 billion yen, accounting for a large proportion of the market capitalization of 32.0 billion yen. Holding a large amount of cash was reasonable during the business restructuring process. Considering higher raw material costs, capital expenditures, delays in price increases, and uncertainty in the external environment, financial capacity became a source of business continuity and negotiating power.
However, now that earnings have stabilized and the Company itself has entered a stage in which it advocates a transition to “cash-based management,” the next issue is how cash is used. Merely holding a large amount of net cash makes it difficult to resolve the low valuation of PBR 0.67 times. With ROE remaining at 7.2%, excessive cash accumulation will instead make capital efficiency appear low. The Company has indicated a gradual increase in DOE targets and a forecast annual dividend of 70 yen, thereby taking a step toward improving shareholder returns. However, given the net cash balance of 10.1 billion yen, an improvement in the dividend policy alone cannot be considered sufficient.
The point management should show, going forward, is the order of priority for executing growth investments, overseas expansion, IT and BX investments, capital expenditures, dividends, and share buybacks. The Company has indicated a policy of raising its overseas sales ratio to 30% in FY 2035, and there is room for growth investment. On the other hand, if the current share price is well below PBR 1.0 and the PER after net cash adjustment is in the approximately 7-times range, share buybacks will also be an effective means of improving capital efficiency. The Company’s expenditure of 1,034 million yen on the purchase of treasury shares in FY 3/2026 can be evaluated, but going forward, the focus will be on how much continuity it provides to this as a capital allocation policy, rather than implementing it on a case-by-case basis.
◇Share price trends and valuation
The share price remains sluggish, but the effective PER and equity yield are at attractive levels.
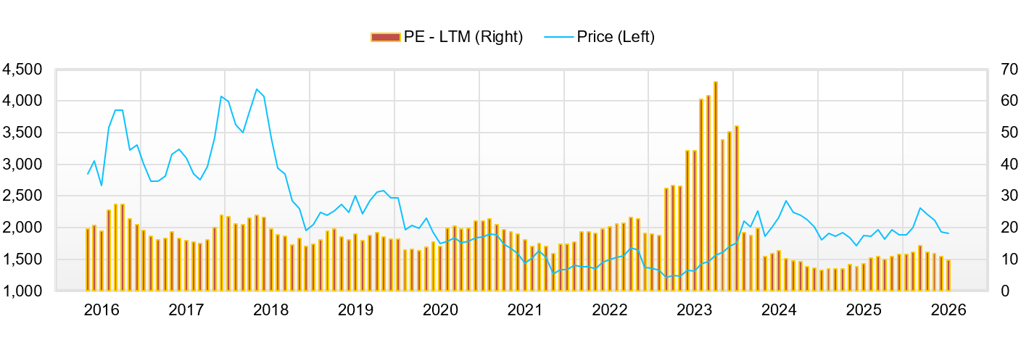
The Company’s shares have remained sluggish since 2022. Even year-to-date in 2026, despite a relatively strong market environment for the Japanese equity market, the Company’s shares declined significantly. The background is that, even though business performance was relatively solid, investors lacked sufficient confidence in renewed profit growth. Profit recovered significantly in FY 3/2025, but profit declined in FY 3/2026, and the Company’s forecast also calls for lower operating profit in FY 3/2027. From the market’s perspective, the profit recovery from FY 3/2024 to FY 3/2025 appears to have run its course, and the next profit growth driver remains difficult to confirm in the figures.
In addition, while the Company’s stability as a food manufacturer is evaluated, the structure in which higher raw material costs, egg market prices, and the timing gap in price increases affect the profit margin is difficult for investors to read. The decline in PBR to 0.67 times indicates undervaluation relative to asset value and suggests that the market views the capital efficiency of ROE in the 7% range as insufficient. Furthermore, with a market capitalization of around 32.0 billion yen, the Company is not large, and, from a liquidity standpoint, it is difficult for institutional investors managing large funds to include it in their portfolios. The fact that capital does not flow in immediately, even when the share price appears undervalued, has led to a delay in valuation correction.
On the other hand, the current valuation level is attractive. The forecast PER of 10.7 times is not high for a stable earnings company in the food sector. Deducting net cash of 10.1 billion yen from the market capitalization of 32.0 billion yen results in an enterprise value of approximately 21.9 billion yen. When the forecast PER is adjusted after deducting net cash, it is 10.7 × (1 – 10.1 billion yen / 32.0 billion yen) = approximately 7.32 times. This is a considerably low valuation given the Company’s business foundation, financial strength, and dividend level.
Attention should also be paid to equity yield. Earnings power improved sharply after bottoming in FY 3/2023, and, combined with the low PBR, the equity yield is at an attractive level above 10%. This means that the yield on profit the Company generates relative to the market price is high, suggesting that the share price has not fully factored in earnings recovery. However, a high equity yield alone does not result in a re-rating. What is important is whether that earnings yield is sustainable, and whether capital, including surplus cash, is used to enhance shareholder value. If the profit margin declines again, equity yield will decline, and if cash remains stagnant, PBR will be difficult to raise. Therefore, the current high equity yield is the starting point for investment appeal, and what is needed next is stabilization of the profit margin and clarification of capital allocation.
Regarding the near-term share price, downside is likely to be limited. A PBR of 0.67 times, a high net cash ratio, a dividend of 67 yen, and a forecast of 70 yen for the next fiscal year are support factors. On the other hand, the upside has conditions. First, the FY 3/2027 plan must be conservative, and profit must progress above the plan each quarter. Second, the effect of price increases in response to higher raw material costs must be confirmed as an improvement in the gross profit margin. Third, in addition to DOE increases, policies for share buybacks and growth investment must be presented more quantitatively. If these come together, the current low PBR, low effective PER, and high equity yield are likely to function as factors for revaluation.
In summary, the Company is not only a low-PBR food manufacturer that has emerged from a crisis, but is also at a stage where the question is how far it can use the profit margin restored through business restructuring and its large net cash to realize the next growth and improve capital efficiency. In the short term, higher raw material costs and the forecast of lower profit will weigh on the share price, but over the medium to long term, the establishment of price increases, profitability improvement in Delicatessen-related Business, overseas expansion, BX and IT strategy, DOE increases, and progress in capital allocation, including share buybacks, will be factors aimed at a re-rating of the share price valuation. The Company’s shares at this stage should be positioned as a stock for which inclusion should be considered over a medium- to long-term perspective, while confirming the sustainability of earnings recovery and the specific use of cash.
Key stock price data
Company profile
◇Advancing a transition to a Global Food Solution Company that solves customers’ issues, with commercial-use foods at the core
KENKO Mayonnaise is a food manufacturer with commercial-use foods at its core. Its businesses consist of the Seasoning and Processed Foods Business and the Delicatessen-related Business. In the Seasoning and Processed Foods Business, the Company manufactures and sells Salads and Delicatessen, Processed Egg products, Mayonnaise and Dressings, sauces, and other products, and has a wide range of commercial-use customers, including restaurants, mass retailers, convenience stores, bread, and school lunches. In the Delicatessen-related Business, it manufactures and sells fresh salads and other delicatessen products, and is expanding its product categories and developing high-value-added products. The Company’s strength lies in its ability to provide not only single-item food manufacturing but also comprehensive support for customers’ product development, menu development, stable supply, quality control, and response to commercial-use needs. Over the medium- to long-term, it will review “KENKO Vision 2035” and set out a transition toward becoming a “Global Food Solution Company.” The Company has set forth sales expansion in existing businesses through “customer-in” and “co-creation,” an increase in the overseas sales ratio, the evolution from DX to BX, the strengthening of the IT strategy, and the promotion of cash-based management. It is seeking to change from a conventional commercial-use food manufacturer into a food solutions company that combines products, services, overseas expansion, IT, and productivity improvements, starting with customers’ issues.
Key financial data
| Unit: million yen | 2022/3 | 2023/3 | 2024/3 | 2025/3 | 2026/3 | 2027/3 CE |
| Sales | 75,647 | 82,363 | 88,724 | 91,703 | 92,354 | 97,000 |
| EBIT (Operating Income) | 1,617 | 106 | 2,950 | 4,846 | 4,155 | 4,000 |
| Pretax Income | 1,754 | 648 | 3,767 | 5,142 | 4,239 | |
| Net Profit Attributable to Owner of Parent | 1,211 | 485 | 2,735 | 3,503 | 2,926 | 2,840 |
| Cash & Short-Term Investments | 12,441 | 12,289 | 15,729 | 15,729 | 13,487 | |
| Total assets | 61,760 | 63,011 | 67,370 | 64,080 | 63,922 | |
| Total Debt | 10,472 | 5,503 | 6,447 | 5,509 | 3,293 | |
| Net Debt | -1,969 | -6,786 | -9,282 | -10,220 | -10,194 | |
| Total liabilities | 25,218 | 26,214 | 28,386 | 24,114 | 22,353 | |
| Total Shareholders’ Equity | 36,539 | 36,794 | 38,978 | 39,963 | 41,563 | |
| Net Operating Cash Flow | 3,757 | 3,526 | 5,957 | 4,594 | 2,940 | |
| Capital Expenditure | 398 | 1,304 | 913 | 822 | 2,774 | |
| Net Investing Cash Flow | -419 | -856 | -239 | -1,062 | -2,706 | |
| Net Financing Cash Flow | -3,281 | -2,822 | -2,277 | -3,531 | -2,475 | |
| Free Cash Flow | 3,531 | 2,941 | 5,680 | 4,070 | 280 | |
| ROA (%) | 1.95 | 0.78 | 4.20 | 5.33 | 4.57 | |
| ROE (%) | 3.36 | 1.32 | 7.22 | 8.87 | 7.18 | |
| EPS (Yen) | 74.3 | 29.8 | 169.9 | 221.6 | 198.9 | 197.3 |
| BPS (Yen) | 2,245.0 | 2,281.7 | 2,439.9 | 2,678.1 | 2,886.8 | |
| Dividend per Share (Yen) | 17.00 | 17.00 | 30.00 | 43.00 | 67.00 | 70.00 |
| Shares Outstanding (Million shares) | 16.48 | 16.48 | 16.48 | 16.48 | 16.48 |
Source: Calculated by Omega Investment based on FactSet’s standard criteria, rounded to the nearest whole number.
Share price
Financial data (quarterly basis)
| Unit: million yen | 2024/3 | 2025/3 | 2026/3 | ||||||
| 4Q | 1Q | 2Q | 3Q | 4Q | 1Q | 2Q | 3Q | 4Q | |
| (Income Statement) | |||||||||
| Sales | 21,621 | 23,002 | 23,453 | 24,082 | 21,166 | 22,675 | 23,266 | 24,321 | 22,092 |
| Year-on-year | 9.4% | 7.5% | 4.9% | 3.2% | -2.1% | -1.4% | -0.8% | 1.0% | 4.4% |
| Cost of Goods Sold (COGS) | 16,967 | 17,405 | 18,201 | 18,648 | 16,912 | 17,783 | 17,977 | 18,526 | 17,211 |
| Gross Income | 4,654 | 5,597 | 5,252 | 5,434 | 4,254 | 4,892 | 5,289 | 5,795 | 4,881 |
| Gross Income Margin | 21.5% | 24.3% | 22.4% | 22.6% | 20.1% | 21.6% | 22.7% | 23.8% | 22.1% |
| SG&A Expense | 4,031 | 3,861 | 3,793 | 4,038 | 3,999 | 4,129 | 4,108 | 4,175 | 4,290 |
| EBIT (Operating Income) | 623 | 1,736 | 1,459 | 1,396 | 255 | 763 | 1,181 | 1,620 | 591 |
| Year-on-year | -288.2% | 768.0% | 150.3% | -9.6% | -59.1% | -56.0% | -19.1% | 16.0% | 131.8% |
| Operating Income Margin | 2.9% | 7.5% | 6.2% | 5.8% | 1.2% | 3.4% | 5.1% | 6.7% | 2.7% |
| EBITDA | 1,278 | 2,309 | 2,041 | 2,000 | 898 | 1,422 | 1,878 | 2,284 | 1,327 |
| Pretax Income | 1,335 | 1,795 | 1,472 | 1,460 | 415 | 792 | 1,049 | 1,643 | 755 |
| Consolidated Net Income | 1,084 | 1,227 | 1,019 | 998 | 259 | 560 | 685 | 1,151 | 530 |
| Minority Interest | 0 | 0 | 0 | 0 | 0 | 0 | 0 | 0 | 0 |
| Net Income ATOP | 1,084 | 1,227 | 1,019 | 998 | 259 | 560 | 685 | 1,151 | 530 |
| Year-on-year | 439.3% | 764.1% | 154.8% | -10.0% | -76.1% | -54.4% | -32.8% | 15.3% | 104.6% |
| Net Income Margin | 5.0% | 5.3% | 4.3% | 4.1% | 1.2% | 2.5% | 2.9% | 4.7% | 2.4% |
| (Balance Sheet) | |||||||||
| Cash & Short-Term Investments | 15,729 | 15,487 | 15,940 | 18,279 | 15,729 | 14,691 | 15,570 | 15,658 | 13,487 |
| Total assets | 67,370 | 68,096 | 65,443 | 71,037 | 64,080 | 63,077 | 64,559 | 69,196 | 63,922 |
| Total Debt | 6,447 | 4,172 | 4,021 | 3,925 | 5,509 | 3,685 | 3,554 | 3,424 | 3,293 |
| Net Debt | -9,282 | -11,315 | -11,919 | -14,354 | -10,220 | -11,006 | -12,016 | -12,234 | -10,194 |
| Total liabilities | 28,386 | 28,008 | 24,670 | 29,031 | 24,114 | 22,996 | 23,686 | 28,366 | 22,353 |
| Total Shareholders’ Equity | 38,978 | 40,086 | 40,771 | 42,004 | 39,963 | 40,080 | 40,871 | 40,827 | 41,563 |
| (Profitability %) | |||||||||
| ROA | 4.20 | 5.86 | 6.69 | 6.21 | 5.33 | 4.32 | 3.85 | 3.79 | 4.57 |
| ROE | 7.22 | 9.89 | 11.31 | 10.74 | 8.87 | 7.08 | 6.13 | 6.41 | 7.18 |
| (Per-share) Unit: JPY | |||||||||
| EPS | 67.7 | 76.8 | 63.7 | 62.4 | 17.4 | 37.5 | 45.9 | 78.4 | 37.2 |
| BPS | 2,439.9 | 2,509.2 | 2,550.0 | 2,627.1 | 2,678.1 | 2,686.0 | 2,735.5 | 2,835.7 | 2,886.8 |
| Dividend per Share | 20.00 | 0.00 | 19.00 | 0.00 | 24.00 | 0.00 | 23.00 | 0.00 | 44.00 |
| Shares Outstanding(million shares) | 16.48 | 16.48 | 16.48 | 16.48 | 16.48 | 16.48 | 16.48 | 16.48 | 16.48 |
Source: Calculated by Omega Investment based on FactSet’s standard criteria, rounded to the nearest whole number.
Financial data (full-year basis)
| Unit: million yen | 2017/3 | 2018/3 | 2019/3 | 2020/3 | 2021/3 | 2022/3 | 2023/3 | 2024/3 | 2025/3 | 2026/3 |
| (Income Statement) | ||||||||||
| Sales | 70,812 | 72,759 | 73,989 | 74,480 | 68,502 | 75,647 | 82,363 | 88,724 | 91,703 | 92,354 |
| Year-on-year | 5.8% | 2.7% | 1.7% | 0.7% | -8.0% | 10.4% | 8.9% | 7.7% | 3.4% | 0.7% |
| Cost of Goods Sold | 52,433 | 53,837 | 55,778 | 56,635 | 52,643 | 59,851 | 67,737 | 70,706 | 71,166 | 71,497 |
| Gross Income | 18,379 | 18,922 | 18,211 | 17,845 | 15,859 | 15,796 | 14,626 | 18,018 | 20,537 | 20,857 |
| Gross Income Margin | 26.0% | 26.0% | 24.6% | 24.0% | 23.2% | 20.9% | 17.8% | 20.3% | 22.4% | 22.6% |
| SG&A Expense | 14,391 | 14,748 | 15,094 | 14,944 | 13,882 | 14,179 | 14,520 | 15,068 | 15,691 | 16,702 |
| EBIT (Operating Income) | 3,988 | 4,174 | 3,117 | 2,901 | 1,977 | 1,617 | 106 | 2,950 | 4,846 | 4,155 |
| Year-on-year | 16.1% | 4.7% | -25.3% | -6.9% | -31.9% | -18.2% | -93.4% | 2683.0% | 64.3% | -14.3% |
| Operating Income Margin | 5.6% | 5.7% | 4.2% | 3.9% | 2.9% | 2.1% | 0.1% | 3.3% | 5.3% | 4.5% |
| EBITDA | 5,742 | 5,919 | 5,194 | 5,867 | 4,929 | 4,414 | 2,882 | 5,649 | 7,248 | 6,911 |
| Pretax Income | 4,021 | 4,205 | 3,781 | 3,104 | 2,140 | 1,754 | 648 | 3,767 | 5,142 | 4,239 |
| Consolidated Net Income | 2,867 | 2,877 | 2,296 | 2,058 | 1,458 | 1,211 | 485 | 2,735 | 3,503 | 2,926 |
| Minority Interest | 0 | 0 | 0 | 0 | 0 | 0 | 0 | 0 | 0 | 0 |
| Net Income ATOP | 2,867 | 2,877 | 2,296 | 2,058 | 1,458 | 1,211 | 485 | 2,735 | 3,503 | 2,926 |
| Year-on-year | 37.5% | 0.3% | -20.2% | -10.4% | -29.2% | -16.9% | -60.0% | 463.9% | 28.1% | -16.5% |
| Net Income Margin | 4.0% | 4.0% | 3.1% | 2.8% | 2.1% | 1.6% | 0.6% | 3.1% | 3.8% | 3.2% |
| (Balance Sheet) | ||||||||||
| Cash & Short-Term Investments | 13,779 | 13,072 | 10,927 | 10,747 | 12,385 | 12,441 | 12,289 | 15,729 | 15,729 | 13,487 |
| Total assets | 51,442 | 64,837 | 70,105 | 63,767 | 62,320 | 61,760 | 63,011 | 67,370 | 64,080 | 63,922 |
| Total Debt | 7,696 | 13,890 | 19,095 | 15,699 | 13,118 | 10,472 | 5,503 | 6,447 | 5,509 | 3,293 |
| Net Debt | -6,083 | 818 | 8,168 | 4,952 | 733 | -1,969 | -6,786 | -9,282 | -10,220 | -10,194 |
| Total liabilities | 22,984 | 33,849 | 37,200 | 29,660 | 26,739 | 25,218 | 26,214 | 28,386 | 24,114 | 22,353 |
| Total Shareholders’ Equity | 28,456 | 30,984 | 32,900 | 34,103 | 35,577 | 36,539 | 36,794 | 38,978 | 39,963 | 41,563 |
| (Cash Flow) | ||||||||||
| Net Operating Cash Flow | 4,692 | 4,950 | 2,405 | 5,575 | 5,203 | 3,757 | 3,526 | 5,957 | 4,594 | 2,940 |
| Capital Expenditure | 3,909 | 11,769 | 6,731 | 2,068 | 705 | 398 | 1,304 | 913 | 822 | 2,774 |
| Net Investing Cash Flow | -3,929 | -11,811 | -8,895 | -2,098 | -588 | -419 | -856 | -239 | -1,062 | -2,706 |
| Net Financing Cash Flow | 5,603 | 6,154 | 4,345 | -3,657 | -2,976 | -3,281 | -2,822 | -2,277 | -3,531 | -2,475 |
| Free Cash Flow | 842 | -6,809 | -4,230 | 3,558 | 4,546 | 3,531 | 2,941 | 5,680 | 4,070 | 280 |
| (Profitability ) | ||||||||||
| ROA (%) | 6.12 | 4.95 | 3.40 | 3.07 | 2.31 | 1.95 | 0.78 | 4.20 | 5.33 | 4.57 |
| ROE (%) | 12.00 | 9.68 | 7.19 | 6.14 | 4.18 | 3.36 | 1.32 | 7.22 | 8.87 | 7.18 |
| Net Margin (%) | 4.05 | 3.95 | 3.10 | 2.76 | 2.13 | 1.60 | 0.59 | 3.08 | 3.82 | 3.17 |
| Asset Turn | 1.51 | 1.25 | 1.10 | 1.11 | 1.09 | 1.22 | 1.32 | 1.36 | 1.40 | 1.44 |
| Assets/Equity | 1.96 | 1.96 | 2.11 | 2.00 | 1.81 | 1.72 | 1.70 | 1.72 | 1.67 | 1.57 |
| (Per-share) Unit: JPY | ||||||||||
| EPS | 194.9 | 174.6 | 139.4 | 124.9 | 88.5 | 74.3 | 29.8 | 169.9 | 221.6 | 198.9 |
| BPS | 1,727.1 | 1,880.6 | 1,996.9 | 2,069.9 | 2,159.4 | 2,245.0 | 2,281.7 | 2,439.9 | 2,678.1 | 2,886.8 |
| Dividend per Share | 37.00 | 37.00 | 30.00 | 31.00 | 20.00 | 17.00 | 17.00 | 30.00 | 43.00 | 67.00 |
| Shares Outstanding (million shares) | 14.21 | 16.48 | 16.48 | 16.48 | 16.48 | 16.48 | 16.48 | 16.48 | 16.48 | 16.48 |
Source: Calculated by Omega Investment based on FactSet’s standard criteria, rounded to the nearest whole number.