2026-09-29
Home
Japanese

Omega Investment Co., Ltd.
Uchida Yoko (Investment report – Basic)
| Share price (8/4) | ¥2,047 | Dividend Yield (27/7 CE) | 3.5 % |
| 52weeks high/low | ¥1,916/2,582 | ROE(26/7) | 14.6 % |
| Avg Vol (3 month) | 207.9 thou shrs | Operating margin (TTM) | 3.6 % |
| Market Cap | ¥106.64 bn | Beta (5Y Monthly) | — |
| Enterprise Value | ¥69.85 bn | Shares Outstanding | 52.096 mn shrs |
| PER (27/7 CE) | 8.8 X | Listed market | TSE Prime section |
| PBR (26/7 act) | 1.2 X |
| Click here for the PDF version of this page |
| PDF version |
Profit base supported by the three pillars of public-sector ICT, private-sector ICT, and environmental construction: entering a phase of share price revaluation.
Investment View
Uchida Yoko (hereinafter, the Company) supports information infrastructure and the creation of spaces for schools, local governments, and companies through its three pillars of public-sector ICT, private-sector ICT, and environmental construction. Its strength lies in its ability to provide an integrated offering that extends beyond the sale of devices and fixtures to include networks, security, operational support, support services, and spatial design. Even after the special demand associated with NEXT GIGA runs its course, the structure in which the customer base and service revenue support the profit base will remain unchanged.
The current share price reflects the view that the short-term expansion in business performance, driven by the replacement program for one device per student under the GIGA School Program and the standardization of local government information systems, will amount to only a temporary boost to profits. However, in assessing the Company’s corporate value, it is necessary to evaluate not only the peaks and troughs in device sales but also the business base spanning ICT, networks, security, operational support, support services, and environmental construction across both the public and private markets. Based on a share price of 2,075 yen, forecast EPS of 233.2 yen, actual BPS of 1,432 yen for FY7/2025, forecast ROE of 14.1%, and a forecast dividend of 72 yen, the forecast PER is 8.9 times, the actual PBR is 1.45 times, and the forecast dividend yield is 3.5%. The forecast PER adjusted for net cash at the end of the third quarter is 5.9 times, and the forecast PER after also deducting investment securities falls to approximately 4.0 times. Even after allowing to some extent for concerns about an earnings peak, these levels are highly attractive to medium- to long-term investors.
The Company has positioned people and data as the theme of the 17th Medium-Term Management Plan. These words are not merely a slogan. The Company is deeply embedded in schools, local governments, offices, and corporate IT workplaces. It is well-positioned to handle data on customers’ operations, learning, work styles, space utilization, and system operations. In the public market, it provides not only hardware and software to elementary, junior high, and high schools, universities, and local governments, but also network construction, security, operational support, support services, and staffing services. In the private market, it combines a software licensing business for major companies, meeting-room operations systems, ERP for small and medium-sized enterprises, and office environmental construction. In environmental construction, it offers office furniture sales and interior construction under the Uchida brand, and, by leveraging its nationwide sales network, it holds a leading position in school teaching materials and equipment, as well as custom-made furniture for schools and public facilities. This combination enables the Company to remain involved not only in customers’ equipment renewals and regulatory compliance, but also in subsequent operations and improvement.
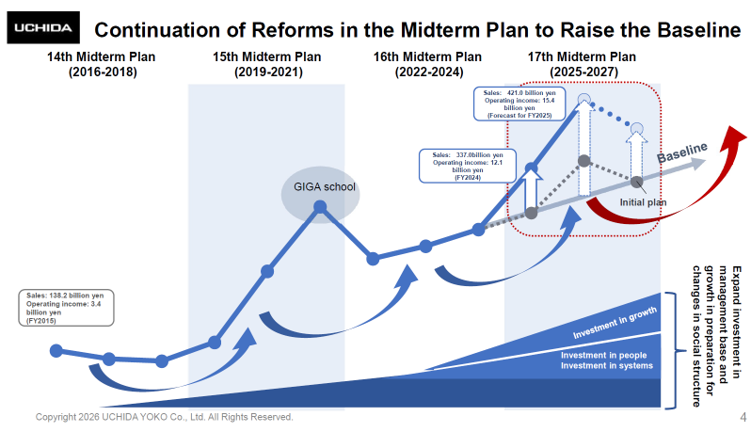
In FY7/2026, net sales for the cumulative 3Q were 314.3 billion yen, operating profit was 15.9 billion yen, ordinary profit was 16.7 billion yen, and profit attributable to owners of parent was 12.1 billion yen. Operating profit had already exceeded the full-year Company forecast of 15.4 billion yen by the end of 3Q. At the 3Q results, the Company revised its full-year earnings forecast to net sales of 421.0 billion yen, operating profit of 15.4 billion yen, ordinary profit of 16.3 billion yen, and profit attributable to owners of parent of 11.5 billion yen. Net sales and profit attributable to owners of parent were raised, while operating profit and ordinary profit were left unchanged. This can be regarded as a cautious plan that accounts for the postponement of some local government information system standardization projects to subsequent fiscal years and the expected warranty provision for GIGA School projects. Rather than viewing the unchanged operating and ordinary profit forecasts as weakness, investors should interpret them as reflecting the Company’s conservative assessment of project profitability, warranty burdens, and project progress.
Our investment view is positive for three reasons. First, earnings multiples are low. A forecast PER of 8.9 times represents a valuation equivalent to approximately nine years of forecast earnings for the current fiscal year and generally reflects concerns about an earnings peak, future profit declines, low capital efficiency, or financial risk. However, the Company’s forecast ROE is high at 14.1%, and there is no basis for justifying a low PER on the grounds of low capital efficiency. In public-sector ICT, demand for networks, security, operational support, and support services will remain after GIGA device replacements. At the same time, in private-sector ICT, software licenses for major companies, meeting-room operations systems, and ERP systems for small and medium-sized enterprises will form a recurring revenue base. The 3.5% dividend yield also supports shareholder returns. The stock market may therefore be placing considerable weight on the short-term risk that special demand will fall away, while failing to fully price in the profit base and capital efficiency that should be maintained over the medium term. Second, there is substantial downside support from assets. Net cash, calculated by deducting short-term borrowings of 3.6 billion yen from cash and deposits of 37.9 billion yen at the end of the third quarter, was 34.2 billion yen, equivalent to 33.5% of the market capitalization of 102.3 billion yen. Including investment securities of 21.5 billion yen, the total is 55.8 billion yen, equivalent to 54.5% of market capitalization. Third, improvements in ROE and ROIC have been achieved not through a simple contraction of the balance sheet, but while expanding it. The expansion in sales scale, absorption of SG&A expenses, increase in operating profit, and contributions from non-operating income and gains on the sale of strategic shareholdings have combined to raise the net profit margin, ROE, and ROIC. This is an important change supporting a higher share price valuation.
At the same time, caution is required in valuing the Company’s shares. The gross profit margin has declined markedly in recent years as the proportion of lower-gross-margin projects, such as the software licensing business and GIGA device replacements, has increased. The earnings yield on equity has remained consistently low for many years, making it difficult to identify strong appeal in the shares from this perspective alone. Investors should therefore examine not only the headline growth in net sales, but also monetization of the network, security, operational support, support services, and use of education data that remain after device replacements, continued growth in private-sector ICT, expansion of SmartOfficeNavigator, reduction of strategic shareholdings, and enhancement of shareholder returns.
Using the PBR, DCF, and ROIC valuation methods, we calculate a median fair share price of approximately 2,700 yen and a range of 2,220 yen to 3,050 yen. Under the PBR method, assuming a forecast ROE of 14.1%, a cost of equity of 8.5%, and an actual BPS of 1,432 yen for FY7/2025, the fair share price is 2,220 to 2,650 yen, with a midpoint of 2,435 yen. Under the DCF method, starting from the Company’s operating profit forecast of 15.4 billion yen for FY7/2026, incorporating normalization after special demand, and using a WACC of 6.5% to 7.5% and a perpetual growth rate of 0.5%, the fair share price is 2,350 yen to 3,050 yen, with a midpoint of 2,700 yen. Under the ROIC method, assuming ROIC continues to exceed WACC over the medium term, the fair share price ranges from 2,450 yen to 3,000 yen, with a midpoint of 2,725 yen. The current share price of 2,075 yen is below the lower end of this range and offers approximately 30% upside to the median. Accordingly, we position the shares as an investment capable of delivering meaningful returns over the medium- to long-term.
1. Company Overview and Business Portfolio
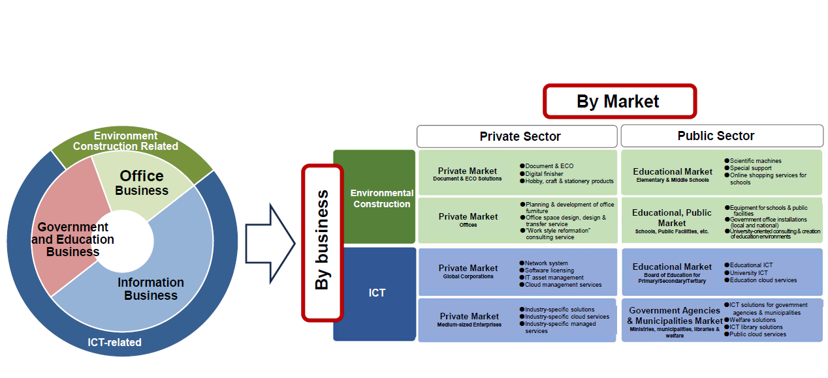
Uchida Yoko (hereinafter, the Company) is included in the wholesale trade category under general industry classifications. However, it is not appropriate to understand the Company today as a wholesaler. Its financial reporting segments are Government and Education Business, Office Business, and Information Business. However, to explain changes in the business portfolio, the Company’s own perspectives on ICT, environmental construction, and the private and public markets are useful. ICT-related businesses account for 75% of net sales, and environmental construction-related businesses for 25%. Approximately 1,200 of the Company’s roughly 3,300 employees are IT engineers. This workforce composition indicates that the Company’s core business has shifted toward system integration.
The Company’s strength lies not in any single product or service, but in the depth of its customer relationships and the breadth of its offering. In the public market, it builds ICT environments for elementary, junior high, and high schools, universities, and local governments. After one device per student was deployed under the GIGA School Program, the next wave of demand for educational ICT, known as NEXT GIGA, emerged. NEXT GIGA refers to demand for device and network renewal, operation, and enhanced security following the Ministry of Education, Culture, Sports, Science and Technology’s GIGA School Program, which provided one device per student and high-speed, high-capacity school networks. Specific issues include stable network operation, coordination between administrative and learning systems, security, device management, repairs, redeployment, spare device management, data utilization, and support for teachers and staff. The Company provides an integrated offering that extends beyond device sales to include network construction, security, operational support, support services, and staffing services. Schools and boards of education regard it as one of their leading points of consultation.
Source: Company material
For local governments, the standardization of local government information systems is a major theme. The Company has a customer base of small and medium-sized municipalities. It focuses on leveraging strengths developed with schools and boards of education to connect and use school data and local government systems as data becomes more fluid. Investors should view this not as a temporary demand for regulatory compliance projects, but as a medium-term business opportunity to connect local government data, education data, and resident services.
In the private market, the Company has strong businesses in both ICT and environmental construction. The software licensing business for major companies, one of the mainstays of private-sector ICT, accounts for approximately 80% of the business’s net sales and holds a leading domestic market share. In network solutions for major companies, the Company also holds one of the leading domestic market shares in meeting room operations systems. In ERP for small and medium-sized enterprises, it has strengths in such industries as food, chemicals, construction, and condominium management. These businesses are not merely an aggregation of resale operations; they involve understanding customers’ operating environments and IT infrastructure and linking implementation to subsequent operations, license renewals, system expansion, and security measures.
In environmental construction, the Company offers office furniture sales and interior construction for the private market under the Uchida brand. Offices are changing from places that simply accommodate desks into spaces that support team communication, knowledge sharing, creativity, and engagement. The Company combines not only furniture and interiors but also ICT, meeting room operations, seat utilization data, sensors, and groupware integration to offer SmartOfficeNavigator. This is an important example of responding to changes in work styles by integrating office environmental construction and ICT.
In environmental construction for the public market, the main businesses are school teaching materials and equipment, as well as custom-made furniture for schools and public facilities. By leveraging its nationwide sales network, each business holds a leading market position. New construction, renovation, and life-extension work for schools and public facilities involves not only demand for stand-alone furniture but also the use of ICT environments, learning spaces, libraries, staff rooms, special-purpose classrooms, and community facilities. Having both public-sector ICT and public-sector environmental construction contributes to larger projects and continuity of customer relationships.
2. How to View Record Profits and the Post-Special-Demand Profit Level
In FY7/2025, net sales were 337.0 billion yen, gross profit was 52.3 billion yen, SG&A expenses were 40.2 billion yen, operating profit was 12.1 billion yen, ordinary profit was 13.1 billion yen, and profit attributable to owners of parent was 9.8 billion yen. Net sales increased 21.3% year on year, operating profit increased 30.3%, and profit attributable to owners of parent increased 40.4%, with net sales and all profit categories reaching record highs. Government and Education Business, Office Business, and Information Business all posted increases in both net sales and profit, demonstrating that the Company’s growth is not dependent solely on public-sector ICT.
In FY7/2024, net sales were 277.9 billion yen, operating profit was 9.3 billion yen, and profit attributable to owners of parent was 6.9 billion yen. In FY7/2025, net sales increased by 59.1 billion yen and operating profit by 2.8 billion yen from those levels. The operating profit margin improved from 3.4% to 3.6%. Although the gross profit margin declined from 17.2% to 15.5%, the SG&A expense ratio fell from 13.8% to 11.9%, thereby maintaining the operating profit margin. This is important in analyzing the Company’s performance. A lower gross margin does not necessarily mean that business quality has deteriorated. When the mix of software licensing business and GIGA device replacement projects increases, the gross margin declines. However, as sales scale expands, fixed costs and personnel expenses are absorbed, and operating profit increases, thereby improving ROIC and the net profit margin.
In FY7/2026, the Company is seeing an even greater expansion in business performance. Net sales for the cumulative 3Q were 314.3 billion yen, operating profit was 15.9 billion yen, ordinary profit was 16.7 billion yen, and profit attributable to owners of parent was 12.1 billion yen. Year on year, net sales increased by 34.2%, operating profit by 35.0%, ordinary profit by 35.5%, and profit attributable to owners of parent by 45.1%. Operating profit has already exceeded the full-year Company forecast of 15.4 billion yen.
The full-year Company forecast is net sales of 421.0 billion yen, operating profit of 15.4 billion yen, ordinary profit of 16.3 billion yen, and profit attributable to owners of parent of 11.5 billion yen. Forecast EPS is 233.2 yen. Based on progress through cumulative 3Q, the profit forecasts appear conservative. However, the Company has left its operating profit and ordinary profit forecasts unchanged. This reflects the postponement of some local government information system standardization projects to subsequent fiscal years, the expected provision for product warranties related to GIGA School projects, and a cautious view of profitability on public-sector ICT projects.
By segment, Government and Education Business was the main driver of earnings expansion in cumulative 3Q FY7/2026, with net sales of 141.4 billion yen and operating profit of 10.7 billion yen. Public-sector ICT demand reflects the overlap of the replacement program for one device per student under the GIGA School Program, local government information system standardization, educational networks, security, and operational support. Office Business recorded net sales of 45.3 billion yen and operating profit of 2.2 billion yen, remaining solid and largely unchanged year on year. Information Business recorded net sales of 126.8 billion yen and operating profit of 2.8 billion yen, supported by resilient private-sector ICT, software licensing, network solutions, and ERP-related business.
The important point is neither to regard all of the high profit in FY7/2026 as sustainable nor to regard all of it as temporary. GIGA device replacement is clearly a peak in demand, and a rebound decline in net sales may emerge from FY7/2027 onward. At the same time, the issues that arise after one device per student has been deployed in schools will continue. Once devices have been introduced, schools require network quality, security, device management, learning data, administrative data, reduced workloads for teachers and staff, and support structures. According to interviews with the Company, Uchida Yoko is recognized as a leading point of contact for customers, and the question of whether this role drives recurring revenue after device sales will be the focus of the investment case from FY7/2027 onward.
3. Medium-Term Profit Base Created by Public- and Private-Sector ICT
The Company’s growth drivers can be organized into four areas: public-sector ICT, private-sector ICT, environmental construction, and data utilization. Under the 17th Medium-Term Management Plan, people and data, the plan’s theme, serve as the axis running across these areas. People include students, teachers, and staff, local government employees, corporate employees, and office workers. Data refers to education data, school administration data, local government data, meeting room utilization data, seat utilization data, license utilization data, and ERP operational data. The Company’s role goes beyond merely holding such data. It designs the environments in which data is generated in the workplace, builds networks and security systems, supports operations, and proposes improvements.
The core of public-sector ICT is the replacement program for one device per student under the GIGA School Program. Following the initial deployment, replacement demand has entered full swing, driving substantial growth in Government and Education Business in FY7/2026. According to interviews with the Company, although Uchida Yoko does not necessarily have a pricing advantage in large-volume device sales, it has achieved substantial results by leveraging long-standing relationships with customers and manufacturers, as well as logistics expertise to support large-scale supply. This comment is important. Investors should not dismiss device sales as low-margin product sales; rather, they should view them as an entry point to reaffirm customer relationships and to link customers to subsequent networks, security, operational support, and data utilization.
The deployment of one device per student in schools has created new issues in many areas, including taking devices home, communication environments, classroom use, integration with administrative systems, security, data migration upon renewal, failure response, teacher training, and operational structures within boards of education. These are not needs that end with a single sale. Rather, the more devices become embedded in school learning activities, the greater the demand for the surrounding ICT environments, support, and data utilization. The Company’s position as a leading point of consultation is highly significant in capturing this recurring demand.
The standardization of local government information systems is also a medium-term growth driver. Under national policy requirements, local governments must standardize core systems and respond to Government Cloud. The Company has small and medium-sized municipalities as customers. Unlike major system integrators that target only large municipalities, it stays close to small and medium-sized local governments. Although some projects were said to have been postponed to subsequent fiscal years in the third quarter, this should be viewed as a shift in the timing of recognition rather than a disappearance of demand. Investors need to monitor the order backlog, implementation progress, the number of municipalities, post-standardization operational support, and the linkage to education data.
In the private-sector ICT market, software licensing for major companies is a pillar of stable revenue. According to interviews with the Company, this business accounts for approximately 80% of the business’s net sales and holds one of the leading domestic market shares. As major companies expand their use of Microsoft and other cloud services, security solutions, identity management, device management, and generative AI-related services, their software use is expanding beyond simple license purchases to include operational design, cost management, security design, and user education. The Company’s deep involvement in license management for major companies creates continuous customer relationships.
In network solutions for major companies, meeting room operation systems are important. SmartRooms operates in more than 20,000 rooms across 640 companies in Japan and is said to have been adopted by 45% of Nikkei 225 companies. Meeting room operations may appear to be a small field, but they are an entry point that connects behavioral data about people working in offices to meeting rooms, seats, building equipment, groupware, and sensors. As hybrid work becomes established, meeting room reservations, actual utilization, no-shows, online meeting equipment, visitor reception, and interdepartmental communication all affect corporate productivity. SmartOfficeNavigator, along with this extension, supports location-independent work styles and promotes communication.
In ERP for small and medium-sized enterprises, the Company has strengths in such fields as food, chemicals, construction, and condominium management. ERP for small and medium-sized enterprises is closer to customers’ operations than systems for major companies. It requires an understanding of industry-specific business practices, inventory management, cost management, order receipt and placement, accounting, and regulatory compliance. The Company’s strength here lies not in selling general-purpose systems, but in implementation expertise and customer bases in specific industries. Standardization of implementation projects, maintenance, cloud migration, and expansion of peripheral services will be important for improving margins.
Environmental construction is an area that is often undervalued by the stock market. Office furniture and school furniture, viewed in isolation, tend to be regarded as having low growth potential. In the Company‘s case, however, environmental construction is not separate from ICT. In schools, it designs learning environments by combining devices, networks, teaching materials and equipment, classrooms, libraries, staff rooms, and public facilities. For companies, it designs workplaces by combining office furniture, interiors, meeting rooms, sensors, groupware, and networks. Environmental construction expands contact with ICT customers, broadens the scope of projects, and leads to data utilization.
4. Management Capability to Raise ROE and ROIC While Expanding the Balance Sheet
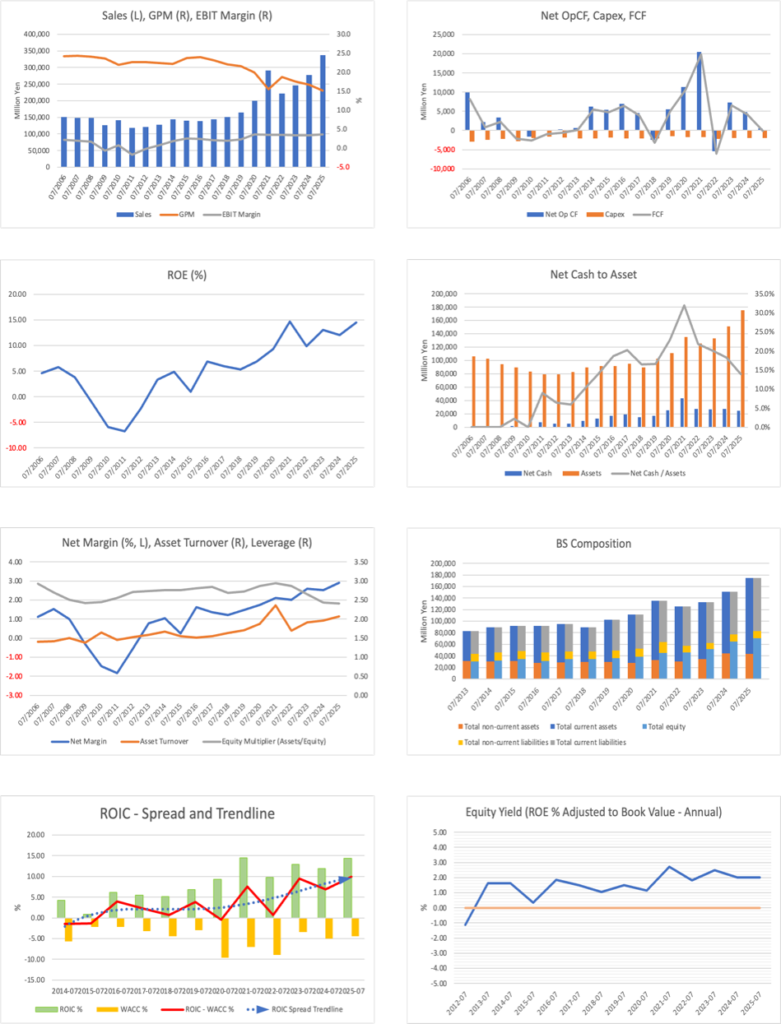
In assessing the Company’s investment appeal, the rise in ROE and ROIC warrants a higher valuation. Forecast ROE is 14.1%, a sufficiently high level for a listed Japanese company. Historical trends show that ROE and ROIC have risen, and the ROIC spread has expanded steadily. This is an important change in the valuation of the shares. The ROIC spread is the extent to which return on invested capital exceeds the cost of capital, indicating whether the Company is creating value above its cost of capital.
More importantly, the Company has not raised ROE and ROIC by shrinking its balance sheet. Total assets at the end of 3Q FY7/2026 were 214.9 billion yen, reflecting increases in notes and accounts receivable – trade, contract assets, cash and deposits, and investment securities. Working capital increased as large-scale projects expanded, thereby expanding the balance sheet. Nevertheless, ROE and ROIC increased. This resulted from the combined effects of higher profit, absorption of SG&A expenses, asset turnover, and contributions from non-operating income and extraordinary gains. Raising capital efficiency while expanding the balance sheet deserves a high valuation as evidence of the Company’s management capability.
At the same time, the decline in the gross profit margin must not be overlooked. Public-sector ICT projects, particularly the software licensing business and device replacement demand, substantially increase sales scale while tending to lower gross margins. In FY7/2025, the gross profit margin declined, but the operating profit margin was maintained through a lower SG&A expense ratio. The same structure appears to be continuing in FY7/2026. Investors should therefore assess a decline in the gross profit margin not uniformly as a negative factor, but together with operating profit, the SG&A expense ratio, ROIC, provisions for product warranties, and the recovery of support revenue.
The background to the improvement in the net profit margin also requires clarification. Although the gross profit margin has declined, the EBIT margin has remained flat, and the net profit margin has risen because of contributions from non-operating income, gains on the sale of investment securities, a lower tax burden, and the absorption of SG&A expenses. In cumulative 3Q FY7/2026, a gain on the sale of investment securities of 1.0 billion yen was recorded. This is a factor that boosts profit beyond operating profit from the core business. Investors should not view growth in net profit as a direct improvement in operating capabilities, but should distinguish among operating profit, ordinary profit, and net profit.
The earnings yield on equity requires cautious assessment. Historical trends show that it has remained consistently low for many years. From this perspective, it is difficult to identify a strong appeal in the Company’s shares. A low earnings yield on equity makes it difficult to explain investment appeal solely by profit-generating capacity relative to book value. The appeal of the shares, therefore, lies not in the earnings yield, but in the low forecast PER of 8.9 times, the net-cash-adjusted PER of 5.9 times, the adjusted PER of 4.0 times including investment securities, the expanding ROIC spread, the dividend yield of 3.5%, and expectations for improved capital policy.
5. Share Price Support from Net Cash and Investment Securities
At the end of 3Q FY7/2026, cash and deposits were 37.9 billion yen, and short-term borrowings were 3.6 billion yen. The financial results do not report long-term borrowings or bonds. Deducting interest-bearing debt from cash and deposits gives net cash of 34.2 billion yen. The number of issued shares excluding treasury shares is approximately 49.32 million, and the market capitalization, calculated at a share price of 2,075 yen, is approximately 102.3 billion yen. Net cash of 34.2 billion yen is equivalent to 33.5% of market capitalization.
Multiplying the forecast PER by one minus the ratio of net cash to market capitalization gives a net-cash-adjusted forecast PER of approximately 5.9 times. The forecast PER of 8.9 times is already low, but the adjustment for net cash makes the undervaluation clear. On an enterprise value basis, the market appears to place an extremely low value on the Company’s operating businesses.
In addition, investment securities at the end of 3Q were 21.5 billion yen, most of which appear to be listed shares. Net cash of 34.2 billion yen and investment securities of 21.5 billion yen total 55.8 billion yen, equivalent to 54.5% of the market capitalization of 102.3 billion yen. Adjusting for these assets lowers the forecast PER to approximately 4.0 times. This is one of the most important issues in valuing the shares. The valuation is also low on an EV/EBITDA basis. Adding approximately 2.2 billion yen, the annualized equivalent of depreciation and amortization of 1.6 billion yen for the cumulative 3Q, to the Company’s operating profit forecast of 15.4 billion yen for FY7/2026, gives EBITDA of approximately 17.6 billion yen. Enterprise value after deducting net cash of 34.2 billion yen from market capitalization of 102.3 billion yen is approximately 68.1 billion yen, producing EV/EBITDA of approximately 3.9 times. If investment securities of 21.5 billion yen are also deducted, and the enterprise value is viewed at approximately 46.6 billion yen, EV/EBITDA falls to approximately 2.6 times. The Company’s operating businesses are valued at a considerably low level, not only on a PER basis but also on an enterprise value basis.
However, investment securities are not the same as cash, and the entire amount may not be allocated to shareholder returns immediately. Management explains that strategic shareholdings are maintained to sustain stable, long-term business relationships with customers and to support business alliances and collaborations. At the same time, it has adopted a policy of annually reviewing the rationale for each holding at meetings of the Board of Directors. In fact, the sale of a portion of strategic shareholdings contributed to profit in FY7/2025, and the Company recorded a gain of 1.0 billion yen on the sale of investment securities in cumulative 3Q FY7/2026. Management can be assessed as taking certain steps to improve asset efficiency.
In 2017, Strategic Capital submitted two shareholder proposals seeking to amend the Company’s Articles of Incorporation to add a provision authorizing the disposal of strategic shareholdings and to require the Company to increase dividends. Both proposals were rejected at the 2017 Annual General Meeting of Shareholders. No clear history of subsequent activist investor campaigns concerning the Company has been identified. Nevertheless, this history shows that strategic shareholdings and shareholder returns have long been of interest to capital markets.
Today, both the business environment and capital market perspectives differ from those at that time. The Tokyo Stock Exchange is calling for management that is conscious of the cost of capital and share price. Pressure to reduce strategic shareholdings has increased, investors place greater emphasis on ROE, and interest in dividends and treasury shares has grown. The Company’s performance has reached record levels, ROE has risen to 14.1%, and dividends have also been increased. If the Company can indicate the direction of reductions in strategic shareholdings, the use of gains on sales, share repurchases, and the payout ratio at this stage, the share price valuation should improve more readily.
6. Major Shareholders and the Shareholder Composition from a Capital Market Perspective
According to FactSet data, Oasis Management Company Limited is the largest shareholder with a 7.56% holding. Uchida Yoko’s treasury shares follow this at 5.28%, Tokio Marine Holdings at 4.18%, Sumitomo Mitsui Trust Group at 3.97%, and the Uchida Yoko Group Employee Shareholding Association at 3.19%. The free-float ratio is 64.82%, and identifiable major shareholders hold 60.93%. The shareholder distribution comprises a mixture of stable shareholders, the employee shareholding association, financial institutions, and investors focused on capital efficiency.
The reasons Oasis may find the Company attractive are clear. First, the PER is low. Second, net cash and investment securities are substantial. Third, ROE and ROIC are rising. Fourth, public- and private-sector ICT have medium-term demand. Fifth, there is considerable scope to improve shareholder returns by reducing strategic shareholdings and increasing shareholder distributions. Oasis is known as an investor that emphasizes capital efficiency and enhancement of shareholder value at Japanese companies. Uchida Yoko appears to be a natural investment target.
For minority shareholders, this shareholder composition has both positive aspects and points requiring caution. The positive aspect is that the presence of the largest shareholder, focused on capital efficiency, should facilitate dialogue with management that is conscious of strategic shareholdings, dividends, treasury shares, and the cost of capital. This could also benefit minority shareholders. The point to be cautious about is that expectations for capital policy can be priced into shares in advance. If the Company’s response is slower than investors expect, the share price may react negatively. Minority shareholders should therefore view the presence of an activist major shareholder not as a short-term catalyst but as a factor that promotes dialogue between management and the capital markets.
The presence of an activist shareholder is not necessarily negative for the Company either. To enhance corporate value over the medium- to long-term, the Company needs to clearly explain its business growth, capital efficiency, shareholder returns, and its approach to strategic shareholdings. Oasis’s holding encourages such an explanation. If the Company can explain its strategy, particularly people and data, public-sector ICT, private-sector ICT, SmartOfficeNavigator, and data utilization after local government information system standardization, in connection with capital efficiency and shareholder returns, the shareholder composition should have a positive effect on the share price valuation.
7. EPS Growth Priced in by the Market and Share Price Undervaluation
Based on a share price of 2,075 yen and forecast EPS of 233.2 yen, the forecast PER is 8.9 times. Based on the actual BPS of 1,432 yen for FY7/2025, the actual PBR is 1.45 times. Based on a forecast dividend of 72 yen, the dividend yield is 3.5%, and the forecast payout ratio is 30.9%. These indicators show that the shares do not price in high growth expectations but rather reflect caution about the reaction to special demand.
Using a dividend discount approach and assuming an 8.5% cost of equity, the current forecast PER of 8.9 times implies a medium-term EPS growth rate of approximately 5.0%. Even assuming a cost of equity in the range of 8.0% to 9.0%, the priced-in EPS growth rate is approximately 4.5% to 5.5%. By contrast, EPS increased from approximately 125.7 yen to approximately 199.5 yen on a post-stock-split basis from FY7/2020 to FY7/2025, representing a five-year actual CAGR of approximately 9.7%. Forecast EPS of 233.2 yen for FY7/2026 is 16.9% above the FY7/2025 result.
This comparison shows that the market does not expect the EPS growth rate of the past five years to continue at the same pace. Rather, it appears to have priced in, to a reasonable extent, the reaction to GIGA device replacement demand, timing delays in local government information system standardization, and the decline in the gross profit margin. Therefore, the forecast PER should be re-rated if, from FY7/2027 onward, it is confirmed that networks, security, operational support, support services, and data utilization remain after special demand in public-sector ICT, that private-sector ICT continues to grow, and that SmartOfficeNavigator increases the number of adopting companies and rooms in use.
Fair-value price estimates based on PBR, DCF, and ROIC suggest that the current share price is undervalued. Under the PBR method, assuming a forecast ROE of 14.1%, a cost of equity of 8.5%, and an actual BPS of 1,432 yen for FY7/2025, we apply a fair PBR range of 1.55 to 1.85 times. This produces a fair share price of 2,220 yen to 2,650 yen, with a midpoint of 2,435 yen. Under the DCF method, the Company’s forecast operating profit of 15.4 billion yen for FY7/2026 is used as the starting point, with normalization following special demand factored in, and a WACC of 6.5% to 7.5% and a perpetual growth rate of 0.5% are applied. The fair share price, including net cash, is 2,350 yen to 3,050 yen, with a midpoint of 2,700 yen. Under the ROIC method, assuming that ROIC continues to exceed WACC, the sustainability of the ROIC spread is reflected in corporate value. The fair share price is 2,450 yen to 3,000 yen, with a midpoint of 2,725 yen.
The midpoints of the three methods are 2,435 yen under the PBR method, 2,700 yen under the DCF method, and 2,725 yen under the ROIC method, giving a median of 2,700 yen. The range is 2,220 yen to 3,050 yen. The current share price of 2,075 yen is below the lower end of this range. Although it is understandable that the current share price reflects investor concerns about a short-term reaction in business performance, when net cash, investment securities, ROE of 14.1%, a dividend yield of 3.5%, and the public- and private-sector ICT bases are considered together, the current valuation appears excessively cautious.
8. The Share Price over the Past Five Years Has Been Driven by Public-Sector ICT Demand and Capital Efficiency
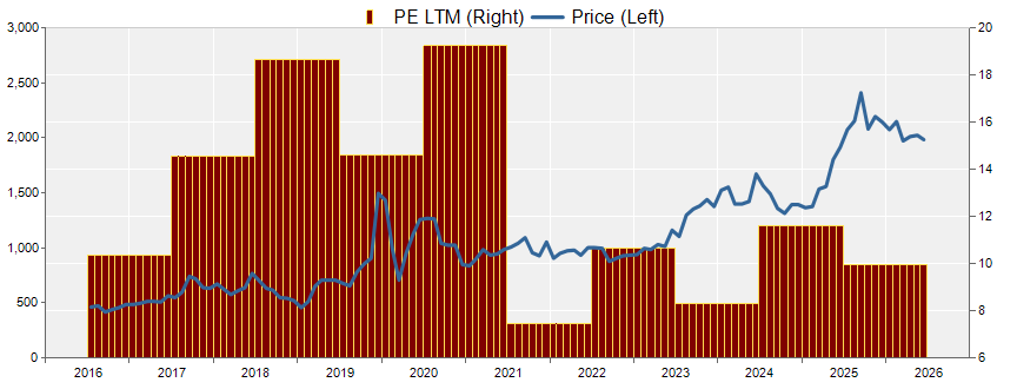
Over the past five years, the share price has moved in response to the initial demand under the GIGA School Program, the reaction after that initial demand, renewed business expansion from 2024 onward, and expectations for NEXT GIGA and local government information system standardization from 2025 to 2026. In terms of performance, GIGA-related demand made a substantial contribution in FY7/2021, followed by a reaction in FY7/2022. Net sales declined from 291.0 billion yen in FY7/2021 to 221.8 billion yen in FY7/2022. They then recovered in FY7/2023, FY7/2024, and FY7/2025 and are expanding further in FY7/2026.
During periods when the share price did not respond sufficiently to strong business performance, investors appeared to regard large-scale public-sector ICT demand as temporary and to increase their caution regarding peak earnings. In particular, GIGA School-related demand experienced a substantial reaction after the initial deployment, leading many investors to assume a similar reaction following the current replacement demand. This has contributed to the low forecast PER of 8.9 times.
By contrast, when the share price rose, the market appeared to have valued record earnings, expanding public-sector ICT demand, local government information system standardization, stable growth in private-sector ICT, higher dividends, sales of strategic shareholdings, and rising ROE. In other words, the share price is not driven solely by net sales and operating profit. It moves in response to views on the sustainability of public-sector ICT demand, the post-special-demand profit level, capital efficiency, shareholder returns, and reductions in strategic shareholdings.
The main driver of the share price going forward will be business performance from FY7/2027 onward. FY7/2026 is likely to generate high profits, but the stock market is looking beyond it. The key issue is how much of public-sector ICT net sales and profits remain after device-replacement demand peaks. At the same time, if private-sector ICT, software licenses for major companies, meeting room operation systems, ERP, SmartOfficeNavigator, and office environmental construction grow steadily, the market should become less concerned about the reaction after special demand.
9. Risk Factors Affecting the Investment View
The first risk is the peak-out of GIGA device replacement demand. Government and Education Business expanded substantially at the end of 3Q FY7/2026, but device replacement demand is not permanent. A rebound decline in net sales may emerge beginning with FY7/2027. Investors need to examine the extent to which networks, security, operational support, repairs, redeployment, management of spare devices, and education data utilization can offset the decline in device sales.
The second risk is the postponement of standardization projects for local government information systems. As of 3Q, the Company explained that an increasing number of core-system-related projects were being postponed to subsequent fiscal years. This does not represent the disappearance of demand, but it affects the timing of net sales and profit recognition. Order backlog, implementation progress, schedules for each municipality, and the transition to post-standardization operational support should be monitored.
The third risk is provisions for product warranties. In GIGA School projects, the more devices there are, the greater the burden on warranties, support, logistics, initial defect response, and spare-device management. The 3Q materials indicated the recognition of provisions for product warranties associated with GIGA School projects. The conservative profit forecast can be viewed positively, but further burdens would constrain improvement in the operating profit margin.
The fourth risk is constraints on human resources. The fact that approximately 1,200 of the Company’s roughly 3,300 employees are IT engineers is a strength. At the same time, when public-sector ICT, private-sector ICT, networks, security, local government systems, and SmartOfficeNavigator grow simultaneously, securing and allocating engineers may constrain growth. Recruitment, training, external partners, and management of project profitability are important.
The fifth risk is a decline in the gross profit margin. As large device projects increase, net sales grow, but gross margins tend to decline. This is less problematic while the SG&A expense ratio declines and operating profit and ROIC increase. However, if net sales decline after special demand, gross margins fail to recover, and the SG&A expense ratio rises, the share price valuation could fall.
The sixth risk is progress on capital policy. Large net cash and investment securities support the share price, but if the improvements in capital efficiency expected by investors do not progress, the low-PER valuation may persist. Reductions in strategic shareholdings, dividend policy, and share repurchases, as well as explanations of the cost of capital, will be important.
10. Monitoring Items for Future Financial Results
Net sales and operating profit alone are insufficient as items to monitor in future financial results. First, investors should examine the magnitude of the reaction in net sales and operating profit in Government and Education Business. After GIGA device replacement sales pass their peak, the most important issue will be how much network integration, security, support, operational support, and education data utilization remain.
Second, investors should examine the growth rate of private-sector ICT in the information business. They should determine whether software licenses for major companies, IT services after Windows upgrades, network solutions, meeting room operation systems, and ERP continue to grow. Stable growth in private-sector ICT would make it easier to absorb the peaks and troughs in public-sector ICT.
Third, investors should examine the expansion of SmartOfficeNavigator and SmartRooms. The key is to determine whether the number of contracted rooms and adopting companies, horizontal deployment within major companies, and functional enhancements such as desktop devices, employee ID card integration, sensor integration, and groupware integration are translating into net sales.
Fourth, investors should examine the gross profit margin and SG&A expense ratio. They should determine whether a lower SG&A expense ratio is enabling the operating profit margin to be maintained despite a lower gross margin. It will also be important to see whether the gross margin recovers after public-sector ICT projects settle down.
Fifth, investors should examine ROE, ROIC, and the ROIC spread. The key is whether the Company can maintain capital efficiency as it expands its balance sheet. Increases in working capital, cash balances, investment securities, sales of strategic shareholdings, and treatment of treasury shares should be considered together.
Sixth, investors should examine the balance of investment securities and the use of gains on sales. Investment securities of 21.5 billion yen at the end of 3Q are substantial. If sales proceed, the use of the funds for growth investment, dividends, share repurchases, or debt repayment will affect the share price valuation.
Seventh, investors should examine dividends and treasury shares. The Company has steadily increased dividends on the premise of stable dividend payments. The forecast dividend of 72 yen for FY7/2026 represents a dividend yield of 3.5% at a share price of 2,075 yen. It will be important to see whether the dividend level is raised further in line with the higher earnings baseline.
11. Corporate Value Creation by Business and KPIs to Monitor
Public-sector ICT plays the role of simultaneously creating sales scale and deep customer relationships in the formation of the Company’s corporate value. Viewed solely as device sales, the replacement program for one device per student under the GIGA School Program tends to have a low gross margin. For schools and boards of education, however, devices are the entry point to educational ICT. Once devices begin operating, issues persist in networks, security, account management, device management, failure response, support for classroom use, school administration support, and data linkage. The Company has customer relationships, manufacturer relationships, logistics expertise for large-scale supply, and support structures. Public-sector ICT, therefore, not only generates net sales in a single fiscal year but also forms a customer base for winning recurring projects thereafter.
KPIs to monitor in public-sector ICT are the number of devices deployed, the number of boards of education and schools, the number of network integration and security projects, the number of operational support contracts, utilization rates of support personnel, order backlog for local government information system standardization, and post-standardization operating contracts. Factors incorporated in the Company forecast are NEXT GIGA replacement demand, local government information system standardization, and demand related to educational networks. Upside factors that may not be fully incorporated are operational support continuing longer than expected after device replacement, expanding demand to link school and local government data, and additional demand generated by security measures. Downside factors are deteriorating profitability on device projects, additional provisions for product warranties, postponement of local government projects, and engineer shortages.
Private-sector ICT helps smooth the peaks and troughs in public-sector ICT and accumulates recurring revenue to build corporate value. The software licensing business for major companies accounts for approximately 80% of the business’s net sales and holds one of the leading domestic market shares. License sales tend to be viewed as high-value renewal projects, but as customers use more cloud services, identity management, security, device management, and generative AI-related functions, they increasingly require visibility into usage, cost optimization, operating design, security configuration, and user education. The Company’s deep involvement in IT departments at major companies is an important asset for proposing additional services.
KPIs to monitor in private-sector ICT are software license net sales to major companies, renewal rates, customer numbers, the number of services used per customer, the number of network solution projects, the number of companies and rooms adopting meeting room operation systems, the number of ERP implementations, and the share of net sales from maintenance and operational services. Factors incorporated in the Company forecast are stable growth in software licenses for major companies, Windows upgrade-related demand, network renewals, and ERP implementations. Upside factors are expansion from license management into operational services, horizontal deployment of meeting room operation systems within major companies, and expansion of industry-specific ERP templates. Downside factors are price competition in license sales, restraint in customer IT investment, delays in implementation projects, and bargaining relationships with external cloud providers.
Environmental construction in the private market plays the role of capturing the recovery in office investment and changes in work styles in the formation of corporate value. Office furniture sales and interior construction leverage the Uchida brand’s recognition and customer base. Traditionally, office investment centered on furniture and interiors associated with relocation and expansion. Today, however, the issues include hybrid work, interdepartmental communication, the purpose of employee office attendance, meeting room utilization, free-address office environments, security, and well-being. SmartOfficeNavigator captures this change and demonstrates that the Company is not merely an office furniture company but one that supports data utilization in the workplace.
KPIs to monitor in private-sector environmental construction are the number of office relocation and renovation projects, order value per project, the number of companies adopting SmartOfficeNavigator, the number of rooms adopting SmartRooms, the number of sensor and employee ID card integrations, and the proportion of projects combining interiors and ICT. Factors incorporated into the Company forecast include the return to offices, reassessment of work styles, and improved efficiency in meeting room operations. Upside factors include office investment broadening from simple relocation to data-driven workplace creation, and the expansion of meeting room operations systems already adopted by major companies into seating, reception, and building equipment. Downside factors include restraint in corporate capital investment, reductions in office space, rising construction costs, and deteriorating project profitability.
Environmental construction in the public market complements public-sector ICT in shaping corporate value. School teaching materials, equipment, and custom-made furniture for schools and public facilities are well-positioned through the nationwide sales network. New construction, renovation, and life-extension work at school facilities involves the integrated review of classrooms, libraries, science rooms, staff rooms, gymnasiums, and community exchange facilities. When ICT for education is added, the Company can be involved in providing facilities, furniture, teaching materials, networks, devices, and operational support. Public-sector environmental construction may not show high growth on a stand-alone basis, but it broadens the scope of projects by linking to the public-sector ICT customer base.
KPIs to monitor in public-sector environmental construction are the number of school renovation projects, the number of custom-made furniture projects for public facilities, net sales of teaching materials and equipment, the proportion of environmental construction projects involving ICT, and the number of years of continuous transactions with each local government. Factors incorporated into the Company forecast include school facility renovations, life-extension work for public facilities, and improvements to educational environments. Upside factors include a review of learning spaces themselves following GIGA device replacement and the integration of educational data utilization into facility development by local governments. Downside factors are constraints on local government budgets, higher construction and material costs, and delays in public works.
12. Linking People and Data to Corporate Value
People and data, which are at the center of the 17th Medium-Term Management Plan, are words that help investors understand customer relationships and recurring revenue. People include students, teachers, and staff, local government employees, corporate employees, and office workers. Data refers to education data, school administration data, local government data, meeting room utilization data, seat utilization data, license utilization data, and ERP operational data. The Company creates value not only through data analysis. Its strength lies in designing and implementing the environments in which data is generated, building networks and security, and supporting operations.
From this perspective, the replacement program for one device per student under the GIGA School Program can be viewed not only as a demand for device replacement but also as a demand to establish the data infrastructure in educational workplaces. Local government information system standardization can be viewed not only as regulatory compliance projects but also as infrastructure development that connects local government and education data. SmartOfficeNavigator can be viewed not as an office furniture-related service but as a mechanism for using employee behavioral data to increase office productivity. Software licenses for major companies can be viewed not as software sales, but as an entry point to operational improvement based on corporate IT usage data.
This framework is important to the investment view because it allows the Company’s profit base to be evaluated by the continuity of customer relationships rather than by temporary sales volumes. Device replacement and standardization create short-term demand peaks. However, by entering customers’ workplaces, supporting operations, and advancing into data utilization, the Company becomes better positioned to capture the next wave of demand. Investors need to examine how people and data translate into medium-term net sales, profit, ROIC, and dividends.
The Company forecast incorporates large public-sector ICT projects in FY7/2026, stable growth in private-sector ICT, solid performance in Office Business, and a portion of gains on the sale of investment securities. By contrast, factors that may not be fully incorporated include the continuation of public-sector ICT operational support after special demand, additional projects after local government information system standardization, horizontal expansion of SmartOfficeNavigator, further reductions in strategic shareholdings, and additional dividend increases. Downside factors include reactions in public-sector ICT, warranty burdens, postponement of local government projects, slowing private-sector IT investment, and engineer shortages.
13. Investment Focus by Time Horizon
The share price issues over a one- to two-year horizon are the final results for FY7/2026 and the profit level in FY7/2027. As operating profit for Cumulative 3Q FY7/2026 has exceeded the full-year forecast, there are short-term expectations for earnings upside. The stock market, however, is aware of the reaction that follows. When the Company presents its forecast for FY7/2027, the magnitude of the reaction in public-sector ICT net sales, the extent to which private-sector ICT and environmental construction offset it, and the level at which operating profit remains will determine the share price valuation.
Three points need to be confirmed to target meaningful returns over one to two years. First, operating profit in FY7/2027 must not decline sharply and must be maintained above the level of FY7/2025. Second, the Company must present a capital policy reflecting the size of its net cash and investment securities. Third, net sales from networks, security, operational support, and support services after NEXT GIGA must become visible. If these points are confirmed, investors should find it easier to conclude that the forecast PER of 8.9 times is too low.
The investment issue over a three- to four-year horizon is whether the Company can overcome the cyclicality of public-sector ICT and raise its profit base as a data utilization company. Linkage between school data and local government systems, operational support for boards of education, meeting room and seat data at private companies, industry-specific ERP expansion, and more advanced license management for major companies will support medium-term growth. Each of these may appear unremarkable, but continuity increases as the Company becomes more deeply embedded in customer workplaces. Investors should value the cumulative growth generated from the existing customer base rather than conspicuous new businesses.
Viewed over this time horizon, the shares are not an investment aimed solely at short-term earnings upside. They are an investment in which shareholders receive a dividend yield of 3.5% while waiting for maintenance of ROE of 14.1% and the ROIC spread, reductions in strategic shareholdings, utilization of net cash, and continued growth in public- and private-sector ICT. The current share price reflects caution about lower profits from FY7/2027 onward, but if the baseline has risen, as the Company explains, the share price should move higher over the medium term.
14. Conclusion
The main message of this report is that Uchida Yoko’s shares are clearly valued cheaply relative to its solid business base and capital efficiency. Based on the concept of the 17th Medium-Term Management Plan, the Company is involved in resolving issues for schools, local governments, companies, and offices with people and data as its axis. It has the capacity to monetize special demand in public-sector ICT while raising its profit base through operational support, data utilization, private-sector ICT, and environmental construction that remain thereafter. Nevertheless, the forecast PER of 8.9 times and net-cash-adjusted PER of 5.9 times do not fully reflect the Company’s medium-term profit base.
Uchida Yoko is growing substantially in FY7/2026 through NEXT GIGA and the standardization of local government information systems. As a result, short-term caution about an earnings peak can weigh on investor sentiment and depress the share price. However, the essence of the Company is not a temporary increase in device sales. It has a business portfolio that combines ICT and environmental construction across private and public markets and is deeply embedded in customers’ workplaces. In the public market, it provides schools, universities, and local governments with an integrated offering of hardware, software, networks, security, operational support, support services, and staffing services. In the private market, software licenses for major companies, meeting room operations systems, ERP systems for small and medium-sized enterprises, and office environmental construction services form the revenue base. Through this business structure, special demand in public-sector ICT is not limited to temporary sales growth; it also serves as an entry point to address ongoing issues such as operational support, data utilization, and workplace redesign.
Headline indicators of a forecast PER of 8.9 times, actual PBR of 1.45 times, forecast ROE of 14.1%, and a dividend yield of 3.5% show that the shares do not price in excessive growth expectations. Furthermore, the net-cash-adjusted PER of 5.9 times and the adjusted PER of 4.0 times, including investment securities, indicate clear undervaluation after considering assets. Investment securities of 21.5 billion yen and net cash of 34.2 billion yen together account for 54.5% of the market capitalization. The fact that the Company is raising ROE and ROIC and expanding the ROIC spread while holding this level of assets deserves recognition.
The points to monitor in valuing the shares are also clear. The gross profit margin is declining, and the earnings yield on equity has remained low for many years. Public-sector ICT projects are subject to rebound declines, and local government information system standardization involves timing delays. Provisions for product warranties and human resource constraints also cannot be overlooked. The investment view on the shares should therefore not be based solely on short-term performance. More important are whether the baseline rises after special demand, whether public-sector ICT expands into operational support and data utilization, whether private-sector ICT grows steadily, and whether reductions in strategic shareholdings and enhancement of shareholder returns progress.
At present, considering these factors together, we assign a positive assessment suitable for medium- to long-term investment. The current share price of 2,075 yen is below the lower end of the estimated fair value range of 2,220-3,050 yen based on the PBR, DCF, and ROIC methods, and offers approximately 30% upside to the median of 2,700 yen. Over a one- to two-year investment horizon, the share price valuation may move higher as concerns about profit levels from FY7/2027 onward ease and expectations rise for capital policy that reflects net cash and investment securities. Over a three- to four-year horizon, investment returns will depend on whether public-sector ICT, local government data, education data, private-sector ICT, and SmartOfficeNavigator support the Company’s profit base and enable it to maintain high levels of ROE and ROIC.
Source: Company material
Key stock price data
Key financial data
| Unit: million yen | 2021/7 | 2022/7 | 2023/7 | 2024/7 | 2025/7 | 2026/7 Co. forecast |
| Sales | 291,035 | 221,856 | 246,549 | 277,940 | 337,055 | 421,000 |
| EBIT (Operating Income) | 10,335 | 7,775 | 8,423 | 9,292 | 12,149 | |
| Pretax Income | 10,976 | 7,965 | 9,200 | 10,280 | 14,479 | |
| Net Profit Attributable to Owner of Parent | 6,160 | 4,477 | 6,366 | 6,996 | 9,825 | 11,500 |
| Cash & Short-Term Investments | 46,265 | 30,344 | 29,696 | 30,804 | 27,372 | |
| Total assets | 135,494 | 125,503 | 133,008 | 150,753 | 174,917 | |
| Total Debt | 2,951 | 2,983 | 3,011 | 3,163 | 2,925 | |
| Net Debt | -43,314 | -27,361 | -26,685 | -27,641 | -24,447 | |
| Total liabilities | 85,287 | 79,383 | 80,883 | 85,963 | 104,109 | |
| Total Shareholders’ Equity | 45,282 | 45,719 | 51,897 | 64,541 | 70,548 | |
| Net Operating Cash Flow | 20,457 | -5,414 | 7,269 | 4,850 | 549 | |
| Capital Expenditure | 1,701 | 2,248 | 1,960 | 1,979 | 1,968 | |
| Net Investing Cash Flow | -1,134 | -2,198 | -4,857 | -1,816 | -1,027 | |
| Net Financing Cash Flow | -1,484 | -8,632 | -3,521 | -2,354 | -2,751 | |
| Free Cash Flow | 19,770 | -6,027 | 6,545 | 4,173 | -176 | |
| ROA (%) | 4.99 | 3.43 | 4.93 | 4.93 | 6.03 | |
| ROE (%) | 14.70 | 9.84 | 13.04 | 12.02 | 14.55 | |
| EPS (Yen) | 125.7 | 91.2 | 129.5 | 142.2 | 199.5 | 233.2 |
| BPS (Yen) | 923.6 | 930.2 | 1,055.1 | 1,311.4 | 1,431.9 | |
| Dividend per Share (Yen) | 28.00 | 28.00 | 38.00 | 44.00 | 60.00 | 72.00 |
| Shares Outstanding (Million shares) | 52.10 | 52.10 | 52.10 | 52.10 | 52.10 |
Source: Calculated by Omega Investment based on FactSet’s standard criteria, rounded to the nearest whole number.
Share price
Financial data (quarterly basis)
| Unit: million yen | 2024/7 | 2025/7 | 2026/7 | ||||||
| 3Q | 4Q | 1Q | 2Q | 3Q | 4Q | 1Q | 2Q | 3Q | |
| (Income Statement) | |||||||||
| Sales | 94,070 | 76,969 | 52,563 | 69,292 | 112,433 | 102,767 | 80,116 | 93,965 | 140,292 |
| Year-on-year | 11.3% | 13.4% | -1.2% | 29.0% | 19.5% | 33.5% | 52.4% | 35.6% | 24.8% |
| Cost of Goods Sold (COGS) | 78,023 | 66,540 | 41,679 | 57,443 | 94,260 | 91,286 | 67,049 | 80,686 | 119,217 |
| Gross Income | 16,047 | 10,429 | 10,884 | 11,849 | 18,173 | 11,481 | 13,067 | 13,279 | 21,075 |
| Gross Income Margin | 17.1% | 13.5% | 20.7% | 17.1% | 16.2% | 11.2% | 16.3% | 14.1% | 15.0% |
| SG&A Expense | 9,662 | 10,476 | 9,346 | 9,790 | 9,994 | 11,108 | 10,059 | 10,805 | 10,632 |
| EBIT (Operating Income) | 6,385 | -47 | 1,538 | 2,059 | 8,179 | 373 | 3,008 | 2,474 | 10,443 |
| Year-on-year | 3.6% | 11.9% | -48.5% | -25837.5% | 28.1% | -893.6% | 95.6% | 20.2% | 27.7% |
| Operating Income Margin | 6.8% | -0.1% | 2.9% | 3.0% | 7.3% | 0.4% | 3.8% | 2.6% | 7.4% |
| EBITDA | 6,856 | 451 | 1,986 | 2,536 | 8,695 | 882 | 3,507 | 3,014 | 11,035 |
| Pretax Income | 6,476 | 371 | 1,743 | 2,323 | 8,263 | 2,150 | 3,295 | 3,817 | 10,656 |
| Consolidated Net Income | 4,397 | 310 | 1,203 | 1,542 | 5,674 | 1,448 | 2,316 | 2,581 | 7,316 |
| Minority Interest | 25 | 16 | 0 | 2 | 23 | 17 | 4 | -1 | 31 |
| Net Income ATOP | 4,371 | 295 | 1,203 | 1,540 | 5,651 | 1,431 | 2,311 | 2,583 | 7,284 |
| Year-on-year | 3.8% | -39.0% | -46.2% | 1538.3% | 29.3% | 385.1% | 92.1% | 67.7% | 28.9% |
| Net Income Margin | 4.6% | 0.4% | 2.3% | 2.2% | 5.0% | 1.4% | 2.9% | 2.7% | 5.2% |
| (Balance Sheet) | |||||||||
| Cash & Short-Term Investments | 29,839 | 30,804 | 29,623 | 28,003 | 28,250 | 27,372 | 37,064 | 39,165 | 39,422 |
| Total assets | 165,602 | 150,753 | 133,681 | 149,733 | 186,584 | 174,917 | 173,718 | 209,774 | 214,931 |
| Total Debt | 3,710 | 3,163 | 6,432 | 6,066 | 6,460 | 2,925 | 6,396 | 6,145 | 6,452 |
| Net Debt | -26,129 | -27,641 | -23,191 | -21,937 | -21,790 | -24,447 | -30,668 | -33,020 | -32,970 |
| Total liabilities | 106,306 | 85,963 | 70,593 | 84,994 | 116,557 | 104,109 | 102,673 | 135,673 | 132,842 |
| Total Shareholders’ Equity | 59,061 | 64,541 | 62,871 | 64,520 | 69,786 | 70,548 | 70,814 | 73,871 | 81,828 |
| (Profitability %) | |||||||||
| ROA | 4.57 | 4.93 | 4.70 | 5.36 | 4.93 | 6.03 | 7.11 | 6.66 | 6.78 |
| ROE | 13.11 | 12.02 | 10.32 | 12.56 | 13.49 | 14.55 | 16.36 | 17.31 | 17.95 |
| (Per-share) Unit: JPY | |||||||||
| EPS | 88.8 | 6.0 | 24.4 | 31.3 | 114.7 | 29.0 | 46.9 | 52.4 | 147.7 |
| BPS | 1,200.0 | 1,311.4 | 1,276.0 | 1,309.5 | 1,416.4 | 1,431.9 | 1,435.8 | 1,497.8 | 1,659.1 |
| Dividend per Share | 0.00 | 44.00 | 0.00 | 0.00 | 0.00 | 60.00 | 0.00 | 0.00 | 0.00 |
| Shares Outstanding(million shares) | 52.10 | 52.10 | 52.10 | 52.10 | 52.10 | 52.10 | 52.10 | 52.10 | 52.10 |
Source: Calculated by Omega Investment based on FactSet’s standard criteria, rounded to the nearest whole number.
Financial data (full-year basis)
| Unit: million yen | 2016/7 | 2017/7 | 2018/7 | 2019/7 | 2020/7 | 2021/7 | 2022/7 | 2023/7 | 2024/7 | 2025/7 |
| (Income Statement) | ||||||||||
| Sales | 138,210 | 144,537 | 151,441 | 164,386 | 200,307 | 291,035 | 221,856 | 246,549 | 277,940 | 337,055 |
| Year-on-year | -1.2% | 4.6% | 4.8% | 8.5% | 21.9% | 45.3% | -23.8% | 11.1% | 12.7% | 21.3% |
| Cost of Goods Sold | 104,987 | 111,123 | 117,957 | 128,969 | 160,438 | 245,976 | 180,373 | 203,259 | 231,483 | 285,953 |
| Gross Income | 33,223 | 33,414 | 33,484 | 35,417 | 39,869 | 45,059 | 41,483 | 43,290 | 46,457 | 51,102 |
| Gross Income Margin | 24.0% | 23.1% | 22.1% | 21.5% | 19.9% | 15.5% | 18.7% | 17.6% | 16.7% | 15.2% |
| SG&A Expense | 29,787 | 30,474 | 30,603 | 31,669 | 32,626 | 34,724 | 33,708 | 34,867 | 37,165 | 38,953 |
| EBIT (Operating Income) | 3,436 | 2,940 | 2,881 | 3,748 | 7,243 | 10,335 | 7,775 | 8,423 | 9,292 | 12,149 |
| Year-on-year | -5.1% | -14.4% | -2.0% | 30.1% | 93.2% | 42.7% | -24.8% | 8.3% | 10.3% | 30.7% |
| Operating Income Margin | 2.5% | 2.0% | 1.9% | 2.3% | 3.6% | 3.6% | 3.5% | 3.4% | 3.3% | 3.6% |
| EBITDA | 4,893 | 4,669 | 4,835 | 5,737 | 9,386 | 12,652 | 9,598 | 10,320 | 11,177 | 14,099 |
| Pretax Income | 3,574 | 3,352 | 3,198 | 4,137 | 6,618 | 10,976 | 7,965 | 9,200 | 10,280 | 14,479 |
| Consolidated Net Income | 2,393 | 2,252 | 2,085 | 2,707 | 4,142 | 7,405 | 4,857 | 6,421 | 7,042 | 9,867 |
| Minority Interest | 148 | 286 | 253 | 291 | 651 | 1,244 | 380 | 54 | 46 | 42 |
| Net Income ATOP | 2,245 | 1,965 | 1,831 | 2,415 | 3,490 | 6,160 | 4,477 | 6,366 | 6,996 | 9,825 |
| Year-on-year | 576.2% | -12.5% | -6.8% | 31.9% | 44.5% | 76.5% | -27.3% | 42.2% | 9.9% | 40.4% |
| Net Income Margin | 1.6% | 1.4% | 1.2% | 1.5% | 1.7% | 2.1% | 2.0% | 2.6% | 2.5% | 2.9% |
| (Balance Sheet) | ||||||||||
| Cash & Short-Term Investments | 24,659 | 26,143 | 18,871 | 19,817 | 28,453 | 46,265 | 30,344 | 29,696 | 30,804 | 27,372 |
| Total assets | 91,441 | 95,260 | 89,410 | 102,685 | 111,264 | 135,494 | 125,503 | 133,008 | 150,753 | 174,917 |
| Total Debt | 7,641 | 6,923 | 4,098 | 2,730 | 2,943 | 2,951 | 2,983 | 3,011 | 3,163 | 2,925 |
| Net Debt | -17,018 | -19,220 | -14,773 | -17,087 | -25,510 | -43,314 | -27,361 | -26,685 | -27,641 | -24,447 |
| Total liabilities | 57,661 | 58,122 | 52,004 | 63,500 | 68,947 | 85,287 | 79,383 | 80,883 | 85,963 | 104,109 |
| Total Shareholders’ Equity | 31,247 | 34,338 | 34,432 | 35,984 | 38,531 | 45,282 | 45,719 | 51,897 | 64,541 | 70,548 |
| (Cash Flow) | ||||||||||
| Net Operating Cash Flow | 6,904 | 4,610 | -2,476 | 5,543 | 11,320 | 20,457 | -5,414 | 7,269 | 4,850 | 549 |
| Capital Expenditure | 2,074 | 2,065 | 2,045 | 1,457 | 1,688 | 1,701 | 2,248 | 1,960 | 1,979 | 1,968 |
| Net Investing Cash Flow | -2,267 | -1,977 | -2,091 | -2,280 | -1,600 | -1,134 | -2,198 | -4,857 | -1,816 | -1,027 |
| Net Financing Cash Flow | -1,551 | -1,582 | -2,861 | -2,395 | -1,200 | -1,484 | -8,632 | -3,521 | -2,354 | -2,751 |
| Free Cash Flow | 6,356 | 3,935 | -3,204 | 5,138 | 10,672 | 19,770 | -6,027 | 6,545 | 4,173 | -176 |
| (Profitability ) | ||||||||||
| ROA (%) | 2.45 | 2.11 | 1.98 | 2.52 | 3.26 | 4.99 | 3.43 | 4.93 | 4.93 | 6.03 |
| ROE (%) | 6.87 | 6.00 | 5.33 | 6.86 | 9.37 | 14.70 | 9.84 | 13.04 | 12.02 | 14.55 |
| Net Margin (%) | 1.62 | 1.36 | 1.21 | 1.47 | 1.74 | 2.12 | 2.02 | 2.58 | 2.52 | 2.91 |
| Asset Turn | 1.51 | 1.55 | 1.64 | 1.71 | 1.87 | 2.36 | 1.70 | 1.91 | 1.96 | 2.07 |
| Assets/Equity | 2.80 | 2.85 | 2.69 | 2.73 | 2.87 | 2.94 | 2.87 | 2.65 | 2.44 | 2.41 |
| (Per-share) Unit: JPY | ||||||||||
| EPS | 44.6 | 39.1 | 37.2 | 49.4 | 71.3 | 125.7 | 91.2 | 129.5 | 142.2 | 199.5 |
| BPS | 621.2 | 682.8 | 704.2 | 736.0 | 787.4 | 923.6 | 930.2 | 1,055.1 | 1,311.4 | 1,431.9 |
| Dividend per Share | 14.00 | 15.00 | 15.00 | 18.00 | 24.00 | 28.00 | 28.00 | 38.00 | 44.00 | 60.00 |
| Shares Outstanding (million shares) | 52.10 | 52.10 | 52.10 | 52.10 | 52.10 | 52.10 | 52.10 | 52.10 | 52.10 | 52.10 |
Source: Calculated by Omega Investment based on FactSet’s standard criteria, rounded to the nearest whole number.