2026-10-23
Home
Japanese

Omega Investment Co., Ltd.
Human Creation Holdings (Investment report – 3Q catch up)
| Share price (11/5) | ¥1,037 | Dividend Yield (26/9 CE) | 4.3 % |
| 52weeks high/low | ¥1,430/983 | ROE (25/9) | 28.0 % |
| Avg Vol (3 month) | 8.4 thou shrs | Operating margin (25/9) | 8.7 % |
| Market Cap | ¥3.70 bn | Beta (5Y Monthly) | 0.39 |
| Enterprise Value | ¥3.48 bn | Shares Outstanding | 3.573 mn shrs |
| PER (26/9 CE) | – X | Listed market | TSE Growth |
| PBR (25/9 act) | 2.1 X |
| Click here for the PDF version of this page |
| PDF version |
The earnings forecast revision marks a turning point in the investment assessment. Greater certainty of profit growth and a stronger management foundation will be key to a reappraisal.
1. Investment conclusion
The October 15 disclosures materially weakened the previous investment case. We retain the stock as a medium- to long-term investment candidate, but now place greater weight on margin recovery and improvements in internal controls
On October 15, the Company revised down its FY9/2026 full-year forecast. Net sales were cut from 10.005 billion yen to 9.432 billion yen and operating profit from 785 million yen to 420 million yen. At its consolidated subsidiary HC Financial Advisor, the time required to close transactions lengthened, with some projects shifting to the following fiscal year and others failing to close. In addition, the Company expects to record a 400 million yen extraordinary loss related to a transaction at its consolidated subsidiary Cosmopia, turning the forecast profit attributable to owners of parent from 436 million yen into a loss of 184 million yen. The profit recovery scenario assumed to date therefore requires revision.
The Company also announced an FY9/2027 forecast of 11.0 billion yen in net sales, 470 million yen in operating profit, 265 million yen in profit attributable to owners of parent, and EPS of 85.04 yen. This represents higher sales and profit versus the revised FY9/2026 forecast, but the operating margin is only 4.3%, slightly below 4.5% in the revised FY9/2026 forecast and well below 8.7% in FY9/2025. FY9/2027 should therefore be viewed as a year for rebuilding the earnings base while reducing dependence on HCFA, rather than a year of sharp profit recovery.
At the October 22 closing price of 1,068 yen, the forecast PER based on FY9/2027 EPS of 85.04 yen is 12.6x, while the PBR based on FY9/2025 actual BPS of 494.8 yen is 2.16x. PER is not meaningful for FY9/2026 because the Company forecasts a net loss. On October 16, the share price fell to a year-to-date low of 983 yen, closed at 1,078 yen, and trading volume surged to 86.9 thousand shares, approximately 6.3 times the previous day. The October 22 closing price is 8.2% below the October 15 pre-disclosure close of 1,163 yen. The market impact was substantial, and we believe that both the profit plan and internal controls were reassessed, rather than only the one-off extraordinary loss.
Over the medium to long term, the stable SES earnings base and growth opportunities in BaaS and LIFE SHIELD remain. However, the decline in the share price alone is not sufficient grounds to increase exposure aggressively at this stage. Over one to two years, we would like to see an improvement in operating margin, lower dependence on HCFA, progress in recovering losses related to the Cosmopia transaction, and effective recurrence-prevention measures. Over three to four years, the key issue is whether the strategic domains can generate stable profit and free cash flow.
2. Evaluation of 3Q results
Profit improved sequentially in 3Q, but the subsequent downward revision confirmed a material decline in full-year earning power
In 3Q alone, net sales were 2.297 billion yen, up 3.2% year on year, and operating profit was 106 million yen, down 37.2%. This was an improvement from the 14 million yen operating loss in 2Q, and the operating margin recovered from negative 0.6% to 4.6%. The gross margin also improved from 24.3% to 27.2%, providing some evidence at the 3Q stage that profit could recover as upfront investment ran its course.
However, the October 15 disclosure confirmed that HCFA would fall below the original assumptions in both the number of transactions closed and net sales, and the full-year operating profit forecast was cut to 420 million yen. The sequential recovery in 3Q alone is therefore insufficient to support a return to the 8.7% operating margin recorded in FY9/2025. The Cosmopia extraordinary loss does not affect operating profit, but it turns the bottom line into a loss and has also damaged equity-market confidence in the Group’s internal control framework.
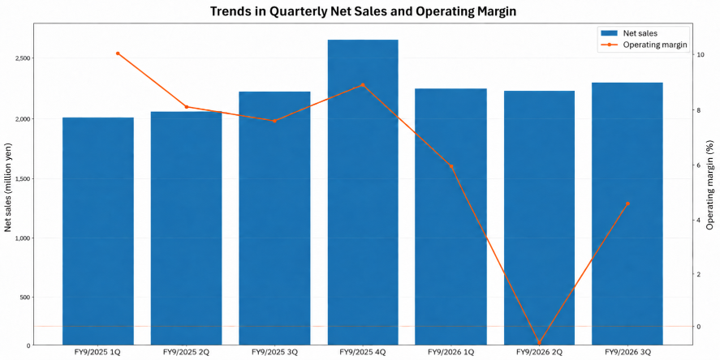
Source: Prepared by Omega Investment based on FactSet and the Company’s earnings presentation materials
Growth potential remains in the rollout of common products, including BaaS, to the SMB market and in moving SES human capital to upstream processes. However, after the October 15 forecast revision, sales growth in the strategic domains alone is no longer sufficient to support the investment case. The Company needs to convert orders in the strategic domains into operating profit and cash flow, turn BaaS investment into recurring projects, and link recruitment and training to higher unit prices.
Overseas business is not yet at a stage where it should be factored in as an independent growth driver. The main focus remains domestic IT and DX demand, the SES human capital base, and monetization of the strategic domains. The FY9/2027 forecast explicitly calls for lower profit dependence on HCFA, so we place greater weight on BaaS expansion in the domestic SMB market, cross-selling from consulting to maintenance and operations, and profitability improvements at LIFE SHIELD.
3. Analysis by business
SES unit prices continue to rise, while delays in monetizing the strategic domains have become more visible
In the first nine months, SES net sales were 4.099 billion yen, up 3.2% year on year, while net sales in the strategic domains were 2.675 billion yen, up 15.1%. The strategic domains continued to drive sales growth, but at HCFA the time required to close transactions was longer than expected, some projects shifted to the following fiscal year, and others did not close. The downward revision made clearer the difficulty of converting sales growth in the strategic domains into Company-wide profit.
In SES, the number of active personnel decreased quarter on quarter due to a strategic review of personnel allocation, while the monthly contract unit price rose to 700,000 yen, up 3.7% year on year and 2.2% quarter on quarter. The FY9/2027 forecast also assumes improved profitability in SES. The key will be whether the Company can restore active personnel after reallocation while maintaining unit prices in the 700,000 yen range.
At its subsidiary ACF, upfront BaaS development investment has run its course and new projects are being acquired. The relevant KPIs are not the number of products or business discussions but the number of companies implementing the product, recurring projects, gross margin, and expansion into maintenance and operations. With the FY9/2027 operating profit forecast limited to 470 million yen, visible monetization of BaaS will be necessary for a recovery in share price valuation.
4. Growth drivers for FY9/2027
Higher sales and profit are forecast, but margins remain low. The focus shifts from a sharp rebound to rebuilding the earnings base
The Company forecasts FY9/2027 net sales of 11.0 billion yen, operating profit of 470 million yen, ordinary profit of 450 million yen, profit attributable to owners of parent of 265 million yen, and EPS of 85.04 yen. Compared with the revised FY9/2026 forecast, net sales are expected to rise 16.6% and operating profit 11.9%, but the operating margin is only 4.3%, well below 8.7% in FY9/2025. The assumption of a strong profit recovery in FY9/2027 therefore needs to be revised downward.
The Company plans to reduce profit dependence on HCFA while expanding earnings in other strategic domains, benefiting from a full-year contribution from LIFE SHIELD and improving SES profitability. The FY9/2027 forecast does not include the impact of any new M&A to be executed in the future. The key issue is no longer recovery driven by a single large project, but whether multiple businesses can build repeatable earnings.
For BaaS, the key is conversion to recurring projects after the end of upfront investment. At LIFE SHIELD, recruitment capacity, utilization, and operational efficiency will determine the improvement in earnings. Although the scale of sales is expected to increase, the FY9/2027 forecast does not yet indicate an improvement in operating margin. Therefore, in the next fiscal year, we would like to place greater emphasis on improvements in gross margin, operating margin, and operating cash flow than on sales growth.
5. Full-year plan and earnings outlook
FY9/2026 was revised down sharply, while the FY9/2027 profit recovery forecast remains limited
The revised FY9/2026 forecast is net sales of 9.432 billion yen, operating profit of 420 million yen, ordinary profit of 408 million yen, a loss attributable to owners of parent of 184 million yen, and EPS of negative 59.52 yen. The operating profit revision mainly reflects delayed and unsuccessful transaction closings at HCFA, while the bottom line also includes a 400 million yen extraordinary loss related to the Cosmopia transaction. Operating profit will decline sharply from 782 million yen in FY9/2025, leaving the rebuilding of profitability as the central issue.
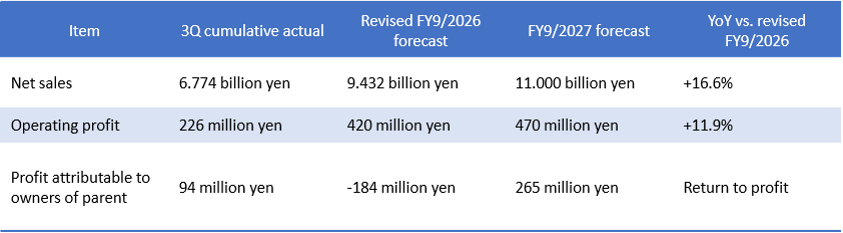
Source: Prepared by Omega Investment based on the Company’s earnings presentation materials and FactSet
The revised FY9/2026 forecast still calls for net sales growth of 5.4% year on year, but operating profit is expected to decline 46.3%, bringing the operating margin down to 4.5%. FY9/2027 calls for 16.6% sales growth and 11.9% operating profit growth, but the operating margin is 4.3%. The gap between top-line expansion and margin recovery therefore remains.
In the Cosmopia transaction, as much as 400 million yen may be unrecoverable, and the recoverable amount cannot currently be estimated reasonably. The Company has reflected the full amount as an extraordinary loss and is pursuing civil and criminal measures together with a review of internal controls. As the FY9/2027 forecast excludes new M&A, investors should focus more on profitability, cash generation, and internal-control improvements in existing businesses than on sales scale.
6. Finance, cash flow, and capital efficiency
Five consecutive years of positive FCF remain a strength, but the 400 million yen recovery risk requires a more conservative view of financial flexibility
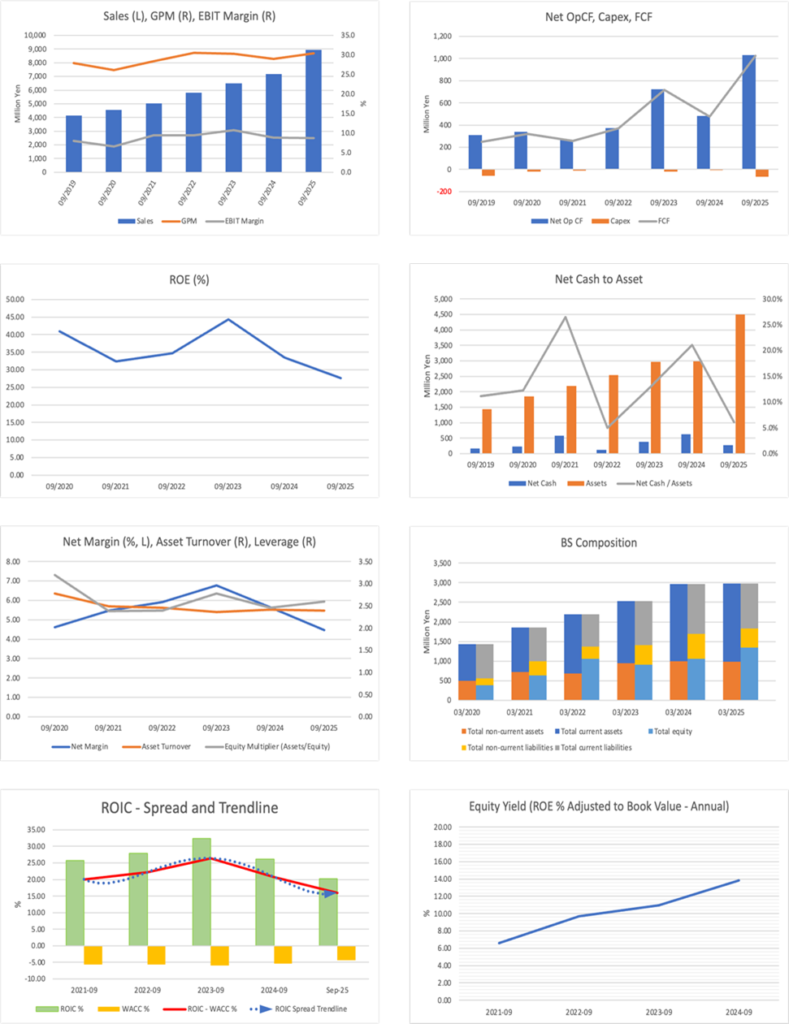
The Company generated positive free cash flow for five consecutive fiscal years from FY9/2021 through FY9/2025, with cumulative FCF of 2.773 billion yen. Its asset-light business structure, which does not require large-scale facilities and can convert profit into cash relatively efficiently, remains a positive feature. However, operating profit for FY9/2026 has been revised down significantly, and caution is needed in simply extrapolating the Company’s past cash-generating capacity into the future.
At the end of June 2026, cash and deposits were 956 million yen and interest-bearing debt was 854 million yen, resulting in net cash of 102 million yen. The Cosmopia transactions occurred in August and September and are therefore not reflected in the 3Q balance sheet. The maximum unrecovered amount of 400 million yen is nearly four times the 3Q-end net cash position and approximately 26% of FY9/2025 year-end shareholders’ equity of 1.530 billion yen. If the full amount cannot be recovered, the financial impact would be material and financial flexibility should be assessed more conservatively than before.
The Company maintained its FY9/2026 year-end dividend forecast of 45 yen. The commitment to shareholder returns is positive, but the payout ratio is not meaningful in a fiscal year with a forecast net loss. Going forward, we would like to monitor recovery of the loss, operating cash flow, liquidity, and the balance between shareholder returns and M&A investment.
ROIC is likely to remain under pressure from lower profit and prior investment. The FY9/2027 forecast for profit attributable to owners of parent is 265 million yen, below the FY9/2025 actual figure of 398 million yen. A recovery in capital efficiency will require the Company to increase operating profit and cash flow from invested capital, including BaaS and LIFE SHIELD.
7. Shareholder composition and share price trends
The share price hit a year-to-date low after the October 15 disclosures. The downward revision and internal-control risk have pushed the short-term trend lower
According to FactSet data, Hikari Tsushin’s ownership ratio was 13.80%, with holdings of 493 thousand shares, an increase of 187 thousand shares over the past six months. The HCH Group employee stock ownership plan holds 7.08%, NS Solutions 4.39%, and President Kuniaki Tominaga 3.53%. Institutional investor ownership remains only 0.95%, and institutional investors account for 1.8% of the floating shares.
Hikari Tsushin’s additional purchases may support supply and demand, but they have not been sufficient to absorb selling after the October 15 disclosures. Because the institutional investor base is thin and market capitalization is small, uncertainty over earnings visibility and internal controls can have an outsized impact on the share price. Going forward, not only margin recovery but also recurrence-prevention measures and continuity of disclosure will be important for broadening the investor base.
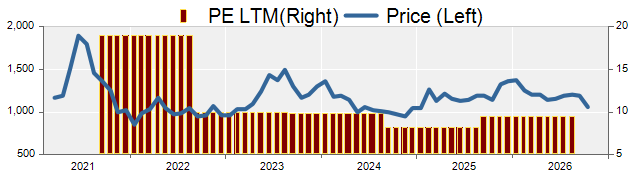
The share price closed at 1,163 yen on October 15, fell to a year-to-date low of 983 yen on October 16, and closed that day at 1,078 yen. Trading volume surged to 86.9 thousand shares from 13.7 thousand shares the previous day, approximately 6.3 times the previous day’s level. The October 22 close was 1,068 yen, 8.2% below the pre-disclosure close. The share price has broken clearly below the approximately 1,200 yen level seen at the end of September, leaving the short-term trend downward.
8. Share price valuation
PER is not meaningful for FY9/2026 because of the forecast net loss. A FY9/2027 PER of 12.6 times does not make the stock clearly inexpensive solely because the share price has fallen
At a share price of 1,068 yen, the forecast PER based on FY9/2027 EPS of 85.04 yen is 12.6 times. The PBR based on FY9/2025 actual BPS of 494.8 yen is 2.16times, while the dividend yield based on the FY9/2026 forecast dividend of 45 yen is 4.2%. FY9/2026 forecast EPS is negative 59.52 yen, making PER meaningless. FY9/2027 forecast EPS is also 32.5% below the FY9/2025 actual EPS of 126.0 yen, so the post-decline share price cannot be described as extremely undervalued relative to the lower earnings base.
In addition, the 400 million yen extraordinary loss expected in FY9/2026 means that PBR calculated using FY9/2025 BPS does not yet reflect the reduction in equity at the end of the current fiscal year. In assessing the share price valuation, we would like to place priority on whether the operating margin recovers from FY9/2027 onward and whether progress is made in recovering losses from the Cosmopia transaction and improving internal controls, rather than on the low share price itself.
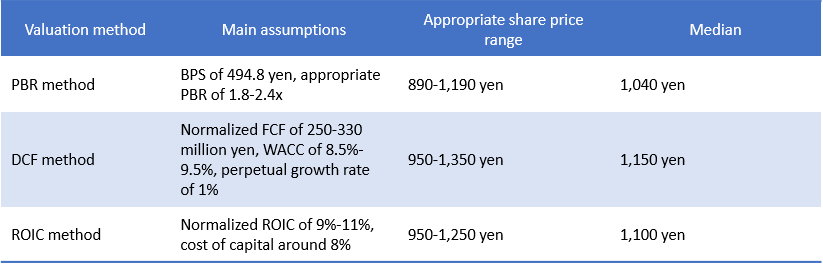
Source: Omega Investment estimates. Previous valuation assumptions were revised to reflect the FY9/2026 extraordinary loss and the FY9/2027 Company forecast.
The medians are 1,040 yen under the PBR method, 1,150 yen under the DCF method, and 1,100 yen under the ROIC method, with the median across the three methods at approximately 1,100 yen. This is only slightly above the October 22 closing price of 1,068 yen, and the three valuation methods do not indicate clear upside potential. Although the share price has declined sharply, the earnings outlook has also been revised down, so the entire decline cannot be interpreted as increased undervaluation.
9. Future focus points for investment in the Company’s shares
The focus shifts to rebuilding profit margins and restoring confidence in internal controls
The most important issue is not simply whether FY9/2027 delivers higher sales and profit. The Company forecasts operating profit of 470 million yen on net sales of 11.0 billion yen, indicating that margins remain low. We need to confirm a structure in which other strategic domains, SES, and LIFE SHIELD can steadily build up profit and cash flow while reducing dependence on HCFA.
First, whether HCFA can improve the quality of its pipeline and the certainty of transaction closings. Second, whether recurring BaaS projects accumulate after upfront investment ends and ACF’s gross margin improves. Third, whether LIFE SHIELD can strengthen recruitment and utilization. Fourth, whether SES can restore active personnel while maintaining monthly contract unit prices in the 700,000 yen range. Fifth, whether the Group can recover losses related to the Cosmopia transaction and make recurrence-prevention measures involving credit management and authorization checks effective.
The Company retains strengths in its stable SES earnings base, five consecutive years of positive FCF, and growth potential in the strategic domains. On the other hand, the downward revision and the loss related to the improper transaction conducted by an employee of a business partner have lowered the market’s assessment of earnings visibility and internal controls. We continue to regard the Company as a medium- to long-term investment candidate, but do not view the current situation as one in which exposure should be increased solely because of the decline in the share price. If a recovery in operating margin and improvements in internal controls are confirmed, there will be room for a reappraisal of the share price valuation, while if improvements do not progress, the current low valuation would be justified.
Notes
- Financial data are based in principle on FactSet standardized data and therefore may not fully match the presentation items, reclassifications, rounding, or business-level disclosures in company materials. Company materials take precedence for business-level figures, KPIs, medium-term plans, and capital-allocation policies.
- Fair values are Omega Investment estimates based on certain assumptions and do not guarantee future share prices or corporate value. Because DCF tends to produce a higher value than the other methods when net cash represents a large share of value, it is not used as a stand-alone price target.
Key stock price data
Company overview
◇ Expanding business domains from a foundation of stable earnings from SES into consulting and contract development, as well as healthcare and nursing-care staffing
Human Creation Holdings, Inc. is a solutions integrator that seeks to address clients’ management issues, with IT as its core. It was established in October 2016, while its predecessor company was founded in 1974. Under a pure holding company structure, it has operating subsidiaries and positions engineer-staffing SES as a stable earnings base, while developing consulting, contract development, maintenance and operations, and M&A advisory as strategic domains. In July 2026, LIFE SHIELD became a wholly owned subsidiary, marking the Company’s entry into the social solutions business, which provides staffing services for nurses, caregivers, and other professionals.
A distinctive feature of the business model is that it starts with human capital and customer touchpoints built through SES and connects upstream consulting through development, maintenance, and operations within the Group. In SES, the number of active personnel, utilization rate, and contract unit price drive earnings, while in the strategic domains, project unit prices, order volume, profit margins, and conversion into recurring projects are important. The Company is expanding DX support for SMBs using the BaaS product Amane as a common platform and advancing the transition to an earnings structure that is not overly dependent on individual contract development.
The Company’s strengths lie in its ability to combine its IT human capital supply capacity and on-site implementation capabilities with specialized functions added through M&A according to customer issues. Going forward, the focus for enhancing corporate value will be whether the Company can link BaaS, M&A support, and healthcare and nursing-care staffing to profit growth while maintaining increases in SES unit prices.
Key financial data
| Unit: million yen | 2021 | 2022 | 2023 | 2024 | 2025 | 2026 CE |
| Sales | 5,035 | 5,803 | 6,487 | 7,166 | 8,946 | 9,432 |
| EBIT (Operating Income) | 478 | 545 | 698 | 631 | 782 | 420 |
| Pretax Income | 464 | 546 | 701 | 630 | 684 | |
| Net Profit Attributable to Owner of Parent | 276 | 343 | 438 | 404 | 398 | -184 |
| Cash & Short-Term Investments | 846 | 673 | 1,020 | 1,003 | 1,417 | |
| Total assets | 2,192 | 2,536 | 2,963 | 2,978 | 4,496 | |
| Total Debt | 266 | 546 | 641 | 376 | 1,143 | |
| Net Debt | -580 | -127 | -379 | -627 | -274 | |
| Total liabilities | 1,128 | 1,620 | 1,901 | 1,625 | 2,965 | |
| Total Shareholders’ Equity | 1,064 | 916 | 1,062 | 1,353 | 1,530 | |
| Net Operating Cash Flow | 268 | 373 | 723 | 481 | 1,030 | |
| Capital Expenditure | 11 | 3 | 17 | 7 | 64 | |
| Net Investing Cash Flow | -52 | -335 | -169 | -3 | -896 | |
| Net Financing Cash Flow | 44 | -212 | -206 | -496 | 282 | |
| Free Cash Flow | 257 | 370 | 717 | 475 | 1,023 | |
| ROA (%) | 13.63 | 14.51 | 15.95 | 13.60 | 10.66 | |
| ROE (%) | 32.43 | 34.65 | 44.34 | 33.47 | 27.64 | |
| EPS (Yen) | 71.6 | 94.6 | 132.4 | 123.1 | 126.0 | -59.5 |
| BPS (Yen) | 276.2 | 265.6 | 324.1 | 415.9 | 494.8 | |
| Dividend per Share (Yen) | 24.49 | 25.00 | 25.50 | 26.00 | 27.00 | 45.00 |
| Shares Outstanding (Million shares) | 3.85 | 3.85 | 3.85 | 3.57 | 3.57 |
Source: Calculated by Omega Investment based on FactSet’s standard criteria, rounded to the nearest whole number.
Share price
Financial data (quarterly basis)
| Unit: million yen | 2024/9 | 2025/9 | 2026/9 | ||||||
| 3Q | 4Q | 1Q | 2Q | 3Q | 4Q | 1Q | 2Q | 3Q | |
| (Income Statement) | |||||||||
| Sales | 1,845 | 1,902 | 2,013 | 2,058 | 2,227 | 2,647 | 2,246 | 2,231 | 2,297 |
| Year-on-year | 10.4% | 16.6% | 22.1% | 16.3% | 20.7% | 39.2% | 11.6% | 8.4% | 3.2% |
| Cost of Goods Sold (COGS) | 1,295 | 1,346 | 1,421 | 1,473 | 1,566 | 1,769 | 1,611 | 1,688 | 1,673 |
| Gross Income | 550 | 557 | 592 | 585 | 661 | 879 | 635 | 543 | 624 |
| Gross Income Margin | 29.8% | 29.3% | 29.4% | 28.4% | 29.7% | 33.2% | 28.3% | 24.3% | 27.2% |
| SG&A Expense | 369 | 383 | 380 | 419 | 492 | 644 | 501 | 557 | 518 |
| EBIT (Operating Income) | 180 | 173 | 212 | 166 | 169 | 235 | 134 | -14 | 106 |
| Year-on-year | -4.5% | -1.8% | 51.7% | 22.7% | -6.4% | 35.7% | -36.9% | -108.2% | -37.2% |
| Operating Income Margin | 9.8% | 9.1% | 10.6% | 8.1% | 7.6% | 8.9% | 6.0% | -0.6% | 4.6% |
| EBITDA | 212 | 206 | 245 | 200 | 221 | 291 | 190 | 42 | 162 |
| Pretax Income | 182 | 174 | 212 | 87 | 166 | 219 | 124 | -10 | 99 |
| Consolidated Net Income | 110 | 113 | 132 | 42 | 92 | 133 | 53 | -35 | 77 |
| Minority Interest | 0 | 0 | 0 | 0 | 0 | 0 | 0 | 0 | 0 |
| Net Income ATOP | 110 | 113 | 132 | 42 | 92 | 133 | 53 | -35 | 77 |
| Year-on-year | -12.9% | 22.4% | 48.3% | -54.4% | -16.6% | 17.3% | -60.2% | -184.8% | -15.8% |
| Net Income Margin | 6.0% | 6.0% | 6.6% | 2.0% | 4.1% | 5.0% | 2.3% | -1.6% | 3.4% |
| (Balance Sheet) | |||||||||
| Cash & Short-Term Investments | 1,122 | 1,003 | 938 | 1,417 | 1,159 | 1,417 | 957 | 853 | 956 |
| Total assets | 3,035 | 3,051 | 3,004 | 4,496 | 4,355 | 4,511 | 4,052 | 3,983 | 4,079 |
| Total Debt | 425 | 376 | 326 | 1,143 | 1,322 | 1,143 | 994 | 924 | 855 |
| Net Debt | -697 | -627 | -612 | -274 | 163 | -274 | 36 | 71 | -102 |
| Total liabilities | 1,764 | 1,698 | 1,602 | 2,965 | 2,948 | 2,980 | 2,547 | 2,483 | 2,507 |
| Total Shareholders’ Equity | 1,271 | 1,353 | 1,402 | 1,530 | 1,408 | 1,530 | 1,505 | 1,500 | 1,572 |
| (Profitability %) | |||||||||
| ROA | 12.70 | 13.44 | 15.43 | 10.60 | 10.25 | 10.54 | 9.04 | 5.70 | 5.39 |
| ROE | 33.76 | 33.47 | 35.79 | 28.99 | 28.28 | 27.64 | 21.94 | 15.95 | 15.25 |
| (Per-share) Unit: JPY | |||||||||
| EPS | 33.4 | 34.7 | 40.6 | 13.3 | 29.6 | 42.9 | 17.0 | -11.4 | 24.8 |
| BPS | 387.1 | 415.9 | 431.0 | 486.4 | 455.1 | 494.8 | 486.7 | 481.8 | 504.9 |
| Dividend per Share | 0.00 | 26.00 | 0.00 | 0.00 | 0.00 | 27.00 | 0.00 | 0.00 | 0.00 |
| Shares Outstanding (million shares) | 3.85 | 3.85 | 3.57 | 3.57 | 3.57 | 3.57 | 3.57 | 3.57 | 3.57 |
Source: Calculated by Omega Investment based on FactSet’s standard criteria, rounded to the nearest whole number.
Financial data (full-year basis)
| Unit: million yen | 2021/9 | 2022/9 | 2023/9 | 2024/9 | 2025/9 |
| (Income Statement) | |||||
| Sales | 5,035 | 5,803 | 6,487 | 7,166 | 8,946 |
| Year-on-year | 10.3% | 15.3% | 11.8% | 10.5% | 24.8% |
| Cost of Goods Sold | 3,607 | 4,030 | 4,522 | 5,087 | 6,228 |
| Gross Income | 1,428 | 1,773 | 1,965 | 2,079 | 2,717 |
| Gross Income Margin | 28.4% | 30.6% | 30.3% | 29.0% | 30.4% |
| SG&A Expense | 950 | 1,228 | 1,267 | 1,448 | 1,935 |
| EBIT (Operating Income) | 478 | 545 | 698 | 631 | 782 |
| Year-on-year | 57.5% | 14.0% | 28.0% | -9.6% | 23.9% |
| Operating Income Margin | 9.5% | 9.4% | 10.8% | 8.8% | 8.7% |
| EBITDA | 558 | 659 | 813 | 754 | 954 |
| Pretax Income | 464 | 546 | 701 | 630 | 684 |
| Consolidated Net Income | 276 | 343 | 438 | 404 | 398 |
| Minority Interest | 0 | 0 | 0 | 0 | 0 |
| Net Income ATOP | 276 | 343 | 438 | 404 | 398 |
| Year-on-year | 31.2% | 24.3% | 27.8% | -7.8% | -1.4% |
| Net Income Margin | 5.5% | 5.9% | 6.8% | 5.6% | 4.5% |
| (Balance Sheet) | |||||
| Cash & Short-Term Investments | 846 | 673 | 1,020 | 1,003 | 1,417 |
| Total assets | 2,192 | 2,536 | 2,963 | 2,978 | 4,496 |
| Total Debt | 266 | 546 | 641 | 376 | 1,143 |
| Net Debt | -580 | -127 | -379 | -627 | -274 |
| Total liabilities | 1,128 | 1,620 | 1,901 | 1,625 | 2,965 |
| Total Shareholders’ Equity | 1,064 | 916 | 1,062 | 1,353 | 1,530 |
| (Cash Flow) | |||||
| Net Operating Cash Flow | 268 | 373 | 723 | 481 | 1,030 |
| Capital Expenditure | 11 | 3 | 17 | 7 | 64 |
| Net Investing Cash Flow | -52 | -335 | -169 | -3 | -896 |
| Net Financing Cash Flow | 44 | -212 | -206 | -496 | 282 |
| Free Cash Flow | 257 | 370 | 717 | 475 | 1,023 |
| (Profitability ) | |||||
| ROA (%) | 13.63 | 14.51 | 15.95 | 13.60 | 10.66 |
| ROE (%) | 32.43 | 34.65 | 44.34 | 33.47 | 27.64 |
| Net Margin (%) | 5.48 | 5.91 | 6.76 | 5.64 | 4.45 |
| Asset Turn | 2.49 | 2.45 | 2.36 | 2.41 | 2.39 |
| Assets/Equity | 2.38 | 2.39 | 2.78 | 2.46 | 2.59 |
| (Per-share) Unit: JPY | |||||
| EPS | 71.6 | 94.6 | 132.4 | 123.1 | 126.0 |
| BPS | 276.2 | 265.6 | 324.1 | 415.9 | 494.8 |
| Dividend per Share | 24.49 | 25.00 | 25.50 | 26.00 | 27.00 |
| Shares Outstanding (million shares) | 3.85 | 3.85 | 3.85 | 3.57 | 3.57 |
Source: Calculated by Omega Investment based on FactSet’s standard criteria, rounded to the nearest whole number.