2026-07-27
Home
Japanese

Omega Investment Co., Ltd.
TAKARA & COMPANY (Investment report – 3Q update)
| Share price (4/9) | ¥3,810 | Dividend Yield (26/5 CE) | 3.2 % |
| 52weeks high/low | ¥3,005/4,795 | ROE(25/5 act) | 14.1 % |
| Avg Vol (3 month) | 32.5 thou shrs | Operating margin (25/5 act) | 13.6 % |
| Market Cap | ¥50.11 bn | Beta (5Y Monthly) | 0.4 |
| Enterprise Value | ¥33.59 bn | Shares Outstanding | 13.153 mn shrs |
| PER (26/5 CE) | 15.9 X | Listed market | TSE Prime section |
| PBR (25/5 act) | 1.6 X |
| Click here for the PDF version of this page |
| PDF version |
Stable earnings and substantial net cash are attractive. The monetization of AI implementation will determine the future share price valuation.
Conclusion
Continue holding. If not held, a new position can be considered.
The current investment conclusion for TAKARA & COMPANY LTD. (the “Company”) is that continuing to hold is the basic stance. If not held, it is also sufficiently rational to take a new position. Cumulative 3Q results secured higher sales and profits, and the full-year plan was maintained. The investment attractions of stable earnings, a high dividend, and substantial net cash have not changed.
In addition to the outlook for continuing the 120-yen dividend, it is commendable that AI-related services have progressed to the implementation phase. However, quantitative disclosure regarding the clarification of capital policy and monetization of AI remains insufficient. Therefore, continuing to hold is reasonable, but it is still too early to decide to strongly raise the weighting at this point.
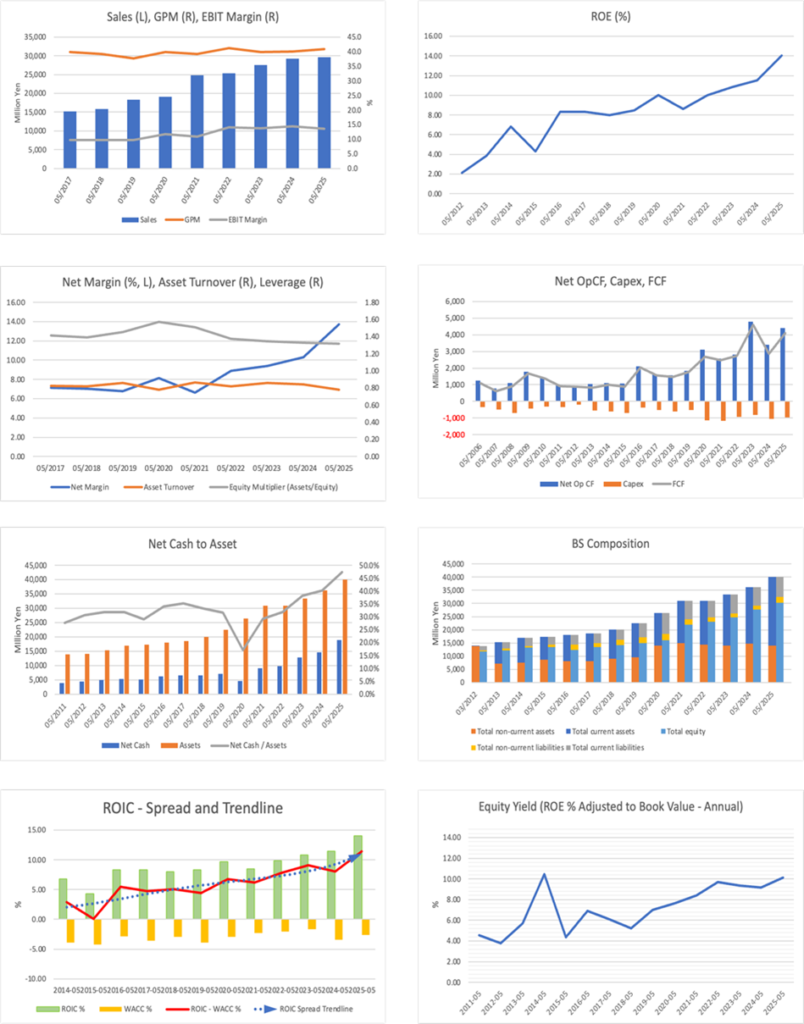
The base business centered on regulatory disclosures is stable, and the balance of indicators, forecast PER of 16.3x, actual PBR of 1.63x, ROE of 14.1%, and net cash of approximately 15.9 billion yen, is not bad. In addition, ROE, ROIC, and the economic value creation spread (ROIC–WACC) are showing a steadily improving trend on an annual basis, indicating that the Company has steadily enhanced profitability and capital efficiency over the long term. Considering also the progress in implementing AI functions centered on WizLabo, the current share price valuation remains restrained relative to a relatively solid earnings outlook, leaving some room for revaluation. For a re-rating in valuation, we would like to confirm quantitative progress in any of AI-related sales, the number of installations, margin improvement, or capital policy.
◇ 3Q FY2026/5 results highlights: Higher sales and higher operating profit were maintained, but margins decelerated due to personnel expenses and upfront costs. The earnings contribution of AI offerings is the key focus going forward.
For 3Q FY2026/5, the core business was solid, but profit margins were somewhat heavy due to upfront investment. Cumulative 3Q net sales were 22.330 billion yen (YoY +6.1%), operating income was 2.532 billion yen (YoY +2.5%), and ordinary income was 2.680 billion yen (YoY +2.0%), securing higher sales and higher operating profit. On the other hand, quarterly net income attributable to owners of the parent was 1.682 billion yen (YoY -1.0%), and the operating margin was also 11.3%, down 0.4 percentage points YoY, meaning profit growth was not as strong as sales growth.
The main reason for higher sales was that both wheels, the Disclosure-related business and the Interpreting & Translation business, grew in tandem. The Disclosure-related business posted net sales of 15.678 billion yen (YoY +5.8%) and segment profit of 1.872 billion yen (YoY +3.1%). In addition to an increase in consulting projects, the consolidation contribution of J Trust Co., Ltd. was a boosting factor; Financial Instruments and Exchange Act-related products were solid at 7.077 billion yen (YoY +7.9%), and Companies Act-related products were also solid at 3.145 billion yen (YoY +11.0%). Meanwhile, IR-related products grew in integrated reports but declined in business reports and similar documents, remaining at 4.239 billion yen (YoY -0.5%).
The Interpreting & Translation business was stronger. With net sales of 6.652 billion yen (YoY +7.0%) and segment profit of 515 million yen (YoY +44.1%), profit growth supported the entire Company. Behind this were increases in the total number of client companies, the number of new client companies, and the number of large projects in interpreting, as well as expanded sales of AI interpreting-related services, the accumulation of orders for SIMULwiz in translation, entry into the entertainment field, and expanded multilingual support. Although higher outsourcing costs were a headwind, higher sales and operational efficiency outweighed it.
Meanwhile, an increase in SG&A expenses pressured profit margins. Salaries and allowances increased by approximately 276 million yen YoY to 3.035 billion yen, welfare expenses increased by 68 million yen YoY to 657 million yen, and goodwill amortization increased by 106 million yen YoY to 264 million yen, bringing total SG&A expenses up to 6.755 billion yen. The decline in net income was also largely due to the impact of increased tax burden. However, this was not deterioration due to a slowdown in demand, but rather reflected factors such as strengthened staffing, increased costs following M&A, and upfront burdens to capture future sales.
In addition, in February 2026, the acquisition of an office building, funded with approximately 3.0 billion yen of internal funds, was completed ahead of schedule, and segment assets of the Disclosure-related business increased by 3.247 billion yen compared with the prior fiscal year-end. The Company views the impact on earnings as minor and maintains an equity ratio of 81.4%. Overall, the 3Q results maintained a trend of higher sales, while profit margins narrowed slightly due to increased upfront costs. What the market will seek going forward is not confirmation of higher sales but whether new AI offerings can demonstrate an earnings contribution that exceeds the increase in SG&A expenses. If margin improvement and quantitative disclosure of new services progress from 4Q onward, valuation will tend to strengthen another step.
◇ Segment analysis: The earnings foundation is the Disclosure-related business, and the role of accelerating growth is the Interpreting & Translation business.
The Company’s segment structure is a two-tier structure comprising the Disclosure-related business, which generates stable earnings, and the Interpreting & Translation business, which drives profit growth. Cumulative external net sales for 3Q FY2026/5 were 15.678 billion yen for the former and 6.652 billion yen for the latter, with the sales composition ratio roughly 7 to 3. Segment profit was 1.872 billion yen for the former and 515 million yen for the latter, and the core of profits continues to be borne by the Disclosure-related business.
• The Disclosure-related business is a business that provides one-stop support, from software provision, checking, consulting, translation, and production/printing, for preparing securities reports, financial results summaries, convocation notices, integrated reports, and other documents, with approximately 3,900 listed companies and approximately 1,000 companies planning to list as its main customers. Cumulative installations of higher-end WizLabo models have expanded to 1,803 companies.
• The Interpreting & Translation business is a business that provides interpreting, remote simultaneous interpreting systems, equipment, staffing, translation, AI translation, localization, and other services to government agencies, global companies, and domestic and overseas operating companies. It is characterized by having both disclosure translation and translation for general corporate customers.
In recent performance, the Disclosure-related business achieved YoY sales growth of 5.8% and YoY profit growth of 3.1%, supported by growth in convocation notices for general meetings of shareholders and integrated reports, as well as the contribution from the consolidation of J Trust. The breakdown was Financial Instruments and Exchange Act-related products of 7.077 billion yen, Companies Act-related products of 3.145 billion yen, IR-related products of 4.239 billion yen, and Others of 1.216 billion yen, with Financial Instruments and Exchange Act-related being the largest. The Interpreting & Translation business recorded YoY +7.0% higher sales and YoY +44.1% higher profit, showing strong growth. An increase in large interpreting projects, expanded sales of AI interpreting, and the expansion of multilingual translation support, along with the accumulation of orders for SIMULwiz, drove earnings improvement.
In short, this is a structure in which profit recovery from Interpreting & Translation and AI-related offerings is layered atop the defensive Disclosure-related business.
◇ FY2026/5 earnings forecast: The certainty of achieving the full-year plan has increased, but the decisive factors for share price valuation are 4Q margins and the initial pace of AI offerings.
The Company’s plan for FY2026/5 is currently highly likely to be achievable. The Company forecast remains unchanged at net sales of 33.000 billion yen, operating income of 4.400 billion yen, net income attributable to owners of the parent of 3.100 billion yen, and a dividend per share of 120 yen. Cumulative 3Q progress is 67.7% for net sales, 57.6% for operating income, and 54.3% for net income. These figures are also reflected in external data vendors’ records as of March 25, 2026, confirming that the Company’s plan is being maintained at present.
The final-year targets of the Medium-Term Management Plan 2026 are net sales of 33.000 billion yen, operating income of 4.400 billion yen, operating margin of 13.3%, net income attributable to owners of the parent of 3.100 billion yen, and ROE of 10.0%. In the supplementary materials, after revising the final-year targets based on progress through FY2025/5 and strengthening of business areas in FY2026/5, the Company presents initiatives such as enhancing functions of WizLabo 2.0 and strengthening the integrated report production and consulting structure in Disclosure-related, and expanding sales of SIMULwiz and expanding AI interpreting offerings in Interpreting & Translation. The important point is that this is not merely a plan for sales growth, but a plan to monetize responses to regulatory changes and AI implementation.
There are three positive factors. First, in the Disclosure-related business, cumulative installations of higher-end WizLabo models have expanded to 1,803 companies, and the IPO share is also secured at 51.5%, indicating a strong existing foundation. Second, the demand for disclosure translation is increasing against the backdrop of mandatory simultaneous Japanese-English disclosure for Prime Market-listed companies. Third, from February to March 2026, AI description checks, AI numerical checks, the Presentation AI Translation Service, and WizLabo AI Translate were launched in succession, and growth initiatives have moved from the concept phase to the sales phase.
On the other hand, the cumulative 3Q operating margin was 11.3%, down 0.4 percentage points YoY, and the rise in fixed costs, such as higher personnel expenses, continues. In addition, while the Company’s plan assumes higher operating profit, final profit is projected at 3.100 billion yen, down 23.9% from the previous fiscal year, and the optics are not strong. Furthermore, while it is possible to confirm the start of the provision of new AI offerings, quantitative KPIs such as sales contribution and the number of installations remain limited. Therefore, if there is a main cause of missing the plan, it would not be insufficient demand, but rather that price increases and efficiency gains sufficient to exceed the cost increase do not become adequately evident in 4Q.
The Company plan is not overly optimistic, and we currently view it as within reach. However, from the perspective of share price valuation, what matters is not the full-year landing itself, but whether AI-related services are quantified as a driver of profit growth from FY2027/5 onward. FY2026/5 is the phase of confirming the landing for the final year of the medium-term plan, and the next fiscal year is the phase of verifying whether it can move into the harvest period of AI implementation. If disclosures regarding any of the number of installations, unit prices, or gross margin improvement are made in 4Q or in the initial plan for the next fiscal year, the investment conclusion will be easier to strengthen.
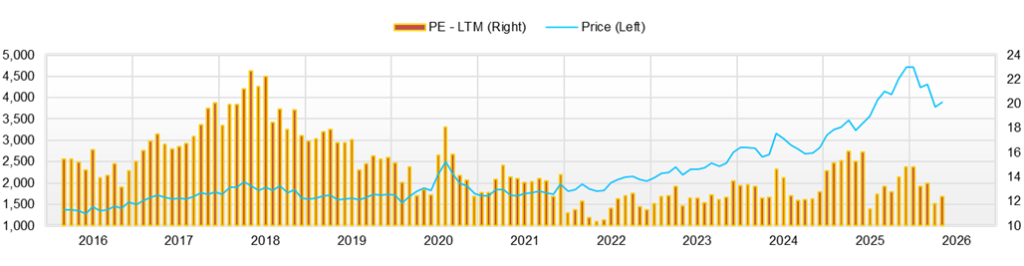
◇ Share price trend and points to watch going forward: The share price is in a phase of searching for a post-correction equilibrium. Quantitative disclosures, such as AI-related sales and the number of installations, will influence share price valuation going forward.
After adjusting from the December 2025 high, the share price is currently in a phase of seeking equilibrium. Levels of PER 16.3x, PBR 1.63x, and a dividend yield of 3.13% have priced in stable earnings and financial strength to some extent, but they have not reached a valuation that significantly anticipates AI growth. The market views it as valuing stable earnings and financial strength, but still wants to assess how far new services will translate into profits.
Looking at recent catalysts and share price reactions, what the market is reacting to is relatively clear. The change in the ownership transfer date of fixed assets on January 26 involved investing approximately 3.0 billion yen of internal funds, but the share price fell from the closing price of 4,350 yen on January 23 to the closing price of 4,270 yen on January 26, and it did not become a factor to lift the share price. In contrast, the “Presentation AI Translation Service” on February 5 rose 1.4% from 4,190 yen on February 4 to 4,250 yen on February 5, and “AI description check” and “AI numerical check” on February 27 rose 3.1% from 4,190 yen on February 26 to 4,320 yen on February 27, indicating that buying entered straightforwardly on AI-related IR. However, the full-scale provision start of “WizLabo AI Translate” on March 6 was limited to a 0.2% increase from 4,060 yen on March 5 to 4,070 yen on March 6, also showing that it is not a phase in which valuation is raised another step by the word “AI” alone.
The share price movement in response to the 3Q FY2026/5 earnings release on March 25 also reflects the current valuation. Against the closing price of 3,770 yen on March 24, the closing price on March 25 was 3,765 yen, almost flat, but trading volume swelled to 68,500 shares. It then recovered to 3,810 yen on March 26 and 3,840 yen on March 27. It is natural to interpret this as not having triggered widespread disappointment selling, but also not having contained a surprise large enough to drive another step higher on the earnings release alone.
From a technical perspective, around 3,700 yen is likely to be recognized as a level at which buying is initiated once. Unless it clearly falls below this level, downside concern is not significant. When it returns to the 4,000-yen level, upside becomes heavy, and around 4,100 yen is a zone where rebound selling tends to emerge. There is no concern about continuing to hold, but there are still insufficient catalysts to add aggressively. Going forward, the valuation catalyst is disclosure that allows AI-related sales and the number of installations to be quantified. If that can be confirmed, the valuation axis can expand from a stable-earnings stock to a re-growth stock.
Company profile
◇ A complex platformer of disclosure, language, and systems that holds the core processes of information disclosure.
TAKARA & COMPANY LTD. is an information disclosure infrastructure company that, with support for statutory disclosures at its core, bundles and provides voluntary disclosures, interpreting, translation, systems, and consulting. As of May 31, 2025, the consolidated employee count is 1,245, and the Group has 21 companies.
The Company’s strength lies in providing support for preparing disclosure documents not as a stand-alone service, but as an end-to-end solution that is deeply embedded in customers’ operations. It supports the preparation of statutory disclosure documents, integrated reports, and IR materials through a continuous process from system provision, content checking, consulting, interpreting & translation, and production/printing, enabling customers to complete disclosure operations without spanning multiple vendors. This generates high switching costs and continuous transactions, contributing to the stability of the Company’s earnings base. Its customer base, centered on approximately 3,900 listed companies and approximately 1,000 companies planning to list, also supports its competitive advantage.
The business portfolio consists of two pillars: the Disclosure-related business and the Interpreting & Translation business. The former has expanded its scope to include regulatory disclosure documents, IR, ICT, consulting, and, in recent years, financial instrument disclosures and PR support, while the latter offers general translation, AI translation, and simultaneous and consecutive interpreting. Recently, with “WizLabo” at its core, it has implemented AI description checks, AI numerical checks, and AI translation, strengthening its positioning from a conventional disclosure support company to a technology-utilization company.
Key financial data
| Unit: million yen | 2021 | 2022 | 2023 | 2024 | 2025 | 2026 CE |
| Sales | 24,777 | 25,318 | 27,568 | 29,278 | 29,679 | 33,000 |
| EBIT (operating profit) | 2,707 | 3,561 | 3,812 | 4,232 | 4,049 | 4,400 |
| Pretax Income | 2,933 | 3,630 | 4,010 | 4,454 | 6,018 | |
| Net Profit Attributable to Owner of Parent | 1,640 | 2,250 | 2,596 | 3,014 | 4,076 | 3,100 |
| Cash & Short-Term Investments | 9,745 | 10,296 | 13,139 | 14,641 | 19,146 | |
| Total assets | 30,972 | 30,924 | 33,444 | 36,195 | 40,058 | |
| Total Debt | 702 | 441 | 367 | 107 | 209 | |
| Net Debt | -9,042 | -9,856 | -12,773 | -14,534 | -18,937 | |
| Total liabilities | 8,504 | 7,560 | 8,361 | 8,194 | 9,331 | |
| Total Shareholders’ Equity | 21,920 | 23,069 | 24,763 | 27,645 | 30,335 | |
| Net Operating Cash Flow | 2,569 | 2,802 | 4,794 | 3,412 | 4,391 | |
| Capital Expenditure | 1,183 | 945 | 824 | 1,052 | 957 | |
| Net Investing Cash Flow | -1,395 | -957 | -763 | -889 | 1,248 | |
| Net Financing Cash Flow | 1,193 | -1,234 | -1,192 | -1,371 | -1,127 | |
| Free Cash Flow | 2,486 | 2,734 | 4,608 | 2,860 | 4,083 | |
| ROA (%) | 5.71 | 7.27 | 8.06 | 8.66 | 10.69 | |
| ROE (%) | 8.63 | 10.00 | 10.85 | 11.50 | 14.06 | |
| EPS (Yen) | 130.0 | 171.3 | 197.7 | 231.8 | 314.0 | 240.1 |
| BPS (Yen) | 1,672.2 | 1,754.8 | 1,895.9 | 2,130.2 | 2,337.1 | |
| Dividend per Share (Yen) | 54.00 | 58.00 | 70.00 | 80.00 | 120.00 | 120.00 |
| Shares Outstanding (Million shares) | 13.15 | 13.15 | 13.15 | 13.15 | 13.15 |
Source: Calculated by Omega Investment based on FactSet’s standard criteria, rounded to the nearest whole number.
Share price
Key stock price data
Financial data (quarterly basis)
| Unit: million yen | 2024/5 | 2025/5 | 2026/5 | ||||||
| 3Q | 4Q | 1Q | 2Q | 3Q | 4Q | 1Q | 2Q | 3Q | |
| (Income Statement) | |||||||||
| Sales | 5,857 | 8,418 | 8,370 | 6,507 | 6,163 | 8,639 | 9,086 | 6,990 | 6,255 |
| Year-on-year | 9.3% | 6.4% | -0.6% | -1.2% | 5.2% | 2.6% | 8.6% | 7.4% | 1.5% |
| Cost of Goods Sold (COGS) | 3,773 | 4,933 | 4,785 | 4,117 | 3,842 | 4,809 | 5,222 | 4,342 | 3,974 |
| Gross Income | 2,084 | 3,485 | 3,586 | 2,389 | 2,321 | 3,829 | 3,865 | 2,648 | 2,281 |
| Gross Income Margin | 35.6% | 41.4% | 42.8% | 36.7% | 37.7% | 44.3% | 42.5% | 37.9% | 36.5% |
| SG&A Expense | 1,710 | 1,989 | 1,856 | 1,894 | 1,908 | 2,177 | 2,072 | 2,014 | 2,004 |
| EBIT (Operating Income) | 310 | 1,418 | 1,652 | 448 | 370 | 1,579 | 1,712 | 589 | 230 |
| Year-on-year | -6.6% | 11.2% | -9.9% | -33.2% | 19.4% | 11.4% | 3.7% | 31.4% | -37.7% |
| Operating Income Margin | 5.3% | 16.8% | 19.7% | 6.9% | 6.0% | 18.3% | 18.8% | 8.4% | 3.7% |
| EBITDA | 622 | 1,737 | 1,953 | 765 | 694 | 1,914 | 2,072 | 954 | 599 |
| Pretax Income | 466 | 1,437 | 1,708 | 508 | 410 | 3,393 | 1,789 | 598 | 293 |
| Consolidated Net Income | 289 | 1,061 | 1,153 | 322 | 247 | 2,387 | 1,194 | 350 | 156 |
| Minority Interest | 6 | 11 | 7 | 8 | 8 | 12 | 0 | 9 | 8 |
| Net Income ATOP | 283 | 1,050 | 1,146 | 314 | 239 | 2,376 | 1,194 | 340 | 148 |
| Year-on-year | 24.9% | 20.6% | -10.7% | -21.1% | -15.4% | 126.2% | 4.1% | 8.3% | -38.0% |
| Net Income Margin | 4.8% | 12.5% | 13.7% | 4.8% | 3.9% | 27.5% | 13.1% | 4.9% | 2.4% |
| (Balance Sheet) | |||||||||
| Cash & Short-Term Investments | 14,057 | 14,641 | 16,248 | 16,534 | 15,910 | 19,146 | 19,862 | 20,036 | 15,998 |
| Total assets | 31,703 | 36,195 | 34,614 | 35,209 | 33,879 | 40,058 | 38,452 | 38,850 | 37,422 |
| Total Debt | 139 | 107 | 100 | 93 | 85 | 209 | 184 | 167 | 89 |
| Net Debt | -13,917 | -14,534 | -16,148 | -16,441 | -15,824 | -18,937 | -19,677 | -19,869 | -15,908 |
| Total liabilities | 5,593 | 8,194 | 6,088 | 6,544 | 5,539 | 9,331 | 7,630 | 7,728 | 6,602 |
| Total Shareholders’ Equity | 25,766 | 27,645 | 28,161 | 28,294 | 27,959 | 30,335 | 30,440 | 30,757 | 30,447 |
| (Profitability %) | |||||||||
| ROA | 9.16 | 8.66 | 8.57 | 8.18 | 8.39 | 10.69 | 11.29 | 11.20 | 11.38 |
| ROE | 11.40 | 11.50 | 10.65 | 10.28 | 10.24 | 14.06 | 14.07 | 14.05 | 13.90 |
| (Per-share) Unit: JPY | |||||||||
| EPS | 21.8 | 80.9 | 88.3 | 24.2 | 18.4 | 183.0 | 92.3 | 26.4 | 11.5 |
| BPS | 1,985.4 | 2,130.2 | 2,170.0 | 2,179.8 | 2,154.0 | 2,337.1 | 2,358.7 | 2,382.8 | 2,358.8 |
| Dividend per Share | 0.00 | 40.00 | 0.00 | 45.00 | 0.00 | 45.00 | 0.00 | 60.00 | 0.00 |
| Shares Outstanding (million shares) | 13.15 | 13.15 | 13.15 | 13.15 | 13.15 | 13.15 | 13.15 | 13.15 | 13.15 |
Source: Calculated by Omega Investment based on FactSet’s standard criteria, rounded to the nearest whole number.
Financial data (full-year basis)
| Unit: million yen | 2018 | 2019 | 2020 | 2021 | 2022 | 2023 | 2024 | 2025 |
| (Income Statement) | ||||||||
| Sales | 15,792 | 18,258 | 19,117 | 24,777 | 25,318 | 27,568 | 29,278 | 29,679 |
| Year-on-year | 4.2% | 15.6% | 4.7% | 29.6% | 2.2% | 8.9% | 6.2% | 1.4% |
| Cost of Goods Sold | 9,590 | 11,388 | 11,484 | 15,071 | 14,891 | 16,596 | 17,542 | 17,554 |
| Gross Income | 6,202 | 6,870 | 7,633 | 9,706 | 10,427 | 10,972 | 11,736 | 12,125 |
| Gross Income Margin | 39.3% | 37.6% | 39.9% | 39.2% | 41.2% | 39.8% | 40.1% | 40.9% |
| SG&A Expense | 4,541 | 4,946 | 5,247 | 6,878 | 6,641 | 6,923 | 7,253 | 7,818 |
| EBIT (operating profit) | 1,534 | 1,780 | 2,245 | 2,707 | 3,561 | 3,812 | 4,232 | 4,049 |
| Year-on-year | 3.9% | 16.0% | 26.1% | 20.6% | 31.5% | 7.1% | 11.0% | -4.3% |
| Operating profit Margin | 9.7% | 9.7% | 11.7% | 10.9% | 14.1% | 13.8% | 14.5% | 13.6% |
| EBITDA | 2,149 | 2,424 | 2,852 | 3,646 | 4,732 | 5,031 | 5,482 | 5,326 |
| Pretax Income | 1,691 | 1,913 | 2,453 | 2,933 | 3,630 | 4,010 | 4,454 | 6,018 |
| Consolidated Net Income | 1,137 | 1,273 | 1,685 | 1,804 | 2,301 | 2,625 | 3,049 | 4,110 |
| Minority Interest | 26 | 36 | 130 | 164 | 51 | 29 | 35 | 35 |
| Net Income ATOP | 1,111 | 1,237 | 1,555 | 1,640 | 2,250 | 2,596 | 3,014 | 4,076 |
| Year-on-year | 2.7% | 11.3% | 25.8% | 5.4% | 37.2% | 15.4% | 16.1% | 35.2% |
| Net Income Margin | 7.0% | 6.8% | 8.1% | 6.6% | 8.9% | 9.4% | 10.3% | 13.7% |
| (Balance Sheet) | ||||||||
| Cash & Short-Term Investments | 6,751 | 7,845 | 7,365 | 9,745 | 10,296 | 13,139 | 14,641 | 19,146 |
| Total assets | 20,033 | 22,442 | 26,450 | 30,972 | 30,924 | 33,444 | 36,195 | 40,058 |
| Total Debt | 102 | 749 | 2,808 | 702 | 441 | 367 | 107 | 209 |
| Net Debt | -6,650 | -7,096 | -4,557 | -9,042 | -9,856 | -12,773 | -14,534 | -18,937 |
| Total liabilities | 5,488 | 7,082 | 9,867 | 8,504 | 7,560 | 8,361 | 8,194 | 9,331 |
| Total Shareholders’ Equity | 14,248 | 15,000 | 16,083 | 21,920 | 23,069 | 24,763 | 27,645 | 30,335 |
| (Cash Flow) | ||||||||
| Net Operating Cash Flow | 1,577 | 1,829 | 3,111 | 2,569 | 2,802 | 4,794 | 3,412 | 4,391 |
| Capital Expenditure | 601 | 528 | 1,146 | 1,183 | 945 | 824 | 1,052 | 957 |
| Net Investing Cash Flow | -940 | -806 | -5,229 | -1,395 | -957 | -763 | -889 | 1,248 |
| Net Financing Cash Flow | -481 | -30 | 1,477 | 1,193 | -1,234 | -1,192 | -1,371 | -1,127 |
| Free Cash Flow | 1,468 | 1,753 | 2,689 | 2,486 | 2,734 | 4,608 | 2,860 | 4,083 |
| (Profitability ) | ||||||||
| ROA (%) | 5.75 | 5.82 | 6.36 | 5.71 | 7.27 | 8.06 | 8.66 | 10.69 |
| ROE (%) | 8.00 | 8.46 | 10.01 | 8.63 | 10.00 | 10.85 | 11.50 | 14.06 |
| Net Margin (%) | 7.03 | 6.77 | 8.14 | 6.62 | 8.89 | 9.42 | 10.30 | 13.73 |
| Asset Turn | 0.82 | 0.86 | 0.78 | 0.86 | 0.82 | 0.86 | 0.84 | 0.78 |
| Assets/Equity | 1.39 | 1.45 | 1.57 | 1.51 | 1.38 | 1.35 | 1.33 | 1.32 |
| (Per-share) Unit: JPY | ||||||||
| EPS | 99.4 | 110.6 | 139.0 | 130.0 | 171.3 | 197.7 | 231.8 | 314.0 |
| BPS | 1,274.7 | 1,342.0 | 1,409.7 | 1,672.2 | 1,754.8 | 1,895.9 | 2,130.2 | 2,337.1 |
| Dividend per Share | 50.00 | 50.00 | 54.00 | 54.00 | 58.00 | 70.00 | 80.00 | 120.00 |
| Shares Outstanding (million shares) | 12.94 | 12.94 | 12.94 | 13.15 | 13.15 | 13.15 | 13.15 | 13.15 |
Source: Calculated by Omega Investment based on FactSet’s standard criteria, rounded to the nearest whole number.