2026-07-15
Home
Japanese

Omega Investment Co., Ltd.
Hamee (Company note – Q3 update)

| Share price (4/9) | ¥521 | Dividend Yield (26/4 CE) | 4.3 % |
| 52weeks high/low | ¥690/411 | ROE(25/4) | 12.4 % |
| Avg Vol (3 month) | 137 thou shrs | Operating margin (25/4) | 10.3 % |
| Market Cap | ¥8.5 bn | Beta (5Y Monthly) | 1.3 |
| Enterprise Value | ¥8.1 bn | Shares Outstanding | 16.3 mn shrs |
| PER (26/4 CE) | 54.7 X | Listed market | TSE Standard |
| PBR (25/4 act) | 1.2 X |
| Click here for the PDF version of this page |
| PDF version |
The Commerce Segment posted higher sales, and earnings came in better than expected. Rising expectations for the next medium-term management plan
◇ Q3 FY04/2026 results highlights:
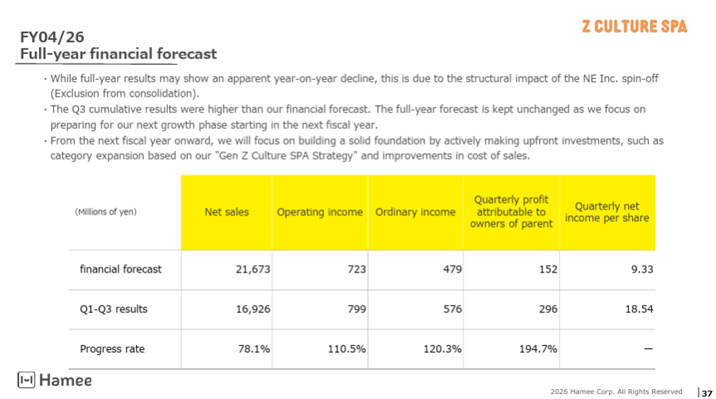
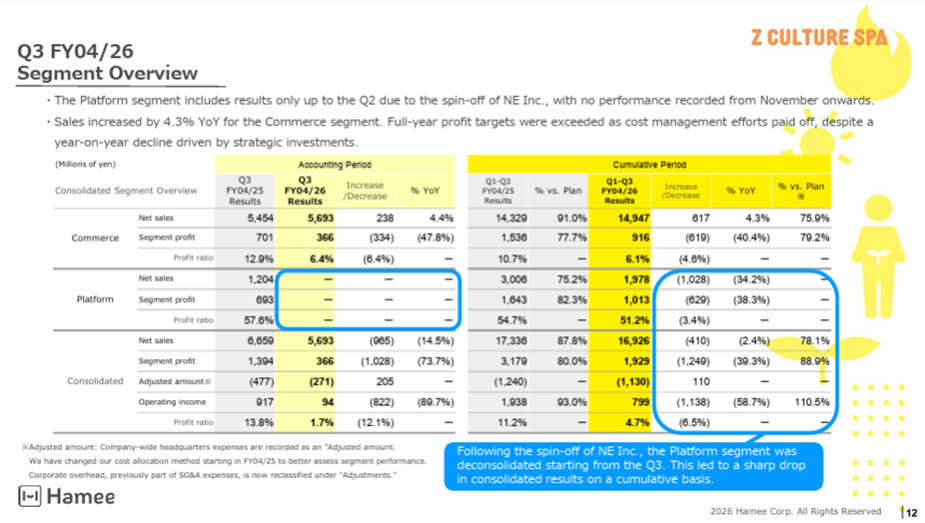
Hamee (hereinafter, the Company) announced its Q3 FY04/2026 results on March 13, 2026, reporting net sales of JPY16.93 billion (down 2% YoY), operating profit of JPY800 million (down 59% YoY), ordinary profit of JPY580 million (down 72% YoY), and quarterly net income attributable to owners of the parent of JPY300 million (down 72% YoY).
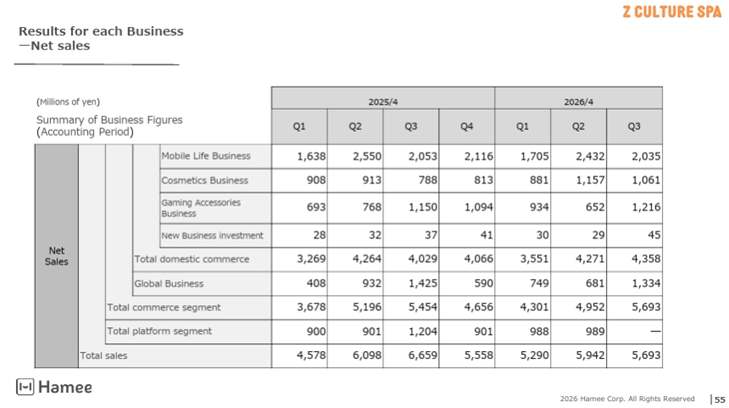
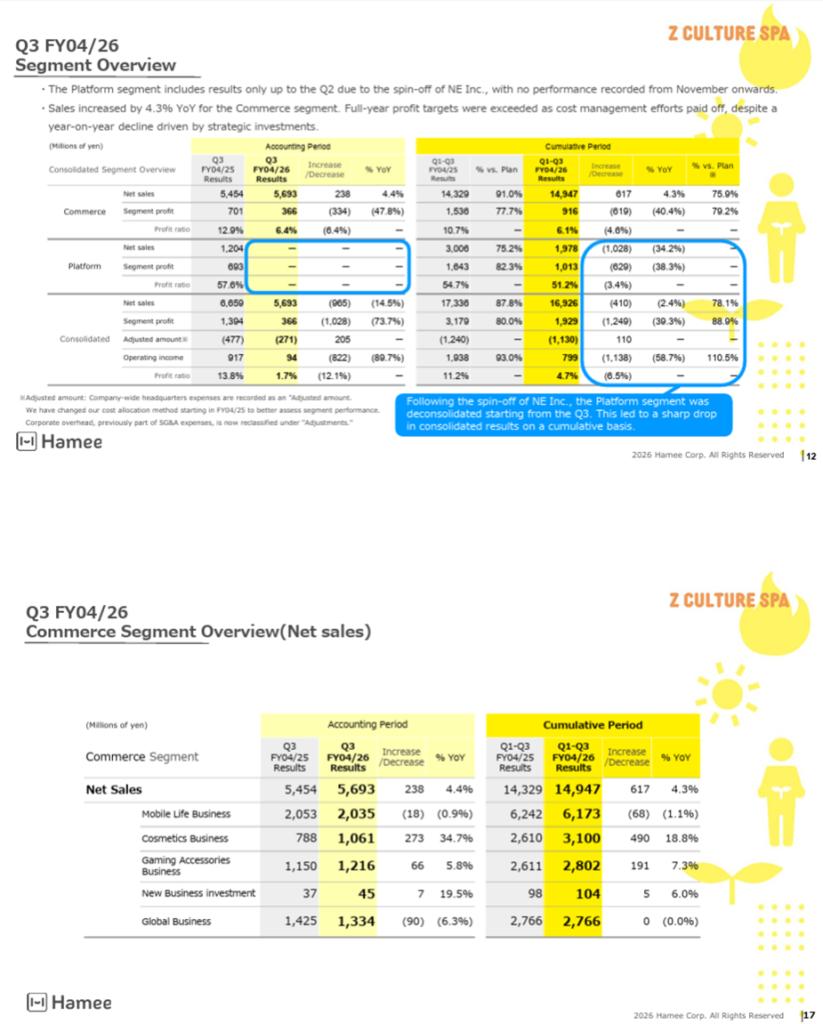
Due to the significant impact of the deconsolidation of NE Inc. carried out during the current fiscal year (October 2025), when reviewing the trend of the Commerce Segment that remained with the Company, net sales were JPY14.95 billion (up 4% YoY) and segment profit was JPY920 million (down 40% YoY) for the cumulative period (May-January period), while net sales were JPY5.69 billion (up 4% YoY) and segment profit was JPY370 million (down 48% YoY) for the three-month period (November-January period).
Accordingly, the Company‘s actual trend is one of higher sales and lower earnings. However, the fact that higher sales have been achieved, that cost management has been steadily executed, and that progress in operating profit (hereinafter, profit) has already reached the full-year forecast even while strategic investments are being made are points that should be viewed positively. In the balance sheet, due to the impact of the earlier spin-off of NE Inc., total assets decreased by JPY2.8 billion from the beginning of the fiscal year, and net assets decreased by JPY3.4 billion. However, the Company appears to maintain a sound financial position.
Details
Organizing the quarterly trend of the Commerce Business, the Q1 showed higher sales and lower earnings YoY, the Q2 showed lower sales and lower earnings, and the Q3 showed higher sales and lower earnings. The following summarizes the key points for the Q3.
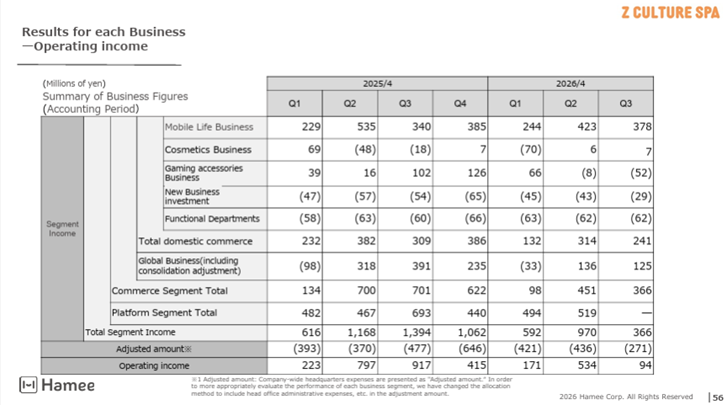
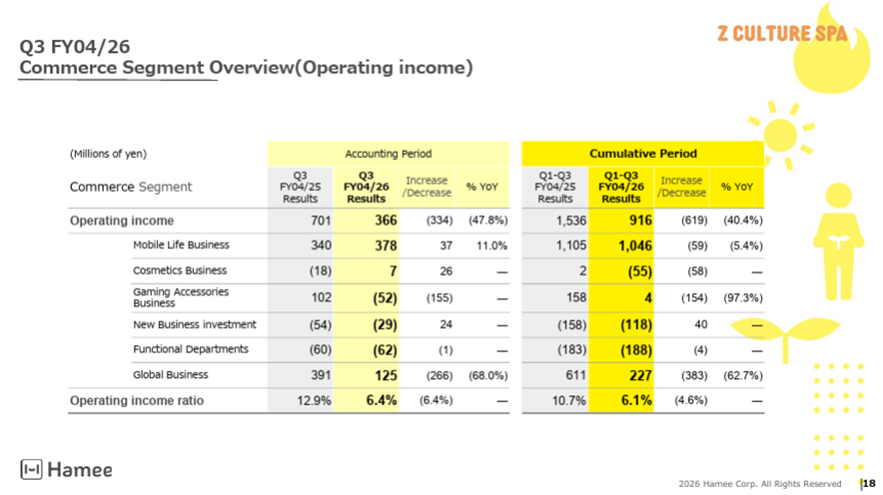
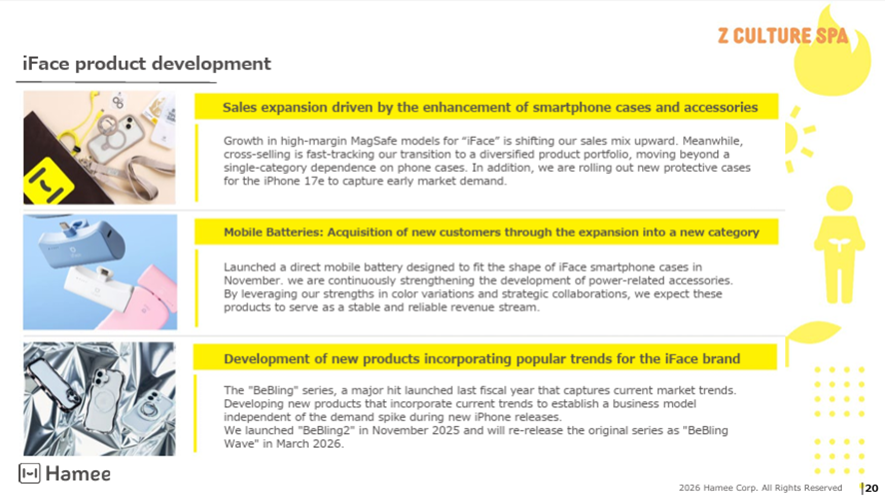
- Mobile Life Business: Net sales of JPY2.04 billion and segment profit of JPY380 million (slightly lower sales and higher earnings). Wholesale sales were somewhat weak, but EC sales increased. A higher sales mix of higher-priced MagSafe-compatible models in the core iFace series, as well as cross-selling of peripheral accessories such as glass films, contributed. Mobile batteries and new products incorporating trends are also being rolled out.
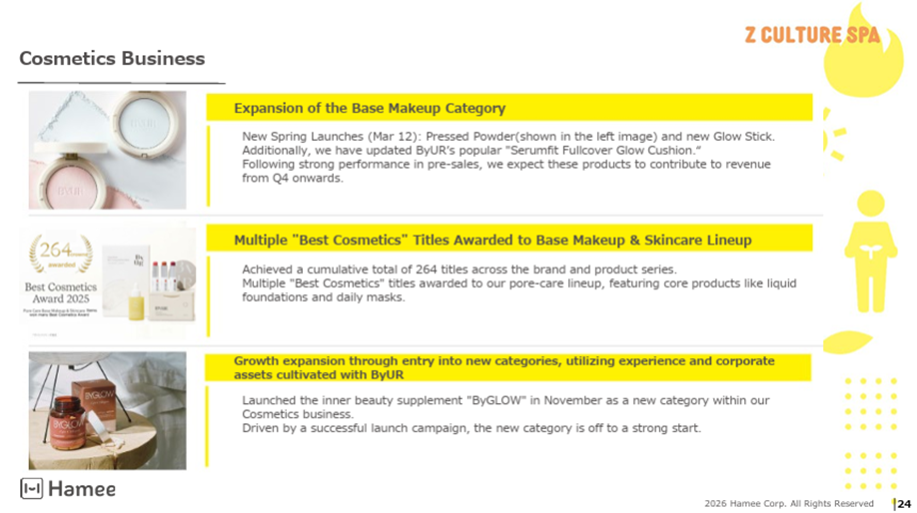
- Cosmetics Business: Net sales of JPY1.06 billion and segment profit of JPY7 million (higher sales and return to profitability). Due to stabilization of the structure after the reorganization of sales channels and strong performance in base makeup, wholesale sales led the overall business, offsetting sluggish growth in the sheet mask and skincare categories, and resulting in higher sales. Although upfront investment in promotional expenses associated with expanding stores carrying the products continued, the business achieved profitability in Q3, following Q2 as well. It has clearly shifted to the profitability phase.
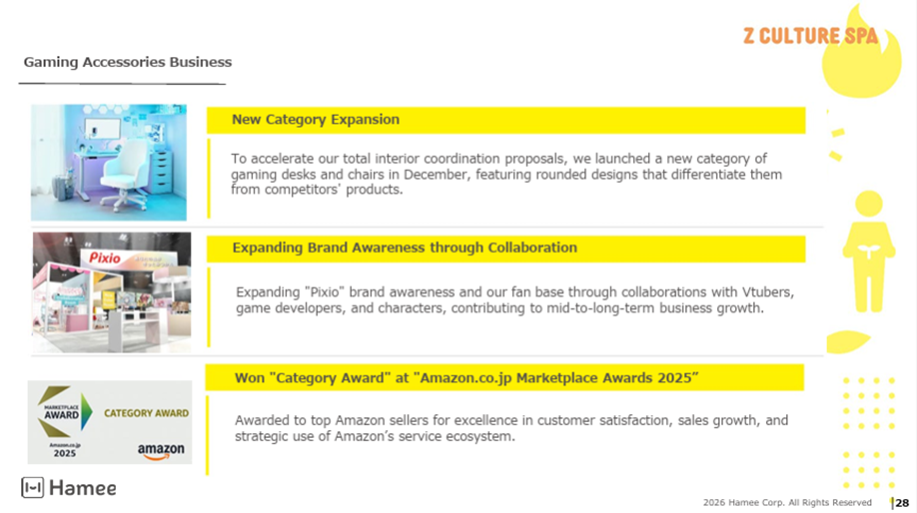
- Gaming Accessories Business: Net sales of JPY1.22 billion and segment loss of JPY50 million (higher sales and turned to a loss). Although price competition in the gaming monitor market continued, the business advanced initiatives leveraging its strength in proposing total coordination for entire spaces, and sales of accessories, including monitor arms, remained strong, contributing to higher sales and helping secure profitability. It also won the “Amazon.co.jp Marketplace Award 2025 Category Award.”
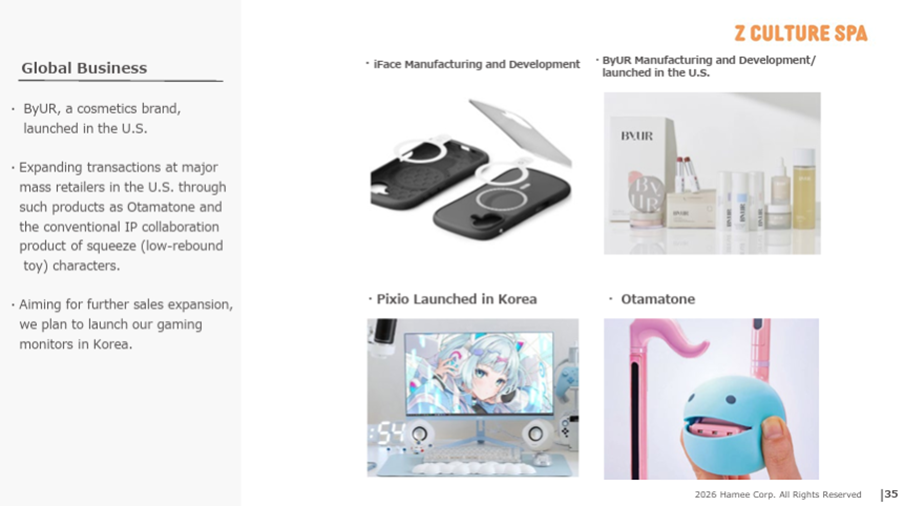
- Global Business: Net sales of JPY1.33 billion and segment profit of JPY130 million (lower sales and lower earnings). Although the core U.S. year-end selling season drove performance, the business as a whole recorded lower sales due to the impact of consolidation adjustments. Regarding profit and loss, in the United States, the recording of inventory valuation losses and the impact of tariffs pressured gross profit, and personnel expenses rose due to wage increases, while related expenses for the expansion of ByUR also increased. In South Korea as well, gross profit declined due to lower intercompany sales, and selling, general, and administrative expenses increased, including warehouse expansion and advertising expenses associated with the start of sales of the Pixio gaming monitor, as well as advertising expenses related to Otamatone.
- Merchandise inventories decreased 3% YoY.
Source: Company material
◇ Full-year outlook: unchanged
Although the Company has achieved each stage of profit in its full-year earnings forecast by the Q3, it has left the full-year forecast unchanged. This is because it is incorporating the risk of fluctuations in the market environment while proceeding with preparations for growth from the next fiscal year onward. There is no change to the dividend outlook, either.
Source: Company material
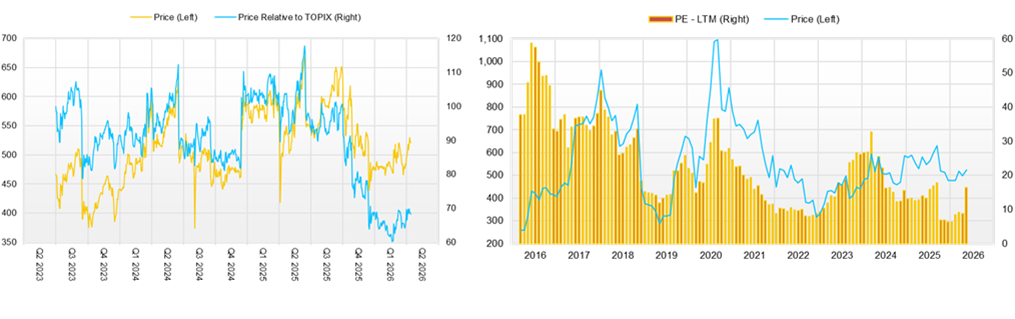
◇ Share price trends and points of focus going forward
The share price has remained flat at around JPY500 since the start of the year. This suggests that, while the Commerce Segment as a whole remains on a trend of higher sales and lower earnings and expenses for growth are weighing on results, the Cosmetics Business has reached the phase of full-fledged profitability, and the share price is waiting for the next positive catalyst.
The following points will determine future share price trends. In particular, the announcement of the next medium-term management plan is awaited.
1. Whether performance for FY04/2026 will progress without falling below the current Company forecast. In particular, whether the trend of higher sales can be maintained.
2. When the Cosmetics Business will graduate from the upfront investment phase and enter the phase of full-fledged profitability.
3. Whether the direction of the medium-term management plan, scheduled to be presented at the FY04/2026 earnings announcement, will lead to growth expectations. In particular, whether strong higher sales and higher earnings can be expected from the second half of FY04/2027, when the impact of the spin-off of NE Inc. will have run its course.
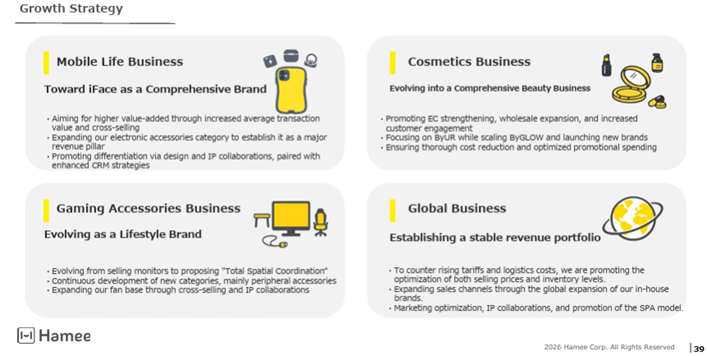
The Company’s current direction is as shown in the following charts.
Source: Company material
Company profile
◇ Hamee Corp. (hereinafter, the Company) was founded in 1997, listed its shares on the TSE Mothers in 2015, and is currently listed on the Standard Market. It has operated the business in two separated segments: the “Commerce Segment,” which develops businesses such as the Mobile Life Business, the Gaming Accessories Business, the Cosmetics Business, and the Global Business; and the “Platform Segment,” whose primary business is to provide the cloud (SaaS)-based ECAttractions “NextEngine,” which automates tasks related to operating online shops for e-commerce operators and centrally manages order processing for multiple stores and inventory status across malls.
Subsequently, at the end of October 2025, the Company spun off NE Inc., which was responsible for the Platform Segment, and listed it in November of the same year. Since then, the Company has specialized in the Commerce Segment and entered a “third founding phase,” leveraging SPA functions to deploy product groups that shape Gen Z culture in multiple directions while strengthening its decarbonization efforts. At the FY04/2026 earnings announcement, a medium- to long-term plan is scheduled to be presented.
Key financial data
| Unit: million yen | 2021/4 | 2022/4 | 2023/4 | 2024/4 | 2025/4 | 2026/4 CE |
| Sales | 12,363 | 13,413 | 14,038 | 17,612 | 22,895 | 21,673 |
| EBIT (Operating Income) | 2,180 | 2,202 | 1,251 | 1,964 | 2,346 | |
| Pretax Income | 2,144 | 2,463 | 1,396 | 2,009 | 1,991 | |
| Net Profit Attributable to Owner of Parent | 1,556 | 1,744 | 945 | 1,122 | 1,278 | 152 |
| Cash & Short-Term Investments | 3,355 | 4,026 | 3,536 | 4,022 | 4,994 | |
| Total assets | 8,342 | 10,524 | 12,392 | 14,885 | 16,973 | |
| Total Debt | 104 | 544 | 1,300 | 2,327 | 3,850 | |
| Net Debt | -3,251 | -3,482 | -2,236 | -1,694 | -1,144 | |
| Total liabilities | 1,814 | 2,271 | 3,431 | 4,728 | 6,402 | |
| Total Shareholders’ Equity | 6,528 | 8,253 | 8,961 | 10,157 | 10,570 | |
| Net Operating Cash Flow | 1,941 | 1,186 | 695 | 886 | 827 | |
| Capital Expenditure | 351 | 1,018 | 487 | 477 | 783 | |
| Net Investing Cash Flow | -412 | -886 | -1,507 | -877 | -922 | |
| Net Financing Cash Flow | -1,736 | 298 | 263 | 380 | 1,171 | |
| Free Cash Flow | 1,760 | 362 | 405 | 577 | 225 | |
| ROA (%) | 18.94 | 18.49 | 8.25 | 8.22 | 8.02 | |
| ROE (%) | 27.42 | 23.60 | 10.98 | 11.73 | 12.33 | |
| EPS (Yen) | 98.4 | 109.7 | 59.4 | 70.4 | 80.2 | 9.3 |
| BPS (Yen) | 411.1 | 519.1 | 563.0 | 637.6 | 662.6 | |
| Dividend per Share (Yen) | 10.00 | 22.50 | 22.50 | 22.50 | 22.50 | 22.50 |
| Shares Outstanding (Million Shares) | 16.21 | 16.27 | 16.27 | 16.28 | 16.29 |
Source: Omega Investment from company data, rounded to the nearest whole number.
Share price
Overview of Q3 FY04/2026
Overview of company-wide performance
Source: Company material
Financial data (quarterly basis)
| Unit: million yen | 2024/4 | 2025/4 | 2026/4 | ||||||
| Q3 | Q4 | Q1 | Q2 | Q3 | Q4 | Q1 | Q2 | Q3 | |
| (Income Statement) | |||||||||
| Sales | 5,151 | 4,829 | 4,579 | 6,099 | 6,659 | 5,559 | 5,290 | 5,942 | 5,694 |
| Year-on-year | 31.8% | 38.1% | 38.1% | 41.3% | 29.3% | 15.1% | 15.5% | -2.6% | -14.5% |
| Cost of Goods Sold (COGS) | 1,858 | 1,977 | 1,841 | 2,628 | 2,668 | 2,261 | 2,275 | 2,315 | 2,443 |
| Gross Income | 3,293 | 2,852 | 2,738 | 3,471 | 3,991 | 3,297 | 3,016 | 3,627 | 3,251 |
| Gross Income Margin | 63.9% | 59.1% | 59.8% | 56.9% | 59.9% | 59.3% | 57.0% | 61.0% | 57.1% |
| SG&A Expense | 2,565 | 2,306 | 2,505 | 2,691 | 3,074 | 2,882 | 2,845 | 3,092 | 3,157 |
| EBIT (Operating Income) | 756 | 551 | 233 | 780 | 917 | 416 | 171 | 534 | 94 |
| Year-on-year | 27.0% | 545.8% | 24.7% | 65.9% | 21.3% | -24.6% | -26.5% | -31.5% | -89.7% |
| Operating Income Margin | 14.7% | 11.4% | 5.1% | 12.8% | 13.8% | 7.5% | 3.2% | 9.0% | 1.7% |
| EBITDA | 953 | 749 | 435 | 941 | 1,163 | 623 | 376 | 765 | 279 |
| Pretax Income | 737 | 576 | 200 | 811 | 702 | 278 | 97 | 422 | 28 |
| Consolidated Net Income | 492 | 428 | 101 | 564 | 400 | 212 | 26 | 274 | -4 |
| Minority Interest | 0 | 0 | 0 | 0 | 0 | 0 | 0 | 0 | 0 |
| Net Income ATOP | 492 | 428 | 101 | 564 | 400 | 212 | 26 | 274 | -4 |
| Year-on-year | 53.6% | 228.4% | -176.6% | 68.8% | -18.6% | -50.5% | -74.6% | -51.4% | -100.9% |
| Net Income Margin | 9.5% | 8.9% | 2.2% | 9.3% | 6.0% | 3.8% | 0.5% | 4.6% | -0.1% |
| (Balance Sheet) | |||||||||
| Cash & Short-Term Investments | 3,430 | 4,022 | 3,642 | 3,912 | 4,204 | 4,994 | 4,172 | 5,317 | 2,329 |
| Total assets | 14,210 | 14,885 | 15,295 | 16,838 | 18,197 | 17,303 | 16,416 | 19,556 | 14,139 |
| Total Debt | 1,928 | 2,327 | 3,232 | 3,980 | 3,927 | 4,076 | 3,850 | 5,150 | 4,500 |
| Net Debt | -1,502 | -1,694 | -410 | 68 | -277 | -918 | -322 | -167 | 2,171 |
| Total liabilities | 4,566 | 4,728 | 5,242 | 6,490 | 7,553 | 6,733 | 5,980 | 8,449 | 6,931 |
| Total Shareholders’ Equity | 9,644 | 10,157 | 10,053 | 10,348 | 10,644 | 10,570 | 10,437 | 11,107 | 7,209 |
| (Profitability %) | |||||||||
| ROA | 6.20 | 8.22 | 9.81 | 10.56 | 9.22 | 7.94 | 7.58 | 5.01 | 3.14 |
| ROE | 8.88 | 11.73 | 14.43 | 16.26 | 14.73 | 12.33 | 11.74 | 8.50 | 5.69 |
| (Per-share) Unit: JPY | |||||||||
| EPS | 30.9 | 26.9 | 6.4 | 35.4 | 25.1 | 13.3 | 1.6 | 17.1 | -0.2 |
| BPS | 605.6 | 637.6 | 630.7 | 648.8 | 667.4 | 662.6 | 653.1 | 694.2 | 450.5 |
| Dividend per Share | 0.00 | 22.50 | 0.00 | 0.00 | 0.00 | 22.50 | 0.00 | 0.00 | 0.00 |
| Shares Outstanding (million shares) | 16.28 | 16.28 | 16.29 | 16.29 | 16.29 | 16.30 | 16.30 | 16.33 | 16.33 |
Source: Omega Investment from company materials
Financial data (full-year basis)
| Unit: million yen | 2017/4 | 2018/4 | 2019/4 | 2020/4 | 2021/4 | 2022/4 | 2023/4 | 2024/4 | 2025/4 |
| (Income Statement) | |||||||||
| Sales | 8,503 | 9,379 | 10,300 | 11,325 | 12,363 | 13,413 | 14,038 | 17,612 | 22,895 |
| Year-on-year | 30.8% | 10.3% | 9.8% | 10.0% | 9.2% | 8.5% | 4.7% | 25.5% | 30.0% |
| Cost of Goods Sold | 4,485 | 4,618 | 5,056 | 4,894 | 4,802 | 4,892 | 5,563 | 6,745 | 9,398 |
| Gross Income | 4,018 | 4,761 | 5,244 | 6,431 | 7,562 | 8,522 | 8,476 | 10,867 | 13,497 |
| Gross Income Margin | 47.3% | 50.8% | 50.9% | 56.8% | 61.2% | 63.5% | 60.4% | 61.7% | 59.0% |
| SG&A Expense | 2,916 | 3,381 | 4,080 | 4,686 | 5,382 | 6,319 | 7,225 | 8,959 | 11,151 |
| EBIT (Operating Income) | 1,102 | 1,380 | 1,164 | 1,745 | 2,180 | 2,202 | 1,251 | 1,964 | 2,354 |
| Year-on-year | 146.8% | 25.2% | -15.7% | 50.0% | 24.9% | 1.0% | -43.2% | 57.0% | 19.5% |
| Operating Income Margin | 13.0% | 14.7% | 11.3% | 15.4% | 17.6% | 16.4% | 8.9% | 11.1% | 10.2% |
| EBITDA | 1,272 | 1,627 | 1,525 | 2,227 | 2,694 | 2,840 | 2,042 | 2,749 | 3,162 |
| Pretax Income | 1,010 | 1,259 | 1,179 | 1,582 | 2,144 | 2,463 | 1,396 | 2,009 | 1,991 |
| Consolidated Net Income | 696 | 873 | 821 | 1,069 | 1,556 | 1,744 | 945 | 1,122 | 1,278 |
| Net Income ATOP | 696 | 873 | 821 | 1,069 | 1,556 | 1,744 | 945 | 1,122 | 1,278 |
| Year-on-year | 169.7% | 25.4% | -5.9% | 30.2% | 45.5% | 12.0% | -45.8% | 18.6% | 13.9% |
| Net Income Margin | 8.2% | 9.3% | 8.0% | 9.4% | 12.6% | 13.0% | 6.7% | 6.4% | 5.6% |
| (Balance Sheet) | |||||||||
| Cash & Short-Term Investments | 1,324 | 1,695 | 1,660 | 3,453 | 3,355 | 4,026 | 3,536 | 4,022 | 4,994 |
| Total assets | 4,240 | 5,042 | 5,761 | 8,097 | 8,342 | 10,524 | 12,392 | 14,885 | 16,973 |
| Total Debt | 468 | 298 | 500 | 1,740 | 104 | 544 | 1,300 | 2,327 | 3,850 |
| Net Debt | -856 | -1,397 | -1,160 | -1,713 | -3,251 | -3,482 | -2,236 | -1,694 | -1,144 |
| Total liabilities | 1,484 | 1,445 | 1,572 | 3,272 | 1,814 | 2,271 | 3,431 | 4,728 | 6,402 |
| Total Shareholders’ Equity | 2,756 | 3,597 | 4,189 | 4,824 | 6,528 | 8,253 | 8,961 | 10,157 | 10,570 |
| (Cash Flow) | |||||||||
| Net Operating Cash Flow | 576 | 1,246 | 651 | 1,934 | 1,941 | 1,186 | 695 | 886 | 827 |
| Capital Expenditure | 228 | 437 | 291 | 649 | 351 | 1,018 | 487 | 477 | 783 |
| Net Investing Cash Flow | -433 | -674 | -671 | -1,020 | -412 | -886 | -1,507 | -877 | -922 |
| Net Financing Cash Flow | 69 | -230 | -7 | 933 | -1,736 | 298 | 263 | 380 | 1,171 |
| Free Cash Flow | 464 | 960 | 526 | 1,440 | 1,760 | 362 | 405 | 577 | 225 |
| (Profitability %) | |||||||||
| ROA | 19.18 | 18.81 | 15.21 | 15.43 | 18.94 | 18.49 | 8.25 | 8.22 | 8.02 |
| ROE | 29.30 | 27.48 | 21.10 | 23.73 | 27.42 | 23.60 | 10.98 | 11.73 | 12.33 |
| Net Profit Margin | 8.18 | 9.31 | 7.97 | 9.44 | 12.59 | 13.00 | 6.73 | 6.37 | 5.58 |
| Asset Turnover | 2.34 | 2.02 | 1.91 | 1.63 | 1.50 | 1.42 | 1.23 | 1.29 | 1.44 |
| Financial Leverage | 1.53 | 1.46 | 1.39 | 1.54 | 1.45 | 1.28 | 1.33 | 1.43 | 1.54 |
| (Per-share) Unit: yen | |||||||||
| EPS | 44.2 | 54.7 | 51.2 | 67.4 | 98.4 | 109.7 | 59.4 | 70.4 | 80.2 |
| BPS | 174.0 | 224.1 | 263.0 | 305.5 | 411.1 | 519.1 | 563.0 | 637.6 | 662.6 |
| Dividend per Share | 4.50 | 5.50 | 6.50 | 7.00 | 10.00 | 22.50 | 22.50 | 22.50 | 22.50 |
| Shares Outstanding (Million Shares) | 15.74 | 15.94 | 16.08 | 16.10 | 16.21 | 16.27 | 16.27 | 16.28 | 16.29 |
Source: Omega Investment from company materials