2024-02-27
Home
Japanese

Omega Investment Co., Ltd.
Kidswell Bio (Company Note 3Q update)

| Share price (3/4) | ¥365 | Dividend Yield (22/3 CE) | – % |
| 52weeks high/low | ¥864 / 327 | ROE(TTM) | -23.29 % |
| Avg Vol (3 month) | 164.8 thou shrs | Operating margin (TTM) | -45.51 % |
| Market Cap | ¥11.4 bn | Beta (5Y Monthly) | 1.27 |
| Enterprise Value | ¥11.9 bn | Shares Outstanding | 31.435 mn shrs |
| PER (22/3 CE) | – X | Listed market | TSE Mothers |
| PBR (21/3 act) | 5.84 X |
| Click here for the PDF version of this page |
| PDF Version |
Third BS product goes on sale
Partnership promoted in the regenerative medicine business (SHED)
◇Summary of Financial Results for 3Q FY2022/3
Sales of GBS-007, the company’s third biosimilar (BS), commenced in December 2021 and contributed to 3Q sales; sales of the fourth BS active pharmaceutical ingredient (API) were also recorded, leading to a 90% YoY increase in 3Q FY2022/3 sales to 1.38 billion yen. The sale of investment securities generated extraordinary gain of approximately 400 million yen. The company’s pipeline and regenerative medicine projects are progressing well, but the share price continues to be affected by the overall decline in the biotech market. We will continue to monitor the company’s plans to achieve positive profitability next year.
◇Results for 3Q of FY2022/3
BS filgrastim (GBS-001) and darbepoetin alfa (GBS-011), which have already been marketed, achieved better-than-planned revenues. Ranibizumab (GBS-007), the third BS product, was launched in December 2021. It will contribute to earnings from the third quarter. Sales were significantly higher YoY (+1,383 million yen, +91.9%). The ratio of R&D expenses within SG&A is on a downward trend, mainly due to the peaking out of the development of GBS-007. As a result, the operating loss for 3Q improved by about 200 million yen YoY. The company sold investment securities in consideration of cash position and posted an extraordinary gain of about 400 million yen. After all, the net loss for the quarter was 94 million yen, a significant improvement comparing to the loss of 670 million yen in the same period last year.
On the balance sheet, cash and deposits at the end of 3Q were 1,253 million yen (vs 974 million yen at the end of 2Q) due to the above-mentioned cash inflow of about 500 million yen from the securities sales. Total assets at the end of 3Q were 3,900 million yen (vs 3,859 million yen at the end of 2Q).
◇Biosimilars business: Production and sales of GBS-007 commenced
Ranibizumab (GBS-007): Ranibizumab BS, the third product in the BS business, an anti-VEGF antibody for treating age-related macular degeneration, was launched on 9 December by the development partner Senju Pharmaceutical. The anti-VEGF antibody market in Japan alone is worth just under 100 billion yen in FY2020. Lucentis (Novartis Pharma), a direct competitor, alone is worth around 27 billion yen. The drug price is 53% of that of the original drug. As this is the first BS in the ophthalmology field, it has attracted much attention. Before sales, the company sold the bulk drug to Senju Pharmaceutical, which has been contributing to the earnings since this 3Q.
Filgrastim (GBS-001) and darbepoetin alfa (GBS-011): For BS, GBS-001 and GBS-011, which have already been launched by the partners, sales of APIs and royalties are ahead of plan. Ongoing cost-cutting measures are also helping to improve profitability.
| JPY, mn, % |
Net sales |
YoY % |
Oper. profit |
YoY % |
Ord. profit |
YoY % |
Profit ATOP |
YoY % |
EPS (¥) |
| 2018/3 | 1,059 | -2.7 | -913 | – | -903 | – | -904 | – | -47.27 |
| 2019/3 | 1,021 | -3.6 | -805 | – | -816 | – | -856 | – | -43.84 |
| 2020/3 | 1,077 | – | -1,161 | – | -1,187 | – | -7,316 | – | -264.65 |
| 2021/3 | 996 | -7.5 | -969 | – | -991 | – | -1,001 | – | -34.79 |
| 2022/3 (CE) | 1,900 | 90.7 | -1,720 | – | -1,740 | – | -1,323 | – | -58.18 |
| 2021/3 3Q | 720 | -1.7 | -647 | – | -600 | – | -670 | – | -23.43 |
| 2022/3 3Q | 1,383 | 91.9 | -432 | – | -460 | – | -94 | – | -3.08 |
Biosimilars business pipeline progress
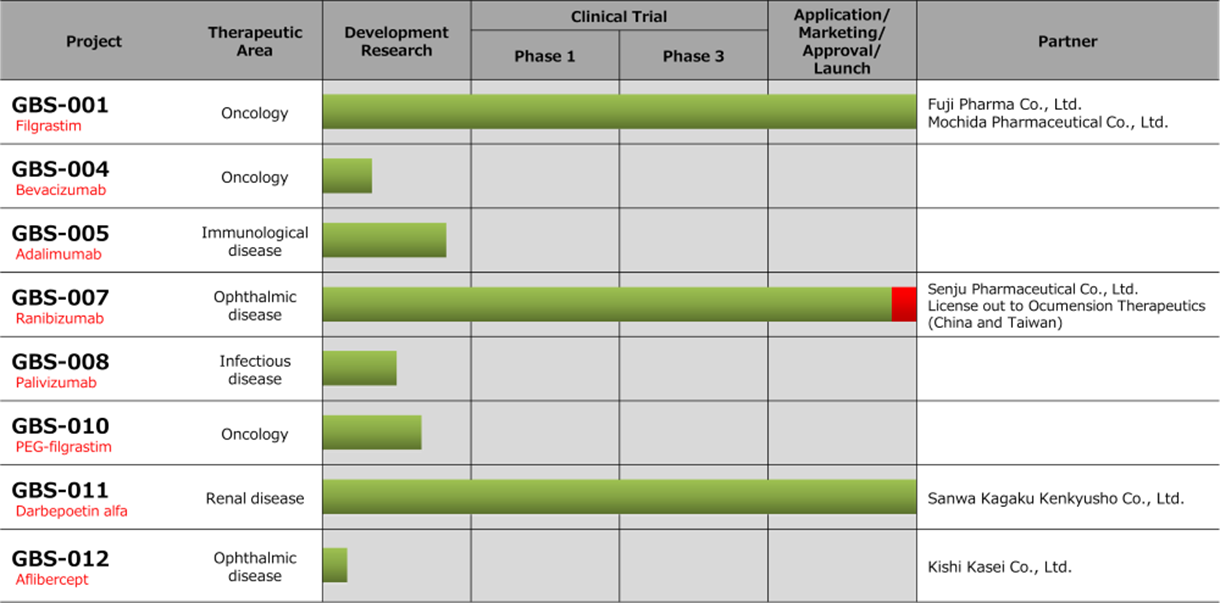
Note; ■is the new progress during 3Q.
Source: Company materials
A fourth BS : In addition to the above three products, the company is also developing a fourth BS. This year, the company recorded sales of APIs related to the development of the API manufacturing process and is targeting a launch by FY2025 in its mid-term plan.
◇Regenerative medicine: all major projects progressing
The company has made progress in the following areas of its regenerative medicine business, which it considers a key focus for the future.
Manufacturing a Master Cell Bank (MCB) : In October 2021, the company began manufacturing MCB in compliance with GMP, a vital element of the SHED business.
The establishment of a stable supply of raw materials for research and development is an important factor in the development of the SHED business. In order to produce the raw material, the company has been working with ChiVo Net for donor recruitment, promoting partnerships with university hospitals and the establishment of the MCB system with Nikon CeLL innovation, etc. With the start of GMP production, the company has made further progress towards the completion of MCB.
Designer cells : In December 2021, the company signed a development agreement with BioMimetics Sympathies (BMS) for the development of “designer cells”. BMS has a culture medium development technology. By combining it with SHED, the company aims to obtain cells with enhanced disease site orientation while retaining the vital characteristics of SHED cells suitable for bone and nerve diseases. In September 2021, the company announced that it had signed a collaborative research agreement with NanoCarrier and will consider alliances with other companies to focus on developing “designer cells” to capture modality diversification.
Business alliance with Metcela for regenerative medicine business : In January 2022, the company signed a business alliance agreement with Metcela, whose main drug discovery target is chronic organ diseases associated with fibrosis, to accelerate the research and development of regenerative medicine products. President Mr. Tani, recognized the importance of integrating the technologies and know-how of bio-venture companies through business tie-ups and other means in the development of regenerative medicine, a next-generation medical technology. The company hopes to improve the success rate and speed of growth by efficiently using the limited management resources of bio-ventures to accelerate development. The company expects to face several trials and errors in actual operations, but it will be interesting to see how it accelerates regenerative medicine development.
◇Full-year FY2022/3 forecasts
The company has not changed its full-year FY2022/3 forecasts and expects sales to increase by about 1 billion yen YoY. The increase in sales is due to solid sales of GBS-001, GBS-011 and GBS-007, as well as the sales related to the completion of MCB and sales of APIs related to the BS manufacturing process for the fourth product are recorded. As a result, the operating loss is expected to be 1.7 billion yen, larger than the previous year. The company says it would continue to strive for cost efficiencies, particularly in R&D spending.
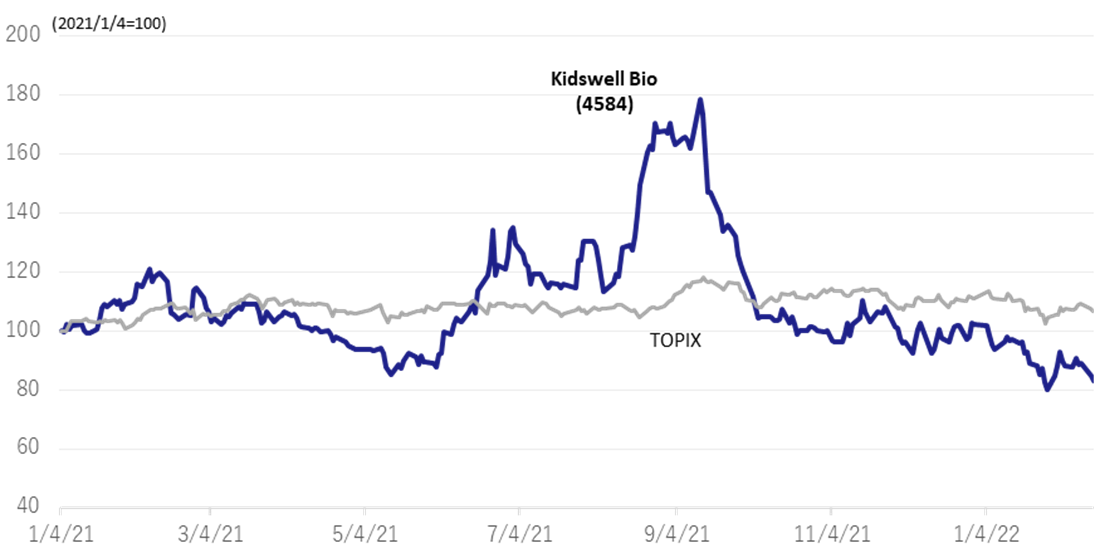
◇Share price movements
The company‘s shares rose on the back of the approval of ranibizumab BS by the First Committee on Drugs of the Japanese Ministry of Health, Labour and Welfare on 28 July 2021, reaching 864 yen on 13 September, the highest level since June 2020. However, the shares have since adjusted in line with the overall decline in biotech stocks. The company is already seeing steady growth in sales of biosimilars, and its results are ahead of plan. Management’s guidance is that the company is on track to turn profitable next year. With many biotech ventures uncertain about their prospects for achieving profitability, we are interested in the company’s FY2023/3 forecasts.
Share price history
Financial data
| FY (¥mn) | 2020/3 | 2021/3 | 2022/3 | ||||||||
| 1Q | 2Q | 3Q | 4Q | 1Q | 2Q | 3Q | 4Q | 1Q | 2Q | 3Q | |
| [Statements of income] | |||||||||||
| Net sales | 284 | 30 | 419 | 345 | 121 | 53 | 547 | 276 | 303 | 438 | 642 |
| Cost of sales | 77 | 8 | 359 | 209 | 5 | 35 | 46 | 34 | 122 | 154 | 183 |
| Gross profit | 207 | 22 | 60 | 136 | 116 | 19 | 500 | 242 | 182 | 283 | 460 |
| SG&A expenses | 417 | 423 | 381 | 365 | 354 | 463 | 465 | 565 | 491 | 425 | 442 |
| R&D expenses | 235 | 249 | 201 | 213 | 138 | 265 | 198 | 363 | 297 | 236 | 237 |
| Operating profit (loss) | -210 | -401 | -321 | -229 | -238 | -445 | 36 | -323 | -309 | -142 | 18 |
| Non-operating income | 0 | 0 | 1 | 0 | 0 | 1 | 1 | 1 | 2 | 0 | 0 |
| Non-operating expenses | 2 | 1 | 20 | 4 | 7 | 5 | 4 | 8 | 6 | 8 | 15 |
| Ordinary profit (loss) | -212 | -402 | -340 | -233 | -244 | -450 | 33 | -330 | -314 | -150 | 4 |
| Extraordinary income | 4 | 0 | 0 | 2 | 418 | ||||||
| Extraordinary expenses | 5,939 | 0 | 0 | 194 | 0 | 1 | 8 | 0 | |||
| Profit (loss) before income taxes | -6,147 | -402 | -340 | -425 | -244 | -451 | 26 | -331 | -314 | -148 | 421 |
| Total income taxes | 1 | 0 | 3 | -2 | 1 | 0 | 0 | 1 | 0 | 1 | 52 |
| Net profit (loss) | -6,147 | -403 | -342 | -424 | -245 | -451 | 25 | -330 | -314 | -149 | 369 |
| [Balance Sheets] | |||||||||||
| Current assets | 2,761 | 2,390 | 3,238 | 3,322 | 3,573 | 3,218 | 3,329 | 3,346 | 2,794 | 3,203 | 3,722 |
| Cash equivalents and short-term securities |
1,654 | 1,602 | 2,482 | 2,033 | 2,658 | 2,502 | 1,830 | 1,461 | 874 | 974 | 1,253 |
| Non-current assets | 330 | 427 | 418 | 270 | 379 | 393 | 340 | 588 | 728 | 656 | 178 |
| Tangible assets | 2 | 2 | 2 | 2 | 2 | 2 | 2 | 3 | 3 | 2 | 2 |
| Investments and other assets | 328 | 425 | 416 | 268 | 374 | 389 | 336 | 582 | 722 | 651 | 173 |
| Total assets | 3,091 | 2,817 | 3,656 | 3,592 | 3,952 | 3,611 | 3,670 | 3,934 | 3,522 | 3,859 | 3,901 |
| Current liabilities | 421 | 550 | 529 | 881 | 772 | 858 | 925 | 1,114 | 823 | 1,034 | 1,045 |
| Short-term borrowings | 25 | 25 | 25 | 25 | 25 | ||||||
| Non-current liabilities | 25 | 24 | 1,224 | 1,224 | 1,384 | 1,287 | 1,231 | 1,209 | 1,051 | 826 | 718 |
| Long-term debt | 1,200 | 1,200 | 1,340 | 1,240 | 1,200 | 1,100 | 900 | 700 | 700 | ||
| Long-term borrowing | 600 | 600 | 600 | 600 | 600 | 600 | 600 | 600 | 600 | ||
| Convertible bonds | 600 | 600 | 740 | 640 | 600 | 500 | 300 | 100 | 100 | ||
| Total liabilities | 446 | 573 | 1,752 | 2,105 | 2,156 | 2,145 | 2,156 | 2,324 | 1,873 | 1,860 | 1,763 |
| Total net assets | 2,644 | 2,244 | 1,904 | 1,487 | 1,796 | 1,466 | 1,514 | 1,610 | 1,648 | 1,999 | 2,138 |
| Total shareholders’ equity | 2,644 | 2,244 | 1,904 | 1,487 | 1,796 | 1,466 | 1,514 | 1,610 | 1,648 | 1,999 | 2,138 |
| Capital | 612 | 612 | 612 | 612 | 842 | 892 | 912 | 1,032 | 1,150 | 1,420 | 1,420 |
| Legal capital reserve | 9,917 | 9,917 | 9,917 | 9,917 | 10,147 | 10,197 | 10,217 | 10,338 | 10,456 | 10,725 | 10,726 |
| Retained earnings | -7,908 | -8,311 | -8,653 | -9,077 | -9,322 | -9,773 | -9,748 | -10,079 | -10,393 | -10,542 | -10,173 |
| Stock acquisition right | 38 | 43 | 51 | 57 | 70 | 82 | 101 | 116 | 134 | 145 | 165 |
| Total liabilities and net assets | 3,091 | 2,817 | 3,656 | 3,592 | 3,952 | 3,611 | 3,670 | 3,934 | 3,522 | 3,859 | 3,901 |
| [Statements of cash flows] | |||||||||||
| Cash flow from operating activities | -604 | -1,325 | -104 | -1,267 | -857 | ||||||
| Loss before income taxes | -6,548 | -7,314 | -695 | -999 | -462 | ||||||
| Cash flow from investing activities | -106 | -137 | -5 | -22 | – | ||||||
| Expenditure on acquisition of intangible fixed assets |
– | – | -3 | -3 | – | ||||||
| Purchase of investment securities | -100 | -100 | – | – | – | ||||||
| Cash flow from financing activities | 40 | 1,221 | 579 | 718 | 370 | ||||||
| Income from the issuance of convertible bond-type bonds with stock acquisition rights |
– | 599 | 599 | 599 | – | ||||||
| Income from issuance of shares by exercising stock acquisition rights |
40 | 40 | – | 138 | 370 | ||||||
| Income from issuance of stock acquisition rights |
– | 3 | 4 | 4 | – | ||||||
| Net increase in cash and cash equiv. | -670 | -240 | 468 | -571 | -486 | ||||||
| Cash and cash equiv. at beginning of period | 2,009 | 2,009 | 2,032 | 2,032 | 1,461 | ||||||
| Cash and cash equiv. at end of period | 1,602 | 2,032 | 2,501 | 1,461 | 974 |
Note: For the statement of cash flows, the figures for 2Q are the cumulative figures for the period from 1Q to 2Q, and the figures for 4Q are the cumulative figures for the period from 1Q to 4Q. Therefore, the opening balance is also the balance at the beginning of each quarter.
Source: Omega Investment from Company materials