2026-09-29
Home
Japanese

Omega Investment Co., Ltd.
Ricksoft (Investment report – 1Q update)
| Share price (8/13) | ¥720 | Dividend Yield (27/2 CE) | 0.0 % |
| 52weeks high/low | ¥685/1,230 | ROE(26/2 act) | 8.3 % |
| Avg Vol (3 month) | 4.1 thou shrs | Operating margin (TTM) | 3.5 % |
| Market Cap | ¥3.28 bn | Beta (5Y Monthly) | 0.10 |
| Enterprise Value | ¥1.93 bn | Shares Outstanding | 4.550 mn shrs |
| PER (27/2 CE) | 20.2 X | Listed market | TSE Growth |
| PBR (26/2 act) | 1.0 X |
| Click here for the PDF version of this page |
| PDF version |
A stable 1Q of FY2/2027 and a large cash balance. Visibility into future earnings is increasing.
Investment conclusion
The current share price appears to reflect not only the profit decline associated with structural reform, but also strong concerns about the earnings power of the core business itself. However, such pessimistic share-price valuation is not consistent with the 1Q results of FY2/2027. Although a reversal in the gross profit margin has not yet been confirmed, based on growth in Professional Services, maintenance of the operating margin, and an increase in contract liabilities, the earnings base is not as weak as the company plan indicates. At the current share price of 705 yen, new investment merits positive consideration.
In 1Q, net sales were 2.840 billion yen, down 1.1% YoY, and operating profit was 125 million yen, down 3.3% YoY. Because there was last-minute demand for licenses in the same period of the previous fiscal year, there is no need to view the apparent decrease in sales as a decline in demand. Technology Solutions sales decreased 4.1%, while Professional Services sales increased 16.3% and In-house Products sales increased 5.0%. The operating margin was maintained at 4.4%, compared with 4.5% in the same period of the previous fiscal year.
In the previous report, while evaluating the growth in contract liabilities and Professional Services, the investment conclusion was to maintain holdings because a reversal in the gross profit margin had not been confirmed. This concern remains. The gross profit margin in 1Q was 21.4%, below 21.8% in the same period of the previous fiscal year, and it cannot yet be judged that the gross profit margin has bottomed out.
On the other hand, the Company’s financial safety can continue to be evaluated positively. Cash and deposits at the end of 1Q were 3.902 billion yen, and there was no interest-bearing debt. This exceeds the market capitalization of approximately 3.208 billion yen, based on a share price of 705 yen and approximately 4.55 million shares outstanding, and downside resilience from the financial side is strong. However, the entire cash balance should not be regarded as surplus funds that can be immediately allocated to shareholder returns or growth investment; it must be evaluated in light of the funds necessary for business operations. In addition, contract liabilities reached 4.986 billion yen, and prepaid expenses reached 4.089 billion yen. Contract liabilities are advances received from customers for future sales, and prepaid expenses are mainly prepayments for corresponding license costs and other costs. These two items do not directly indicate future additional cash inflows and outflows, but they indicate that future sales and the corresponding costs have already been fixed to a considerable extent, and can be evaluated positively as factors that increase earnings visibility.
The reason for strengthening the investment conclusion is not that we regard the cash balance itself as shareholder value. In addition to the financial base in which cash and deposits exceed market capitalization, visibility into future sales is increasing through the accumulation of contract liabilities. Furthermore, 1Q profit progress and the business composition are not as weak as the current low share-price valuation suggests.
1. 1Q results and full-year plan
In 1Q of FY2/2027, net sales were 2.840 billion yen, down 1.1% YoY, gross profit was 607 million yen, down 2.9% YoY, and operating profit was 125 million yen, down 3.3% YoY. Because the foreign exchange loss recorded in the same period of the previous fiscal year did not occur in the current fiscal year, ordinary profit was 127 million yen, up 31.2% YoY, and quarterly net income attributable to owners of parent was 92 million yen, up 24.8% YoY.
By service, Technology Solutions were 2.259 billion yen, down 4.1% YoY, Professional Services were 390 million yen, up 16.3% YoY, and In-house Products were 191 million yen, up 5.0% YoY. In the sales composition ratio, Professional Services rose from 11.7% to 13.7%, and In-house Products rose from 6.3% to 6.8%. Attention should be paid to the fact that license-related sales, which create sales scale, decreased, while the two areas responsible for improving profitability grew.
The gross profit margin was 21.4%, down 0.4 points from the same period of the previous fiscal year. Rising license costs continue to pressure profitability. On the other hand, SG&A expenses were 481 million yen, down 2.7% YoY, and the SG&A ratio was 17.0%, while the operating margin remained at 4.4%. Although the gross profit margin issue has not been resolved, the deterioration in the operating margin has stopped due to profit contributions from Professional Services and cost management.
The full-year company plan is net sales of 12.195 billion yen, up 12.0% YoY, operating profit of 200 million yen, down 46.7% YoY, ordinary profit of 200 million yen, down 43.8% YoY, and net income attributable to owners of parent of 160 million yen, down 39.3% YoY. The 1Q progress rates were 23.3% for net sales, 62.6% for operating profit, 63.7% for ordinary profit, and 58.0% for net income.
The operating profit plan for the remaining nine months is only 75 million yen. The Company has kept the plan unchanged because it is undergoing structural reform, and expenses associated with human resource investment, overseas business, and organizational restructuring may increase in the second half. Even so, unless the operating margin declines significantly from 2Q onward, there is a high possibility that full-year profit will exceed the company plan. An upward revision to the full-year plan would be the clearest catalyst for a share-price reappraisal.
2. Business structure and Reignite2030
The Company’s revenue structure is composed of Technology Solutions as the foundation for customer acquisition and sales scale, Professional Services to convert customer touchpoints into profit, and In-house Products to target recurring revenue and overseas growth. Rather than evaluating the three businesses independently, they should be viewed as a series of relationships in which transactions expand from license implementation to consulting, design, operations, and in-house products.
Technology Solutions creates touchpoints with large enterprise customers through licensing and cloud migration centered on Atlassian products, as well as the implementation of related software. Although the sales scale is large, it is difficult to raise profitability with this business alone because it is affected by procurement costs. The key KPIs are the sales composition between cloud and on-premises versions, renewal rate, number of large customers, and sales per customer.
Professional Services provides consulting, design, system construction, operations, and training, and is deeply involved in customers’ business processes. Project unit prices, order backlog, number of personnel, utilization rate, and contract continuation rate drive sales and profits. The 16.3% increase in 1Q indicates that the shift toward the strategic partner-type model targeted by Reignite2030 is progressing, but only when a rise in the company-wide gross profit margin can be confirmed can it be evaluated that business transformation has been linked to shareholder value.
In-house Products sells software that complements Atlassian products in Japan and overseas. If the Company can increase the number of customers while restraining the number of personnel needed for additional sales, it will contribute to improvement in the company-wide profit margin and ROIC. The key KPIs are the number of contracts in Japan and overseas, renewal rate, churn rate, sales per customer, and overseas sales ratio.
Under Reignite2030, the Company will execute investments totaling approximately 6.0 billion yen by 2030 and aims for EBITDA of 3.0 billion yen in 2030. Investment targets are business model transformation, development of the foundation for the consulting business, industry-specific specialist teams, overseas expansion, recruitment of personnel, and corporate acquisitions. The direction is reasonable, but the distance from EBITDA of approximately 435 million yen in FY2/2026 is large. Showing annual investment amounts, number of additional personnel, order amounts, gross profit, and contribution to EBITDA will enhance the evaluation of the long-term plan.
In overseas expansion, in addition to the U.S. subsidiary, the Company is proceeding with an alliance with a Vietnamese company and the establishment of Ricksoft Singapore. The overseas strategy has two roles: expanding the sales regions for In-house Products and providing implementation support, including overseas bases of Japanese companies. At present, disclosure of sales, order amounts, profits, and the number of customers by overseas base is limited, so the contribution to share-price valuation is small. Going forward, what matters will not be the number of bases, but quantification of joint projects, the number of customers, gross profit, and profit contribution.
3. Contract liabilities and future earnings
Visibility into sales has increased. Going forward, attention should be paid to contribution to profitability.
Contract liabilities increased from 4.476 billion yen at the end of FY2/2026 to 4.986 billion yen at the end of 1Q. The three-month increase was 510 million yen, and the YoY increase was 50.8%. Contract liabilities account for approximately half of total assets.
Contract liabilities are the portion of payments received from customers in advance that have not yet been recognized as sales. The Company records contract liabilities when it receives payments from customers and records prepaid expenses when it pays license fees to suppliers such as Atlassian. Thereafter, as the contract period elapses, contract liabilities are reclassified to net sales, and prepaid expenses are reclassified to cost of sales. Therefore, these two items do not directly indicate future additional cash inflows and outflows, but show the accumulation of sales and costs that will be recognized in profit and loss going forward.
If long-term contracts such as cloud licenses, support, and operational support increase, visibility into future sales will increase. The shift from one-off license sales to continuous support is also consistent with the strategic partner-type business model targeted by Reignite2030.
On the other hand, for the increase in contract liabilities to lead to enhancement of shareholder value, it is important to secure sufficient profit when future sales are recognized. Contract liabilities and prepaid expenses mainly represent the sales side and cost side of the same contracts, but the disclosure materials do not confirm that the two correspond completely on a one-to-one basis. For this reason, it is difficult to judge future profits based only on growth in contract liabilities, and the key point is the amount of gross profit generated when contract liabilities are recognized as sales.
Going forward, in addition to the balance of contract liabilities, we want to confirm the amount transferred from contract liabilities to sales, the corresponding prepaid expenses, and the amount of gross profit at the time of sales conversion. The foundations for orders and future sales are steadily accumulating, and the future focus is on the degree of profitability linked to sales and profits.
4. Finance, capital efficiency, and capital allocation
Large cash balance and accumulation of contract liabilities. The focus of valuation is the conversion of future sales into profits
Cash and deposits at the end of 1Q were 3.902 billion yen, and there was no interest-bearing debt. Market capitalization based on the current share price of 705 yen is approximately 3.208 billion yen, and the cash balance exceeding market capitalization indicates downside resilience from a financial perspective. On the other hand, contract liabilities of 4.986 billion yen and prepaid expenses of 4.089 billion yen are recorded on the Company’s balance sheet. This reflects the business structure in which advances received from customers and prepayments to suppliers occur at the same time, and the increase in contract liabilities can be evaluated positively as an improvement in visibility into future sales. The important point going forward is the extent of gross profit that accompanies contract liabilities when they are transferred to sales.
As shown in the table, cash and deposits of 3.902 billion yen at the end of 1Q exceed the market capitalization of approximately 3.208 billion yen based on the current share price of 705 yen. However, this does not mean that the entire cash balance should be regarded as surplus funds or as funds that can immediately be converted into shareholder value. This is because structural reform, human resource investment, overseas expansion, and day-to-day business operations require a certain amount of funds. Even so, the financial structure of having no interest-bearing debt and a cash balance exceeding market capitalization can be evaluated as a factor supporting downside resilience when the share price declines. On the other hand, the accumulation of contract liabilities of 4.986 billion yen and prepaid expenses of 4.089 billion yen indicates that future sales and the corresponding costs have been fixed to a considerable extent. Since these two items do not directly indicate future additional cash inflows and outflows, it is appropriate to view them as indicators of visibility into future earnings rather than deduct them from the cash balance in the valuation. The focus of valuation is the extent to which the Company can secure a gross profit margin and cash generation capability when contract liabilities are transferred to sales.
Forecast ROE is 4.8%, which is not a high level for a growth company. From FY2/2021 to FY2/2026, net sales increased from 4.431 billion yen to 10.893 billion yen, while the operating margin declined from 13.6% to 3.5% and ROE declined from 26.7% to 8.3%. The decline in profitability and capital efficiency relative to sales growth has depressed share-price valuation.
In capital allocation, it is important to clarify the relationship between cumulative investment of 6.0 billion yen through 2030 and shareholder returns. If, after securing the financial capacity necessary for business operations and growth investment, the priorities and amount frameworks for corporate acquisitions, human resource investment, share repurchases, and dividends are shown for residual funds, the stock market will find it easier to evaluate the value of cash.
| Item | Amount |
| Market capitalization | 3.208billion yen |
| Cash and deposits | 3.902billion yen |
| Contract liabilities | 4.986billion yen |
| Prepaid expenses | 4.089billion yen |
5. Share price, valuation, and market expectations
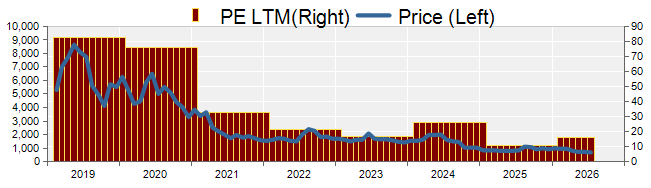
Over the past five years, the share price has reflected the decline in profitability more heavily than sales growth. From 2021 to the first half of 2022, against the backdrop of growth expectations for DX demand, cloud migration, and Atlassian-related business, the share price generally moved in the 1,500 yen to 2,000 yen range. Sales continued to increase thereafter, but the gross profit margin and operating margin continued to decline, and share-price valuation multiples declined in stages.
From 2025 to the beginning of 2026, the share price generally moved in the range of 800 yen to 1,100 yen, but it declined after the higher sales and lower profits in FY2/2026 and the plan for a substantial profit decline in FY2/2027. At a share price of 705 yen, PBR is 0.96x, and it has declined further since April. The background to the lackluster share price despite stable earnings and an increase in contract liabilities is that sales growth has not been linked to EPS growth, no dividends have continued, the market continues to find it difficult to evaluate the profitability of long-term investment, and share liquidity is low.
This is not because customer demand or financial safety is weak, but because the market’s view remains cautious regarding profitability, capital allocation, the feasibility of the long-term plan, and share liquidity.
The forecast PER calculated from the share price of 705 yen and forecast EPS of 35.5 yen is 19.9x. Under a simple earnings capitalization model using a cost of equity of 8.0%, the long-term EPS growth rate priced into the share price is approximately 3.0%. If the cost of equity is 8.5%, the rate is approximately 3.5%, and if it is 9.0%, the rate is approximately 4.0%. The long-term EPS growth rate required by the market is roughly 3% to 4% per year.
On the other hand, the five-year CAGR from EPS of 103.6 yen in FY2/2021 to EPS of 58.7 yen in FY2/2026 is negative 10.7%. The sales CAGR over the same period was 19.7%, and sales expansion did not lead to EPS growth. Compared with past results, the market is pricing in profit recovery, but if the Company’s forecast EPS of 35.5 yen is near the bottom in the structural reform period, an annual growth rate of 3% to 4% is not a high requirement.
Fair value based on three methods
Under the PBR method, an appropriate PBR of 1.0x to 1.3x was applied to actual BPS of 737 yen. While the forecast ROE of 4.8% and the continuation of no dividends restrain the valuation multiple, considering the financial base in which cash and deposits exceed market capitalization and the profitable business, it is difficult to view a level consistently below 1x PBR as appropriate. Fair value was set at 737 yen to 958 yen, with a central value of 848 yen.
Under the DCF method, the assumption is that operating profit and free cash flow will recover in stages from the company plan as the starting point. The discount rate is 8.0% to 9.0%, and the perpetual growth rate is 1.0%; the target of EBITDA of 3.0 billion yen in 2030 is not fully incorporated. Cash is considered not as simple net cash, but also taking into account ordinary working capital. Fair value was set at 900 yen to 1,250 yen, with a central value of 1,075 yen.
Under the ROIC method, while reflecting the recent decline in capital efficiency, the assumption is that ROIC will recover to 6% to 8% in the medium term due to growth in Professional Services. Fair value was set at 800 yen to 1,050 yen, with a central value of 925 yen.
| Method | Assumption | Fair value range | Central value |
| PBR method | BPS of 737 yen; PBR of 1.0x to 1.3x | 737 yen to 958 yen | 848 yen |
| DCF method | Discount rate of 8.0% to 9.0%; perpetual growth rate of 1.0% | 900 yen to 1,250 yen | 1,075 yen |
| ROIC method | Medium-term ROIC of 6% to 8% | 800 yen to 1,050 yen | 925 yen |
The central values of the three methods are 848 yen, 1,075 yen, and 925 yen, and the median is 925 yen. The comprehensive range is 737 yen to 1,250 yen. The current share price of 705 yen is below the lower end of the range, and the upside to the median is 31.2%.
6. Shareholder composition
FactSet data show that the total ownership ratio of major holders is 67.84%. HS holds 43.95%, Hikari Tsushin holds 10.27%, SPARX Asset Management holds 3.72%, Mr. Hiroshi Onuki holds 3.28%, Mr. Norio Hattori holds 2.47%, and Sawakami Asset Management holds 1.91%. The change in the number of shares held over the most recent six months is stated as zero for all of them.
The presence of stable shareholders restrains large short-term sales and makes it easier for the Company to proceed with medium- to long-term structural reform. On the other hand, due to concentration among top shareholders, the number of shares traded in the market is limited, and it is difficult for institutional investors to acquire shares of a certain scale. Shareholder composition can support the downside for the share price, but low liquidity restrains the spread of share-price valuation. Going forward, we want to confirm volume, trends in Hikari Tsushin’s holdings, use of treasury shares, and expansion of the investor base through IR activities.
7. Conditions for share-price reappraisal and monitoring items
The most direct catalyst for share-price reappraisal is an upward revision to the full-year profit plan. The 1Q operating profit progress rate reached 62.6%. If the operating margin is stable in 2Q as well, it will indicate that the profit decline caused by structural reform is not as large as the company plan suggests.
The next important point is a reversal in the gross profit margin. If growth in Professional Services leads not only to an increase in the sales composition ratio, but also to an increase in company-wide gross profit and the operating margin, the results of structural reform can be confirmed. Regarding contract liabilities, disclosure showing not only an increase in the balance but also the amount transferred to sales, the corresponding prepaid expenses, and the contribution to gross profit is desirable.
In capital allocation, after securing the financial capacity necessary for business operations and growth investment, it is important to clarify the priorities and amounts for growth investment, corporate acquisitions, share repurchases, and dividends for residual funds. In overseas business, we want to confirm order amounts, net sales, the number of customers, and profit contribution from Ricksoft Singapore and the Vietnam business.
| Item to confirm | Investment significance |
| Gross profit margin and gross profit | Whether the rise in license costs has stopped and improvement in the service composition has been linked to profit |
| Professional Services | Sales growth rate, composition ratio, project unit prices, number of personnel, and utilization rate |
| Contract liabilities and prepaid expenses | Balance between the increase in future sales and the corresponding procurement burden |
| Transfer of contract liabilities to sales | The amount of gross profit generated when accumulated contracts were converted into sales |
| In-house Products | Number of contracts in Japan and overseas, renewal rate, churn rate, and overseas sales ratio |
| Operating cash flow | Cash generation capability excluding changes in contract liabilities, prepaid expenses, and trade payables |
| ROIC | Whether the cumulative investment of 6.0 billion yen generates profits exceeding the cost of capital |
| Capital allocation | Priorities and amounts for growth investment, corporate acquisitions, share repurchases, and dividends |
Fair value based on three methods
Under the PBR method, an appropriate PBR of 1.0x to 1.3x was applied to actual BPS of 737 yen. While the forecast ROE of 4.8% and the continuation of no dividends restrain the valuation multiple, considering the profitable business, it is difficult to view a level consistently below 1x PBR as appropriate. Fair value was set at 737 yen to 958 yen, with a central value of 848 yen.
Under the DCF method, the assumption is that operating profit and free cash flow will recover in stages from the company plan as the starting point. The discount rate is 8.0% to 9.0%, and the perpetual growth rate is 1.0%; the target of EBITDA of 3.0 billion yen in 2030 is not fully incorporated. Cash is considered not as simple net cash, but also taking into account ordinary working capital. Fair value was set at 900 yen to 1,250 yen, with a central value of 1,075 yen.
Under the ROIC method, while reflecting the recent decline in capital efficiency, the assumption is that ROIC will recover to 6% to 8% in the medium term due to growth in Professional Services. Fair value was set at 800 yen to 1,050 yen, with a central value of 925 yen.
8. Final evaluation
The 1Q results did not show that the gross profit margin issue was resolved. License costs continued to rise, and the gross profit margin was below the same period of the previous fiscal year. The concerns over profitability pointed out in the previous report remain.
On the other hand, Professional Services increased 16.3%, In-house Products increased 5.0%, and the operating margin was maintained at 4.4%. Contract liabilities increased to 4.986 billion yen, and operating profit reached 62.6% of the full-year plan. Customer demand, the foundation for future sales, and financial safety remain intact.
The Company’s cash and deposits at the end of 1Q were 3.902 billion yen, and there was no interest-bearing debt. This exceeds the market capitalization of approximately 3.208 billion yen based on the current share price of 705 yen, and downside resilience from the financial side is strong. However, the entire cash balance should not be regarded as surplus funds immediately attributable to shareholder value; it must be evaluated in light of the funds necessary for structural reform, human resource investment, overseas expansion, and ordinary business operations. Contract liabilities of 4.986 billion yen and prepaid expenses of 4.089 billion yen are accounting items that show the accumulation of future sales and corresponding costs, and it is appropriate to view them not as items to be mechanically deducted from the cash balance, but as material that increases visibility into future earnings.
The median fair value based on the three methods was 925 yen, and the range was 737 yen to 1,250 yen. The current share price of 705 yen is below the lower end of the range. A share-price reappraisal requires a reversal in the gross profit margin, an upward revision to the full-year profit plan, and quantification of capital allocation, but 1Q showed that the rapid deterioration in profit margins had not continued.
The investment appeal of the Company’s shares does not depend solely on the cash balance. In addition to a financial base with cash exceeding market capitalization, visibility into future sales through the accumulation of contract liabilities, growth in Professional Services, and high progress toward the full-year profit plan in 1Q can be confirmed. Although a reversal in the gross profit margin has not yet been confirmed, at the current share price of 705 yen, we take a positive view of new investment and judge that it is reasonable for existing shareholders to continue holding.
*Note: The figures in this report were prepared based on company-published materials, FactSet data, and provided materials.
Key stock price data
Key financial data
| Unit: million yen | 2022/2 | 2023/2 | 2024/2 | 2025/2 | 2026/2 | 2027/2 CE |
| Sales | 4,308 | 5,623 | 7,491 | 9,044 | 10,893 | 12,195 |
| EBIT (Operating Income) | 437 | 547 | 666 | 459 | 377 | 200 |
| Pretax Income | 450 | 567 | 350 | 462 | 357 | 200 |
| Net Profit Attributable to Owner of Parent | 327 | 424 | 269 | 356 | 264 | 160 |
| Cash & Short-Term Investments | 2,089 | 3,071 | 3,158 | 3,297 | 3,939 | |
| Total assets | 2,939 | 4,577 | 5,971 | 6,687 | 9,633 | |
| Total Debt | 0 | 0 | 0 | 0 | 0 | |
| Net Debt | -2,089 | -3,071 | -3,158 | -3,297 | -3,939 | |
| Total liabilities | 684 | 2,103 | 3,203 | 3,658 | 6,316 | |
| Total Shareholders’ Equity | 2,255 | 2,474 | 2,768 | 3,029 | 3,316 | |
| Net Operating Cash Flow | 161 | 978 | 100 | 377 | 697 | |
| Capital Expenditure | 61 | 25 | 30 | 95 | 18 | |
| Net Investing Cash Flow | -47 | -27 | -37 | -140 | -35 | |
| Net Financing Cash Flow | 23 | 18 | 7 | -91 | 0 | |
| Free Cash Flow | 110 | 968 | 86 | 298 | 687 | |
| ROA (%) | 10.69 | 11.28 | 5.10 | 5.62 | 3.23 | |
| ROE (%) | 15.73 | 17.92 | 10.26 | 12.27 | 8.31 | |
| EPS (Yen) | 74.5 | 94.4 | 59.2 | 78.6 | 58.7 | 35.6 |
| BPS (Yen) | 507.2 | 547.4 | 608.3 | 676.1 | 737.0 | |
| Dividend per Share (Yen) | 0.00 | 0.00 | 0.00 | 0.00 | 0.00 | 0.00 |
| Shares Outstanding (Million shares) | 4.37 | 4.51 | 4.55 | 4.55 | 4.55 |
Source: Omega Investment from company data, rounded to the nearest whole number.
Share price
Financial data (quarterly basis)
| Unit: million yen | 2025/2 | 2026/2 | 2027/2 | ||||||
| 1Q | 2Q | 3Q | 4Q | 1Q | 2Q | 3Q | 4Q | 1Q | |
| (Income Statement) | |||||||||
| Sales | 2,047 | 2,263 | 2,289 | 2,445 | 2,872 | 2,254 | 2,944 | 2,822 | 2,840 |
| Year-on-year | 30.2% | 18.7% | 25.8% | 11.5% | 40.3% | -0.4% | 28.6% | 15.4% | -1.1% |
| Cost of Goods Sold (COGS) | 1,429 | 1,703 | 1,711 | 1,826 | 2,247 | 1,722 | 2,319 | 2,231 | 2,233 |
| Gross Income | 617 | 560 | 577 | 619 | 625 | 532 | 625 | 590 | 608 |
| Gross Income Margin | 30.2% | 24.7% | 25.2% | 25.3% | 21.8% | 23.6% | 21.2% | 20.9% | 21.4% |
| SG&A Expense | 470 | 485 | 493 | 468 | 495 | 495 | 496 | 510 | 482 |
| EBIT (Operating Income) | 148 | 76 | 84 | 151 | 130 | 37 | 129 | 80 | 126 |
| Year-on-year | 0.7% | -48.0% | -42.3% | -33.5% | -11.9% | -50.7% | 53.6% | -47.0% | -3.3% |
| Operating Income Margin | 7.2% | 3.3% | 3.7% | 6.2% | 4.5% | 1.7% | 4.4% | 2.8% | 4.4% |
| EBITDA | 155 | 83 | 97 | 167 | 145 | 51 | 144 | 95 | 140 |
| Pretax Income | 155 | 77 | 85 | 145 | 97 | 41 | 135 | 84 | 128 |
| Consolidated Net Income | 115 | 62 | 68 | 111 | 74 | 36 | 102 | 52 | 93 |
| Minority Interest | 0 | 0 | 0 | 0 | 0 | 0 | 0 | 0 | 0 |
| Net Income ATOP | 115 | 62 | 68 | 111 | 74 | 36 | 102 | 52 | 93 |
| Year-on-year | 11.9% | -143.6% | -48.5% | -37.3% | -35.5% | -42.5% | 51.1% | -53.2% | 24.8% |
| Net Income Margin | 5.6% | 2.7% | 3.0% | 4.5% | 2.6% | 1.6% | 3.5% | 1.8% | 3.3% |
| (Balance Sheet) | |||||||||
| Cash & Short-Term Investments | 3,375 | 3,442 | 3,192 | 3,297 | 3,142 | 3,930 | 3,782 | 3,939 | 3,902 |
| Total assets | 6,291 | 6,588 | 6,004 | 6,687 | 7,365 | 7,533 | 8,426 | 9,639 | 9,872 |
| Total Debt | 0 | 0 | 0 | 0 | 0 | 0 | 0 | 0 | 0 |
| Net Debt | -3,375 | -3,442 | -3,192 | -3,297 | -3,142 | -3,930 | -3,782 | -3,939 | -3,902 |
| Total liabilities | 3,398 | 3,661 | 3,083 | 3,658 | 4,275 | 4,397 | 5,158 | 6,323 | 6,451 |
| Total Shareholders’ Equity | 2,893 | 2,927 | 2,921 | 3,029 | 3,090 | 3,137 | 3,268 | 3,316 | 3,421 |
| (Profitability %) | |||||||||
| ROA | 4.99 | 8.53 | 7.12 | 5.62 | 4.61 | 4.08 | 4.48 | 3.23 | 3.27 |
| ROE | 10.26 | 18.03 | 15.31 | 12.27 | 10.52 | 9.51 | 10.43 | 8.31 | 8.67 |
| (Per-share) Unit: JPY | |||||||||
| EPS | 25.3 | 13.6 | 15.1 | 24.8 | 16.6 | 7.9 | 22.7 | 11.5 | 20.6 |
| BPS | 635.7 | 643.9 | 652.0 | 676.1 | 689.7 | 697.1 | 726.3 | 737.0 | 760.2 |
| Dividend per Share | 0.00 | 0.00 | 0.00 | 0.00 | 0.00 | 0.00 | 0.00 | 0.00 | 0.00 |
| Shares Outstanding(million shares) | 4.55 | 4.55 | 4.55 | 4.55 | 4.55 | 4.55 | 4.55 | 4.55 | 4.55 |
Source: Omega Investment from company materials
Financial data (full-year basis)
| Unit: million yen | 2020 | 2021 | 2022 | 2023 | 2024 | 2025 | 2026 |
| (Income Statement) | |||||||
| Sales | 3,089 | 4,431 | 4,308 | 5,623 | 7,491 | 9,044 | 10,893 |
| Year-on-year | 24.4% | 43.5% | -2.8% | 30.5% | 33.2% | 20.7% | 20.4% |
| Cost of Goods Sold | 1,904 | 2,868 | 2,779 | 3,759 | 5,249 | 6,670 | 8,519 |
| Gross Income | 1,184 | 1,563 | 1,529 | 1,864 | 2,242 | 2,374 | 2,373 |
| Gross Income Margin | 38.3% | 35.3% | 35.5% | 33.1% | 29.9% | 26.2% | 21.8% |
| SG&A Expense | 782 | 961 | 1,091 | 1,317 | 1,576 | 1,915 | 1,997 |
| EBIT (Operating Income) | 402 | 602 | 437 | 547 | 666 | 459 | 377 |
| Year-on-year | 8.3% | 49.6% | -27.3% | 25.0% | 21.7% | -31.1% | -17.8% |
| Operating Income Margin | 13.0% | 13.6% | 10.2% | 9.7% | 8.9% | 5.1% | 3.5% |
| EBITDA | 416 | 617 | 467 | 566 | 691 | 502 | 435 |
| Pretax Income | 403 | 601 | 450 | 567 | 350 | 462 | 357 |
| Consolidated Net Income | 289 | 446 | 327 | 424 | 269 | 356 | 264 |
| Minority Interest | 0 | 0 | 0 | 0 | 0 | 0 | 0 |
| Net Income ATOP | 289 | 446 | 327 | 424 | 269 | 356 | 264 |
| Year-on-year | 13.0% | 54.3% | -26.7% | 29.7% | -36.5% | 32.2% | -25.8% |
| Net Income Margin | 9.4% | 10.1% | 7.6% | 7.5% | 3.6% | 3.9% | 2.4% |
| (Balance Sheet) | |||||||
| Cash & Short-Term Investments | 1,458 | 1,944 | 2,089 | 3,071 | 3,158 | 3,297 | 3,939 |
| Total assets | 1,922 | 3,180 | 2,939 | 4,577 | 5,971 | 6,687 | 9,633 |
| Total Debt | 0 | 0 | 0 | 0 | 0 | 0 | 0 |
| Net Debt | -1,458 | -1,944 | -2,089 | -3,071 | -3,158 | -3,297 | -3,939 |
| Total liabilities | 484 | 1,279 | 684 | 2,103 | 3,203 | 3,658 | 6,316 |
| Total Shareholders’ Equity | 1,437 | 1,901 | 2,255 | 2,474 | 2,768 | 3,029 | 3,316 |
| (Cash Flow) | |||||||
| Net Operating Cash Flow | 316 | 478 | 161 | 978 | 100 | 377 | 697 |
| Capital Expenditure | 13 | 9 | 61 | 25 | 30 | 95 | 18 |
| Net Investing Cash Flow | -43 | -8 | -47 | -27 | -37 | -140 | -35 |
| Net Financing Cash Flow | 152 | 19 | 23 | 18 | 7 | -91 | 0 |
| Free Cash Flow | 303 | 469 | 110 | 968 | 86 | 298 | 687 |
| (Profitability ) | |||||||
| ROA (%) | 16.97 | 17.47 | 10.69 | 11.28 | 5.10 | 5.62 | 3.23 |
| ROE (%) | 23.80 | 26.70 | 15.73 | 17.92 | 10.26 | 12.27 | 8.31 |
| Net Margin (%) | 9.35 | 10.06 | 7.59 | 7.54 | 3.59 | 3.93 | 2.42 |
| Asset Turn | 1.81 | 1.74 | 1.41 | 1.50 | 1.42 | 1.43 | 1.33 |
| Assets/Equity | 1.40 | 1.53 | 1.47 | 1.59 | 2.01 | 2.18 | 2.57 |
| (Per-share) Unit: JPY | |||||||
| EPS | 68.5 | 103.6 | 74.5 | 94.4 | 59.2 | 78.6 | 58.7 |
| BPS | 336.0 | 436.6 | 507.2 | 547.4 | 608.3 | 676.1 | 737.0 |
| Dividend per Share | 0.00 | 0.00 | 0.00 | 0.00 | 0.00 | 0.00 | 0.00 |
| Shares Outstanding (million shares) | 4.20 | 4.29 | 4.37 | 4.51 | 4.55 | 4.55 | 4.55 |
Source: Omega Investment from company materials